

Flink SQL> CREATE TABLE bounded_pageviews (
>     url STRING,
>     ts TIMESTAMP(3)
> )
> WITH (
>     'connector' = 'faker',
>     'number-of-rows' = '500',
>     'rows-per-second' = '100',
>     'fields.url.expression' = '/#{GreekPhilosopher.name}.html',
>     'fields.ts.expression' = '#{date.past ''5'', ''1'', ''SECONDS''}'
> );
[INFO] Execute statement succeeded.
Note:
1. Must use '' for assigning values, even if the values are numeric. Using "" doesn't work.
2. The parameters must be single quoted.
Flink SQL> SELECT * FROM bounded_pageviews LIMIT 10;
[ERROR] Could not execute SQL statement. Reason:
org.apache.flink.table.api.ValidationException: Could not find any factory for identifier 'faker' that implements 'org.apache.flink.table.factories.DynamicTableFactory' in the classpath.

Available factory identifiers are:

blackhole
datagen
filesystem
kafka
legacy-csv
print
python-arrow-source
python-input-format
upsert-kafka
It looks like you are trying to use the Flink Faker connector to generate mock data, but Flink can't find the necessary JAR file in its classpath.
The error occurs because the faker identifier isn't built into the standard Flink distribution. To fix this, you need to provide the connector dependency to your Flink session.
How to Fix the "Factory Not Found" Error
You have two main ways to resolve this depending on how you are running Flink:
1. Add the JAR to the /lib directory (Permanent)
If you are running a local Flink cluster or using Docker, download the latest flink-faker JAR and place it in the lib/ folder of your Flink installation.
-
Restart the cluster after adding the file.
-
The SQL Client will automatically pick up any JARs in that folder upon startup.
2. Load the JAR in the SQL Client (Temporary)
If you don't want to restart your cluster, you can pull the dependency directly into your SQL CLI session using the ADD JAR command:
-- Replace the URL with the version matching your Flink setup
ADD JAR 'https://repo1.maven.org/maven2/com/github/knaufk/flink-faker/0.5.3/flink-faker-0.5.3.jar';
After running this, try your SELECT statement again.
Why this happens: The Flink Factory Architecture
Flink uses a Service Provider Interface (SPI) to discover connectors. When you define a table with 'connector' = 'faker', Flink scans the classpath for a "Factory" that matches that string.
As seen in your error message, the only connectors currently "known" to your environment are:
-
datagen: The built-in random data generator (use this if you don't want to download external JARs).
-
filesystem/kafka: Standard I/O connectors.
-
print/blackhole: Used for testing outputs.
Alternative: Using Built-in datagen
If you just need random data and don't specifically need the "fake" names/addresses provided by Faker, you can use the built-in generator which requires no extra JARs:
CREATE TABLE bounded_pageviews (
  user_id INT,
  url STRING
) WITH (
  'connector' = 'datagen',
  'number-of-rows' = '10' -- Makes it bounded
);
Flink SQL> DROP TABLE bounded_pageviews;
[INFO] Execute statement succeeded.

Flink SQL> CREATE TABLE bounded_pageviews (
>     url STRING,
>     ts TIMESTAMP(3)
> )
> WITH (
>     'connector' = 'datagen',
>     'number-of-rows' = '500',
>     'rows-per-second' = '100',
>     'fields.url.expression' = '/#{GreekPhilosopher.name}.html',
>     'fields.ts.expression' = '#{date.past ''5'', ''1'', ''SECONDS''}'
> );
[INFO] Execute statement succeeded.
Flink SQL> SELECT * FROM bounded_pageviews LIMIT 10;
[ERROR] Could not execute SQL statement. Reason:
org.apache.flink.table.api.ValidationException: Unsupported options found for 'datagen'.

Unsupported options:

fields.ts.expression
fields.url.expression

Supported options:

connector
fields.ts.kind
fields.ts.max-past
fields.ts.null-rate
fields.url.kind
fields.url.length
fields.url.null-rate
fields.url.var-len
number-of-rows
rows-per-second
scan.parallelism
Flink SQL> DROP TABLE bounded_pageviews;
[INFO] Execute statement succeeded.

Flink SQL> CREATE TABLE bounded_pageviews (
>     url STRING,
>     ts  TIMESTAMP(3)
> )
> WITH (
>     'connector' = 'datagen',
>     'number-of-rows' = '500',
>     'rows-per-second' = '100'
> );
[INFO] Execute statement succeeded.
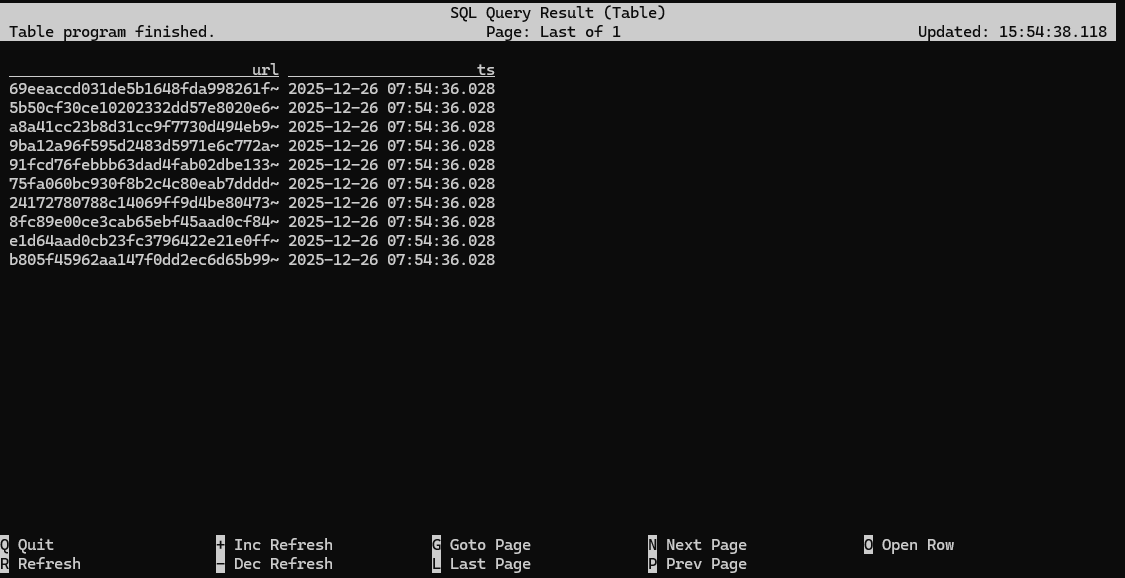
Flink SQL> SELECT * FROM bounded_pageviews LIMIT 10;
Flink SQL> SET 'execution.runtime-mode' = 'batch';
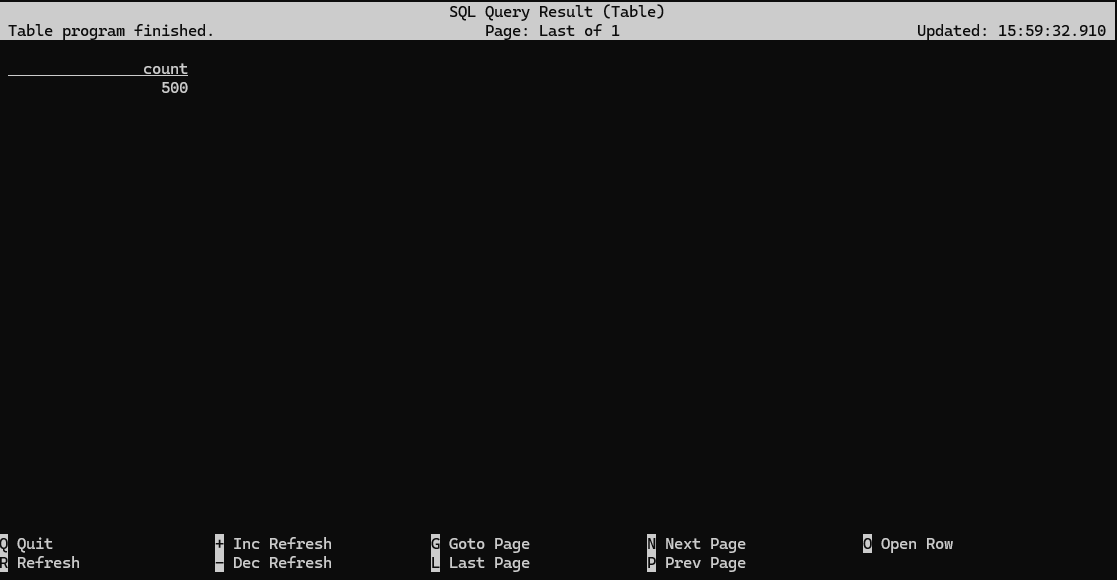
Flink SQL> SELECT COUNT(*) AS count FROM bounded_pageviews;
[ERROR] Could not execute SQL statement. Reason:
org.apache.flink.sql.parser.impl.ParseException: Encountered "count" at line 1, column 20.
Was expecting one of:
    <QUOTED_STRING> ...
    <BRACKET_QUOTED_IDENTIFIER> ...
    <QUOTED_IDENTIFIER> ...
    <BACK_QUOTED_IDENTIFIER> ...
    <BIG_QUERY_BACK_QUOTED_IDENTIFIER> ...
    <HYPHENATED_IDENTIFIER> ...
    <IDENTIFIER> ...
    <UNICODE_QUOTED_IDENTIFIER> ...

Flink SQL> SELECT COUNT(*) AS 'count' FROM bounded_pageviews;
[ERROR] Could not execute SQL statement. Reason:
org.apache.calcite.sql.validate.SqlValidatorException: Expecting alias, found character literal

Flink SQL> SELECT COUNT(*) AS `count` FROM bounded_pageviews;
Flink SQL> SET 'execution.runtime-mode' = 'streaming';
Flink SQL> SELECT COUNT(*) AS `count` FROM streaming_pageviews;
If you look closely, you will see the count increment from 100 to 200, etc, up to 500. Again, this will take 5 seconds.
To make it clearer what's going on, you should also change how the results are being displayed. This won't affect the internal behavior of the runtime, but it will change how the SQL Client displays the results. In changelog mode, the SQL Client doesn't just update the count in place, but instead displays each message in the stream of updates it's receiving from the Flink SQL runtime.
Flink SQL> SET 'sql-client.execution.result-mode' = 'changelog';
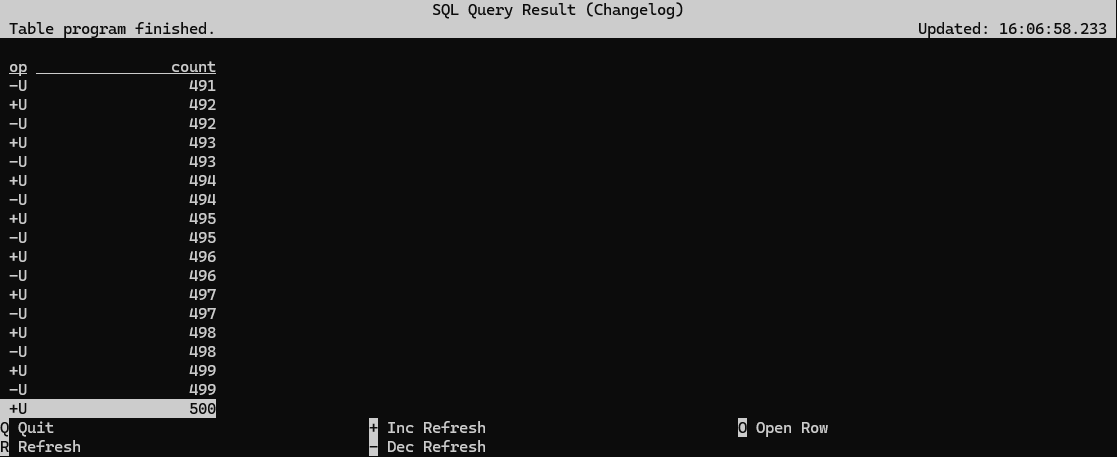
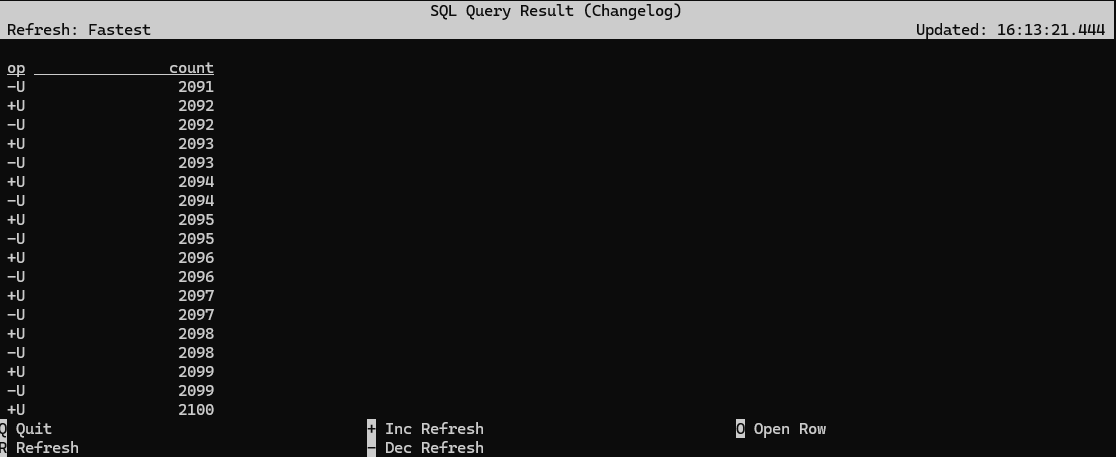
When operating in streaming mode, the Flink runtime can't rely on the stream to ever end, so it is instead continuously updating the result as it processes the input stream. It ultimately arrives at the same result as when running in batch mode, but the sink for this streaming counting job is seeing all of the incremental work done along the way by the SQL runtime.
Flink SQL> CREATE TABLE streaming_pageviews (
>     url STRING,
>     ts  TIMESTAMP(3)
> )
> WITH (
>     'connector' = 'datagen',
>     'rows-per-second' = '100'
> );
Flink SQL> SELECT COUNT(*) AS `count` FROM streaming_pageviews;
Flink SQL> SET 'sql-client.execution.result-mode' = 'table';
Flink SQL> ALTER TABLE streaming_pageviews SET ('rows-per-second' = '10');
Flink SQL> CREATE TABLE pageviews (
>     url STRING,
>     ts  TIMESTAMP(3)
> )
> WITH (
>     'connector' = 'datagen',
>     'rows-per-second' = '10'
> );
Flink SQL> SELECT COUNT(*) FROM pageviews;
Flink SQL> ALTER TABLE pageviews SET ('rows-per-second' = '100');
[INFO] Execute statement succeeded.

Flink SQL> SELECT COUNT(*) FROM pageviews;
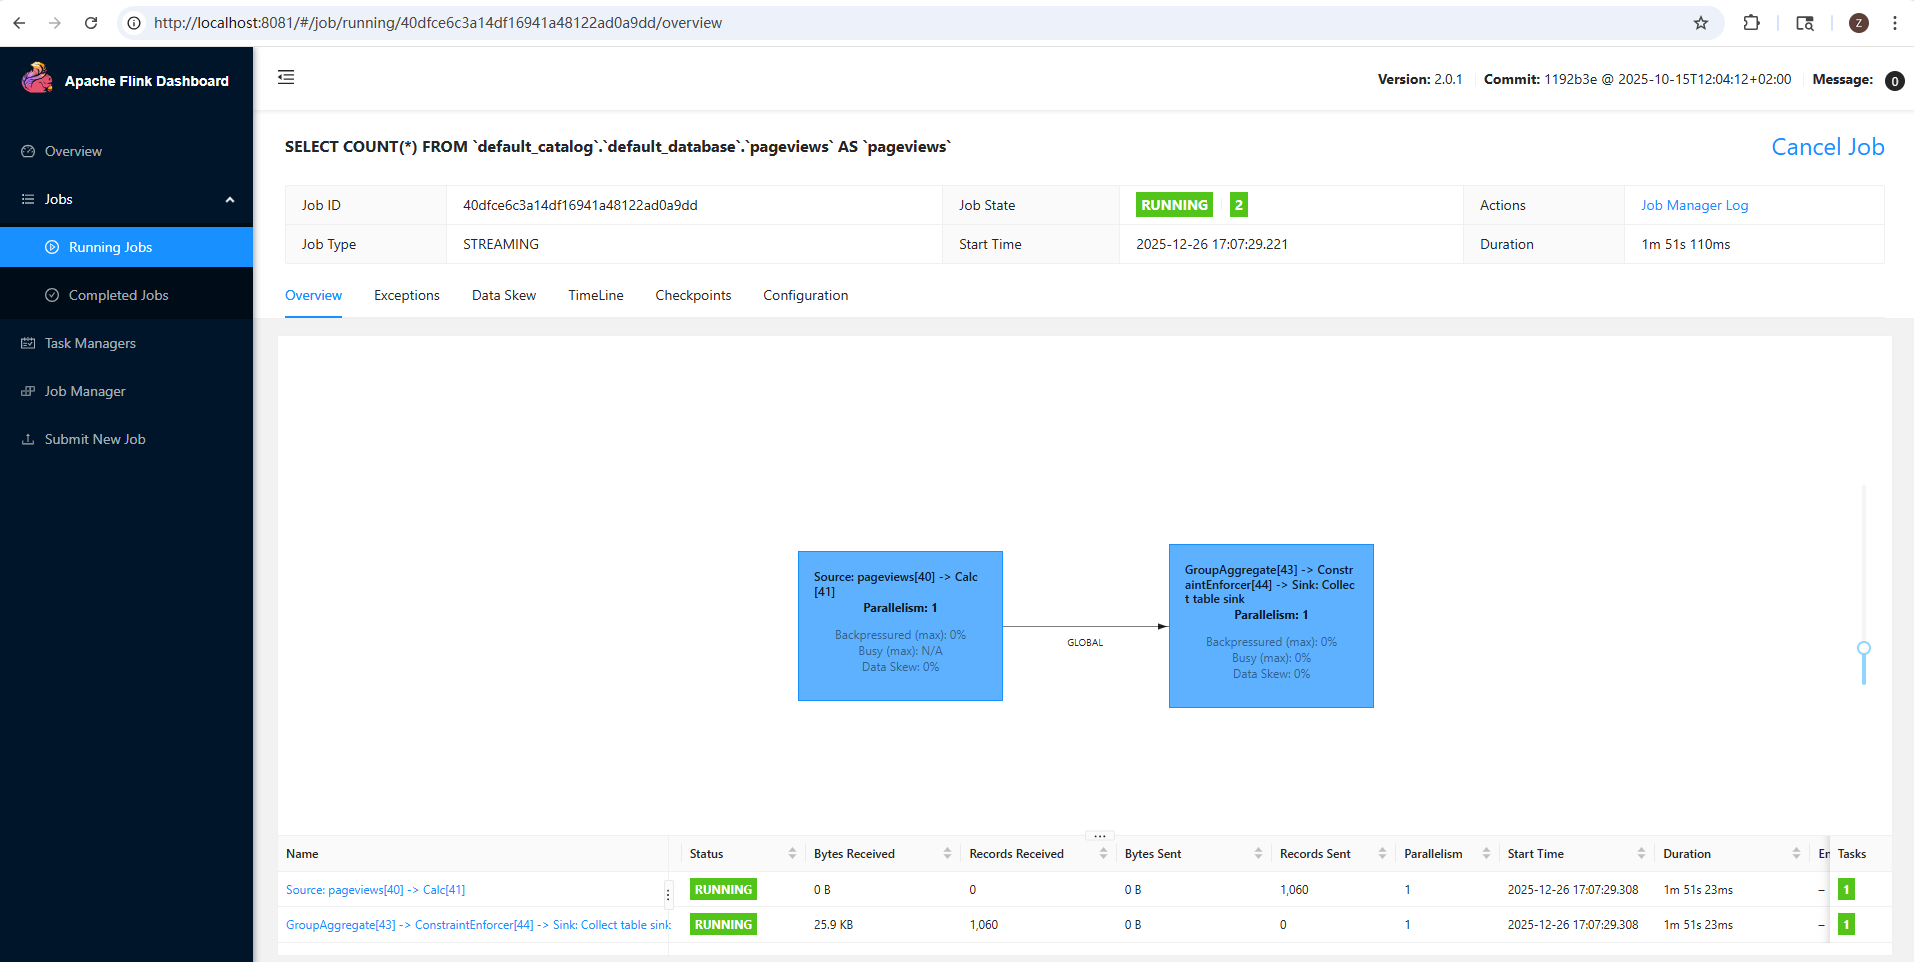
This job graph shows a processing pipeline with two stages, called tasks. Each task in a Flink job consists of one or more operators that are directly connected, or chained together, and in each parallel instance (or subtask), those chained operators run in the same thread.
For example, the task shown on the right side of this job graph is an operator chain consisting of three operators: a GroupAggregate, a ConstraintEnforcer, and a Sink.
The Web UI displays a few task-level metrics for each task: backpressure, busyness, and data skew.
Within each subtask, backpressure is reported as the percentage of time that the subtask was unable to send output downstream because the downstream subtask had fallen behind, and (temporarily) couldn't receive any more records. At the task level, what's reported is "backpressured (max)", which is the maximum backpressure across all of the parallel subtasks for the reporting period.
The busy metric reported by each subtask is the percentage of time spent doing useful work (as opposed to being either idle or backpressured). Once again, busyness is aggregated at the task level as the maximum across all of the parallel subtasks. In the example above the source task at the left is shown in red because it is busy 100% of the time. The reason for this has to do with how flink-faker is implemented. In general, tasks that are always busy are a concern, but here's it okay.
Data skew measures the degree of variation in the number of records processed per second by each of the parallel subtasks. This will be 0% if all of the subtasks handled precisely the same number of records during the reporting interval; 100% indicates maximum skew. See FLIP-418 for the details of how data skew is calculated.
The reason these task-level metrics are based on the worst-case values across all of the subtasks is that it only takes one overwhelmed instance to significantly degrade the performance of the entire cluster.
In the table below the job graph you will see some I/O metrics for each of the tasks. Note that these metrics only report internal network communication happening within Flink -- the source task will not report on traffic from an external service into Flink, nor will a sink report on communication from Flink to the outside world.
You can click on either of the rows in the table, or either of the two colored boxes in the job graph, to drill into and inspect each task in the job graph. Per-subtask metrics, and historic values, are available here.
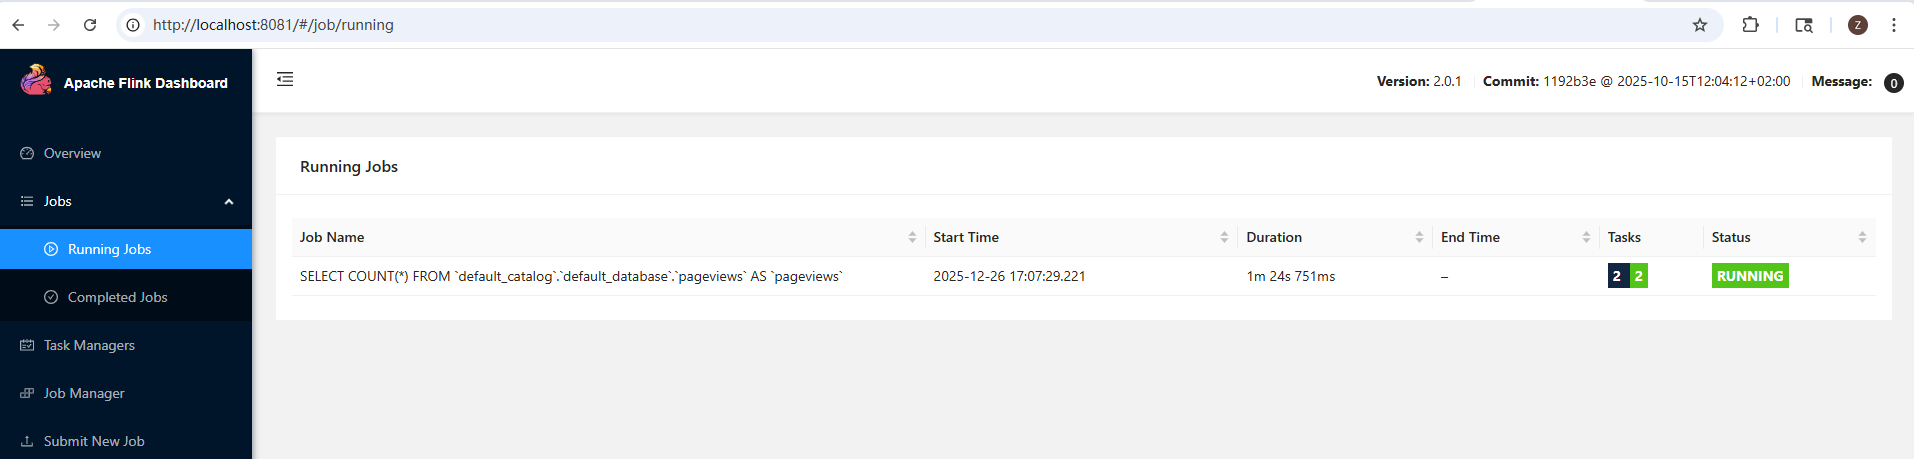
If you now stop the query (in the SQL Client), you'll see that this job is canceled. You can click on Overview in the sidebar of the Web UI to return to the top-level view that shows both running and completed jobs.
If you return now to the SQL Client, and enter EXPLAIN SELECT COUNT(*) FROM pageviews;, you'll see output that contains the execution plan for this query:
Flink SQL> EXPLAIN SELECT COUNT(*) FROM pageviews;
+-------------------------------------------------------------------------------------------------------------------------------------------------------------------------------------------------------------------------------------------------------------------------------------------------------------------------------------------------------------------------------------------------------------------------------------------------------------------------------------------------------------------------------------------------------------------------------------------------------------------------------------------------------------------------------------+
|                                                                                                                                                                                                                                                                                                                                                                                                                                                                                                                                                                                                                                                                              result |
+-------------------------------------------------------------------------------------------------------------------------------------------------------------------------------------------------------------------------------------------------------------------------------------------------------------------------------------------------------------------------------------------------------------------------------------------------------------------------------------------------------------------------------------------------------------------------------------------------------------------------------------------------------------------------------------+
| == Abstract Syntax Tree ==
LogicalAggregate(group=[{}], EXPR$0=[COUNT()])
+- LogicalProject($f0=[0])
   +- LogicalTableScan(table=[[default_catalog, default_database, pageviews]])

== Optimized Physical Plan ==
GroupAggregate(select=[COUNT(*) AS EXPR$0])
+- Exchange(distribution=[single])
   +- Calc(select=[0 AS $f0])
      +- TableSourceScan(table=[[default_catalog, default_database, pageviews]], fields=[url, ts])

== Optimized Execution Plan ==
GroupAggregate(select=[COUNT(*) AS EXPR$0])
+- Exchange(distribution=[single])
   +- Calc(select=[0 AS $f0])
      +- TableSourceScan(table=[[default_catalog, default_database, pageviews]], fields=[url, ts])
 |
+-------------------------------------------------------------------------------------------------------------------------------------------------------------------------------------------------------------------------------------------------------------------------------------------------------------------------------------------------------------------------------------------------------------------------------------------------------------------------------------------------------------------------------------------------------------------------------------------------------------------------------------------------------------------------------------+
1 row in set
Flink SQL> CREATE TABLE json_table (
>     key STRING,
>     value STRING
> ) WITH (
>     'connector' = 'kafka',
>     'topic' = 'append',
>     'properties.bootstrap.servers' = 'localhost:9092',
>     'format' = 'json',
>     'scan.startup.mode' = 'earliest-offset'
> );
[ERROR] Could not execute SQL statement. Reason:
org.apache.flink.sql.parser.impl.ParseException: Encountered "value" at line 3, column 5.
Was expecting one of:
    "CONSTRAINT" ...
    "PRIMARY" ...
    "UNIQUE" ...
    "WATERMARK" ...
    <BRACKET_QUOTED_IDENTIFIER> ...
    <QUOTED_IDENTIFIER> ...
    <BACK_QUOTED_IDENTIFIER> ...
    <BIG_QUERY_BACK_QUOTED_IDENTIFIER> ...
    <HYPHENATED_IDENTIFIER> ...
    <IDENTIFIER> ...
    <UNICODE_QUOTED_IDENTIFIER> ...

Flink SQL> CREATE TABLE json_table (
>     `key` STRING,
>     `value` STRING
> ) WITH (
>     'connector' = 'kafka',
>     'topic' = 'append',
>     'properties.bootstrap.servers' = 'localhost:9092',
>     'format' = 'json',
>     'scan.startup.mode' = 'earliest-offset'
> );
[INFO] Execute statement succeeded.
frank@ZZHPC:~$ sudo apt install kafkacat
frank@ZZHPC:~$ kcat -b localhost:9092 -L
Metadata for all topics (from broker 1: localhost:9092/1):
 1 brokers:
  broker 1 at localhost:9092 (controller)
 5 topics:
  topic "_dek_registry_keys" with 1 partitions:
    partition 0, leader 1, replicas: 1, isrs: 1
  topic "_schema_encoders" with 1 partitions:
    partition 0, leader 1, replicas: 1, isrs: 1
  topic "_schemas" with 1 partitions:
    partition 0, leader 1, replicas: 1, isrs: 1
  topic "orders" with 3 partitions:
    partition 0, leader 1, replicas: 1, isrs: 1
    partition 1, leader 1, replicas: 1, isrs: 1
    partition 2, leader 1, replicas: 1, isrs: 1
  topic "__consumer_offsets" with 50 partitions:
    partition 0, leader 1, replicas: 1, isrs: 1
    partition 1, leader 1, replicas: 1, isrs: 1
    partition 2, leader 1, replicas: 1, isrs: 1
    partition 3, leader 1, replicas: 1, isrs: 1
    partition 4, leader 1, replicas: 1, isrs: 1
    partition 5, leader 1, replicas: 1, isrs: 1
    partition 6, leader 1, replicas: 1, isrs: 1
    partition 7, leader 1, replicas: 1, isrs: 1
    partition 8, leader 1, replicas: 1, isrs: 1
    partition 9, leader 1, replicas: 1, isrs: 1
    partition 10, leader 1, replicas: 1, isrs: 1
    partition 11, leader 1, replicas: 1, isrs: 1
    partition 12, leader 1, replicas: 1, isrs: 1
    partition 13, leader 1, replicas: 1, isrs: 1
    partition 14, leader 1, replicas: 1, isrs: 1
    partition 15, leader 1, replicas: 1, isrs: 1
    partition 16, leader 1, replicas: 1, isrs: 1
    partition 17, leader 1, replicas: 1, isrs: 1
    partition 18, leader 1, replicas: 1, isrs: 1
    partition 19, leader 1, replicas: 1, isrs: 1
    partition 20, leader 1, replicas: 1, isrs: 1
    partition 21, leader 1, replicas: 1, isrs: 1
    partition 22, leader 1, replicas: 1, isrs: 1
    partition 23, leader 1, replicas: 1, isrs: 1
    partition 24, leader 1, replicas: 1, isrs: 1
    partition 25, leader 1, replicas: 1, isrs: 1
    partition 26, leader 1, replicas: 1, isrs: 1
    partition 27, leader 1, replicas: 1, isrs: 1
    partition 28, leader 1, replicas: 1, isrs: 1
    partition 29, leader 1, replicas: 1, isrs: 1
    partition 30, leader 1, replicas: 1, isrs: 1
    partition 31, leader 1, replicas: 1, isrs: 1
    partition 32, leader 1, replicas: 1, isrs: 1
    partition 33, leader 1, replicas: 1, isrs: 1
    partition 34, leader 1, replicas: 1, isrs: 1
    partition 35, leader 1, replicas: 1, isrs: 1
    partition 36, leader 1, replicas: 1, isrs: 1
    partition 37, leader 1, replicas: 1, isrs: 1
    partition 38, leader 1, replicas: 1, isrs: 1
    partition 39, leader 1, replicas: 1, isrs: 1
    partition 40, leader 1, replicas: 1, isrs: 1
    partition 41, leader 1, replicas: 1, isrs: 1
    partition 42, leader 1, replicas: 1, isrs: 1
    partition 43, leader 1, replicas: 1, isrs: 1
    partition 44, leader 1, replicas: 1, isrs: 1
    partition 45, leader 1, replicas: 1, isrs: 1
    partition 46, leader 1, replicas: 1, isrs: 1
    partition 47, leader 1, replicas: 1, isrs: 1
    partition 48, leader 1, replicas: 1, isrs: 1
    partition 49, leader 1, replicas: 1, isrs: 1
At this point, the topic won't have been created. But once you write into it, the topic will be created because the broker is configured with auto.create.topics.enable set to default value, which is true.
Flink SQL> INSERT INTO json_table VALUES ('foo', 'one'), ('foo', 'two');
[INFO] Submitting SQL update statement to the cluster...
[INFO] SQL update statement has been successfully submitted to the cluster:
Job ID: dfcb70b0a3058ef44d973f8c41db4a13
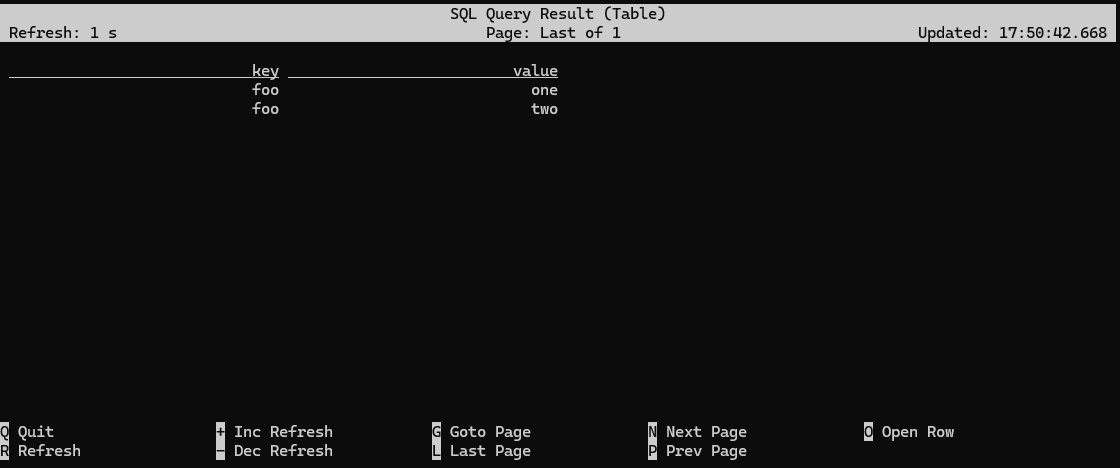
Flink SQL> SELECT * FROM json_table;
frank@ZZHPC:~$ kcat -b localhost:9092 -C -t append -f '\n
> \tKey (%K bytes): %k
> \tValue (%S bytes): %s
> \tPartition: %p
> \tOffset: %o
> \tTimestamp: %T
> \tHeaders: %h
> --\n'


        Key (-1 bytes):
        Value (27 bytes): {"key":"foo","value":"one"}
        Partition: 0
        Offset: 0
        Timestamp: 1766742536442
        Headers:
--


        Key (-1 bytes):
        Value (27 bytes): {"key":"foo","value":"two"}
        Partition: 0
        Offset: 1
        Timestamp: 1766742536451
        Headers:
--
% Reached end of topic append [0] at offset 2
To really drive the point home -- namely, that tables are independent of the underlying storage -- back in the Flink SQL CLI let's create another table mapped onto the same topic:
Flink SQL> SELECT * FROM json_table;
[INFO] Result retrieval cancelled.

Flink SQL> CREATE TABLE raw_table (
>     `data` STRING
> ) WITH (
>     'connector' = 'kafka',
>     'topic' = 'append',
>     'properties.bootstrap.servers' = 'localhost:9092',
>     'format' = 'raw',
>     'scan.startup.mode' = 'earliest-offset'
> );
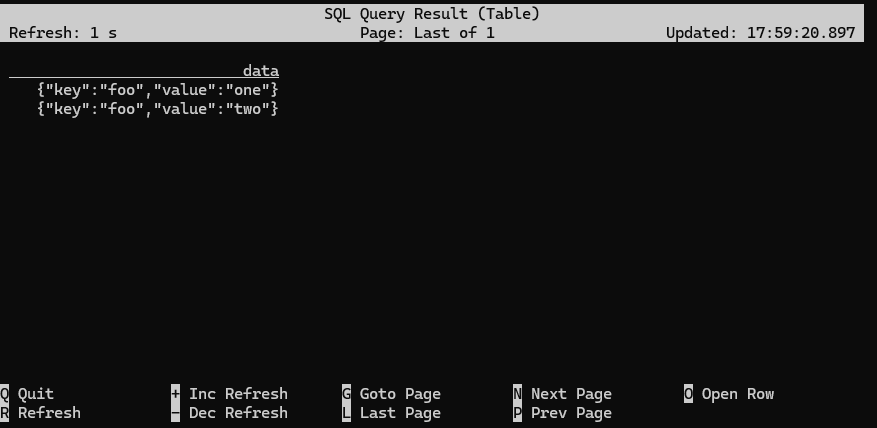
This new table interprets the data stored in the append topic differently (note that the format specification has been changed from json to raw). To see this in action, inspect the new table, and compare the results to what you saw before:
Flink SQL> SELECT * FROM raw_table;
Append vs. update streams, and the two Kafka connectors
Flink SQL is designed around the idea of processing changelog streams.
The simplest form of changelog stream is an insert-only, or append stream, where each new message is a new record being appended at the end of the stream -- or if described using database terminology, each new message is a new row being inserted into a table.
The SQL CLI can be configured to show this underlying changelog information:
Flink SQL> SET 'sql-client.execution.result-mode' = 'tableau';
Flink SQL> SELECT * FROM json_table;
+----+--------------------------------+--------------------------------+
| op |                            key |                          value |
+----+--------------------------------+--------------------------------+
| +I |                            foo |                            one |
| +I |                            foo |                            two |
(cursor blinking)
Sometimes, operating in this append-only mode is too limiting, and it makes sense to be able to interpret incoming records as updating (or deleting) existing records. Confluent Cloud handles this differently, but with open source Apache Flink, the kafka connector interprets the topic as an append-only stream, and the upsert-kafka connector interprets the topic as an updating stream -- where the updates are done based on the table's primary key.
It's time for another experiment:
Flink SQL> CREATE TABLE updating_table (
>     `key` STRING PRIMARY KEY NOT ENFORCED,
>     `value` STRING
> ) WITH (
>     'connector' = 'upsert-kafka',
>     'topic' = 'update',
>     'properties.bootstrap.servers' = 'localhost:9092',
>     'key.format' = 'json',
>     'value.format' = 'json'
> );
Flink SQL> INSERT INTO updating_table VALUES ('foo', 'one'), ('foo', 'two');
[INFO] Submitting SQL update statement to the cluster...
[INFO] SQL update statement has been successfully submitted to the cluster:
Job ID: cda8b9ff7b3c6ca82ee901610755bff0


Flink SQL> SELECT * FROM updating_table;
+----+--------------------------------+--------------------------------+
| op |                            key |                          value |
+----+--------------------------------+--------------------------------+
| +I |                            foo |                            one |
| -U |                            foo |                            one |
| +U |                            foo |                            two |
(cursor blinking)
Flink SQL> SHOW TABLES;
Empty set

Flink SQL> CREATE TABLE pageviews (
>     `url` STRING,
>     `browser` STRING,
>     `ts` TIMESTAMP(3)
> ) WITH (
>     'connector' = 'datagen',
>     'rows-per-second' = '10'
> );
[INFO] Execute statement succeeded.

Flink SQL> SHOW TABLES;
+------------+
| table name |
+------------+
|  pageviews |
+------------+
1 row in set
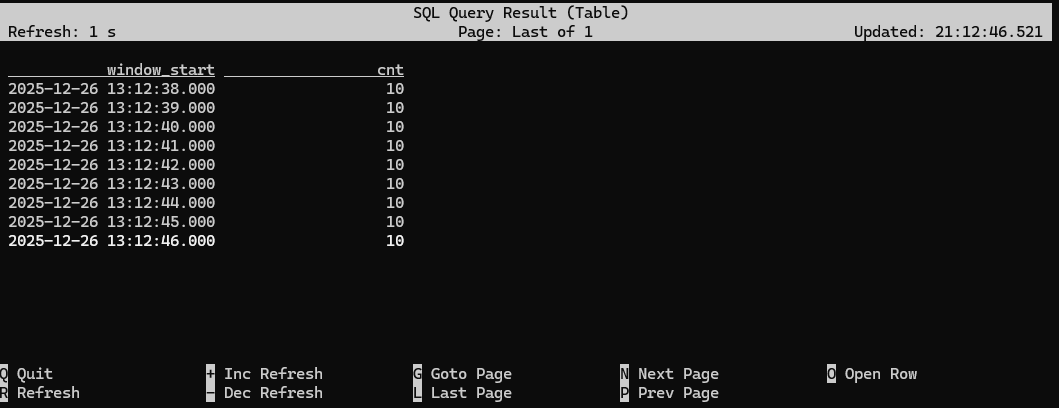
A naive approach to windowing with Flink SQL
Below is an initial, naive attempt to implement windowing. What this query is doing is rounding the timestamp in each page view down to the nearest second, and then counting how many page views occured in each second.
Flink SQL> SELECT floor(ts TO SECOND) AS window_start, COUNT(1) AS cnt
>            FROM pageviews
>           GROUP BY window_start;
[ERROR] Could not execute SQL statement. Reason:
org.apache.calcite.sql.validate.SqlValidatorException: Column 'window_start' not found in any table

Flink SQL> SELECT floor(ts TO SECOND) AS window_start, COUNT(1) AS cnt
>            FROM pageviews
>           GROUP BY floor(ts TO SECOND);
Flink SQL> SELECT browser, COUNT(1) AS cnt
>            FROM pageviews
>           GROUP BY browser;
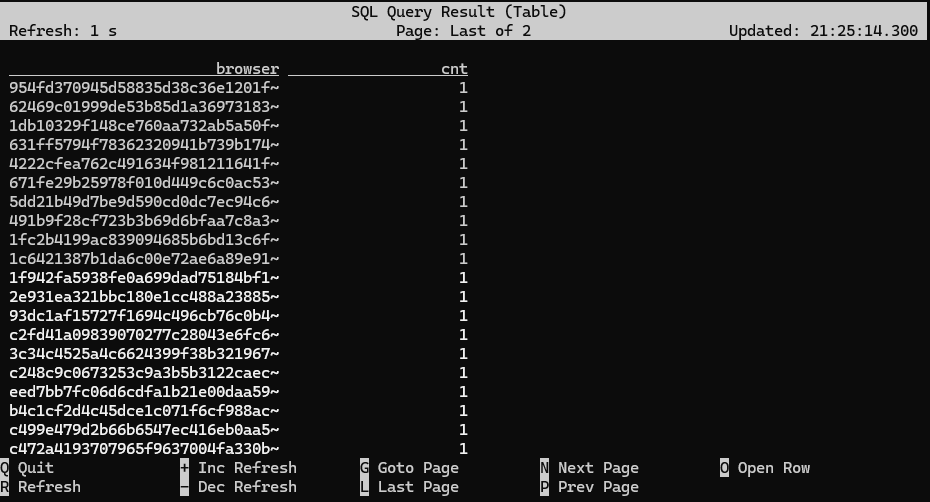
Both of these queries are materializing queries, meaning they keep their state indefinitely. The query counting page views per browser is perfectly safe, since there are only a small, finite number of different browsers, but the query counting page views per second is more dangerous, because there's a unbounded supply of seconds in the future.
A better approach to windowing using time attributes and table-valued functions
What Flink SQL needs in order to safely implement windowing (i.e., windows that will be cleaned up once they're no longer changing) is
- an input table that is append-only (which we have), and
- a designated timestamp column with timestamps that are known to be advancing (which we don't have (yet))
Flink SQL calls a timestamp column like this a time attribute, and time attributes come in two flavors: processing time (also known as wall clock time) and event time. For our use case, where we're counting page views per second, the distinction is this:
- When windowing with processing time, a page view is counted based on the second during which it is processed, rather than when it occurred.
- When windowing with event time, a page view is counted based on when it occured, rather than when it is processed.
When using a time attribute column based on processing time, it's obvious that time will be advancing.
On the other hand, working with event time is trickier: just because a table has a timestamp column doesn't necessarily imply that those timestamps are advancing. For example, our pageviews table could have a created_at column indicating when the page was created. The order in which pages are created has little (if anything) to do with the order in which they are viewed.
To deal with this, Flink relies something called watermarks to measure the progress of event time, and you'll learn how to work with event-time windows and watermarks in a later exercise.
In general, the use of event time is to be preferred, but for this exercise, you'll experiment with windows that use processing time. (A later exercise dives into watermarking and event time windowing.) Processing time windowing requires adding a timestamp column that is tied to the system's time-of-day clock. This processing-time-based timestamp column is an example of a computed column, meaning a column whose value is computed, rather than being physically present in the event stream. In this case we want to use the built-in PROCTIME() function. You can add such a column to the pageviews table like this:
Flink SQL> ALTER TABLE pageviews ADD `proc_time` AS PROCTIME();
If you now use DESCRIBE pageviews; to inspect this table you will see that Flink SQL has understood that this new column is going to be used as a processing time time attribute:
Flink SQL> DESCRIBE pageviews;
+-----------+-----------------------------+-------+-----+-----------------+-----------+
|      name |                        type |  null | key |          extras | watermark |
+-----------+-----------------------------+-------+-----+-----------------+-----------+
|       url |                      STRING |  TRUE |     |                 |           |
|   browser |                      STRING |  TRUE |     |                 |           |
|        ts |                TIMESTAMP(3) |  TRUE |     |                 |           |
| proc_time | TIMESTAMP_LTZ(3) *PROCTIME* | FALSE |     | AS `PROCTIME`() |           |
+-----------+-----------------------------+-------+-----+-----------------+-----------+
4 rows in set
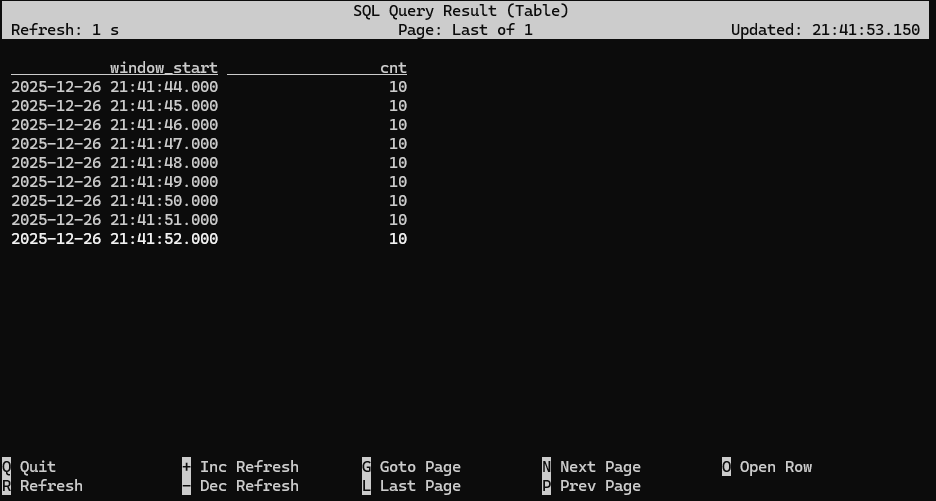
Flink SQL includes special operations for windowing, which we can now take advantage of. This requires setting up the query in a particular way, using one of the built-in window functions, such as TUMBLE:
Flink SQL> SELECT window_start, COUNT(1) AS cnt
>            FROM TABLE(
>                     TUMBLE(
>                         DATA => TABLE pageviews,
>                         TIMECOL => DESCRIPTOR(proc_time),
>                         SIZE => INTERVAL '1' SECOND
>                     )
>                 )
>           GROUP BY window_start, window_end;
The built-in TUMBLE function used in this query is an example of a table-valued function (TVF). This function takes three parameters
- a table descriptor (TABLE pageviews)
- a column descriptor for the time attribute (DESCRIPTOR(proc_time))
- a time interval to use for windowing (one second)
and it returns a new table based on the input table, but with two additional columns added to aid with windowing. To see how this works, examine the output of TUMBLE on its own:
Flink SQL> SELECT *
>            FROM TABLE(
>                     TUMBLE(TABLE pageviews, DESCRIPTOR(proc_time), INTERVAL '1' SECOND)
>                 );
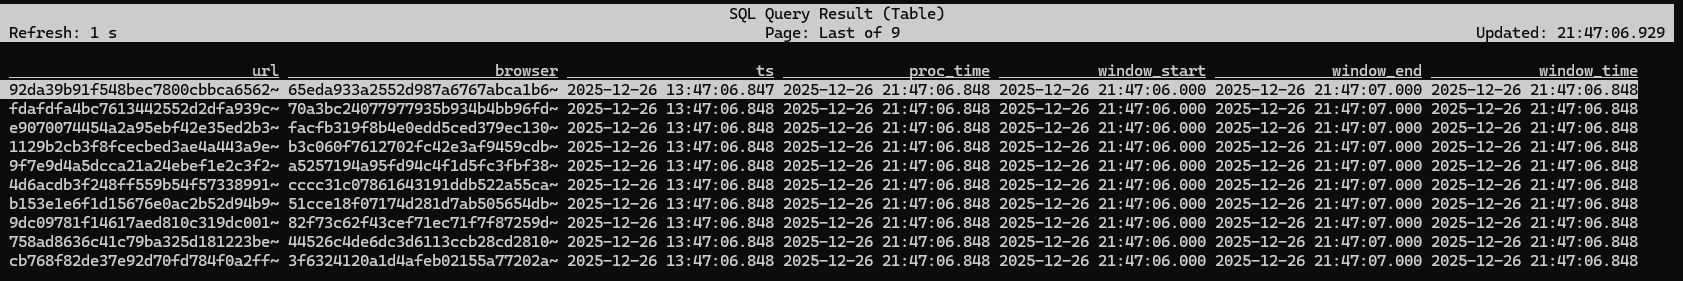
What you're seeing is that the table returned by the TUMBLE function has window_start and window_end columns indicating which one-second-long window each pageview event has been assigned to.
GROUP BY window_start, window_end aggregates together all of the pageview events assigned to each window, making it easy to compute any type of aggregation function on these windows, such as counting.
One more thing
Another important difference between the naive windowing based on FLOOR and the more sophisticated approach using window functions is that the naive approach produces a continously updating stream as its output, while the function-based approach produces an append-only stream, where each window produces a single, final result.
The importance of this distinction is discussed at length in a Flink SQL course module on Changelog Processing, but in short, tables based on append-only streams are more versatile in how they can be processed.
[Optional] HOP, CUMULATE, and SESSION windows
In addition to tumbling windows, Flink SQL also supports hopping, cumulating, and session windows with the HOP, CUMULATE, and SESSIONS window functions. The Flink SQL course includes a video covering this topic more deeply.
The HOP and CUMULATE functions are worth experimenting with because they don't just add new columns to the input table, but they can also add additional rows. Seeing how this works will help you appreciate the elegance of this table-valued function approach to windowing.


 浙公网安备 33010602011771号