

The Silhouette Score is a metric used to evaluate the quality of a clustering result. It measures how well each data point fits within its assigned cluster compared to other clusters.
🔍 What does the Silhouette Score tell you?
For each data point, the silhouette value combines two ideas:
-
Cohesion (a)
-
How close the point is to other points in its own cluster.
-
Lower distance = better cohesion.
-
-
Separation (b)
-
How far the point is from points in the nearest other cluster.
-
Higher distance = better separation.
-
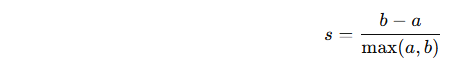
The silhouette value for a point is:
📏 Range of the Silhouette Score
-
+1 → Excellent clustering
(Well-separated clusters; point is far from other clusters) -
0 → Overlapping clusters
(Point is on or near the decision boundary) -
–1 → Incorrect clustering
(Point is closer to another cluster than its own)
🧪 When is it used?
-
To evaluate clustering algorithms like:
-
K-Means
-
Hierarchical clustering
-
DBSCAN (if labels are well-formed)
-
-
To choose the optimal number of clusters k.
📊 Example (with intuition)
If you change the number of clusters in K-Means and compute the silhouette score for each value, the k with the highest average silhouette score is often the best choice.
🧠 Summary
The Silhouette Score measures:
How similar an object is to its own cluster compared to other clusters.
It’s a simple yet powerful tool for validating clustering results.


 浙公网安备 33010602011771号