
The Chi-square test (also written as χ² test) is a statistical hypothesis test used to determine whether there is a significant association between two categorical variables. It compares the observed frequencies in a contingency table to the expected frequencies that would occur if the variables were independent.
🧪 Types of Chi-Square Tests
-
Chi-square test of independence
➤ Tests whether two categorical variables are independent.
(Most commonly used in contingency tables.) -
Chi-square goodness-of-fit test
➤ Tests whether an observed frequency distribution matches an expected distribution.
📊 Example (Chi-square test of independence)
Suppose you want to know whether gender and voting preference are related:
| Voted A | Voted B | Total | |
|---|---|---|---|
| Male | 30 | 20 | 50 |
| Female | 10 | 40 | 50 |
| Total | 40 | 60 | 100 |
We want to test if voting preference is independent of gender.
🧮 Chi-square Test Formula
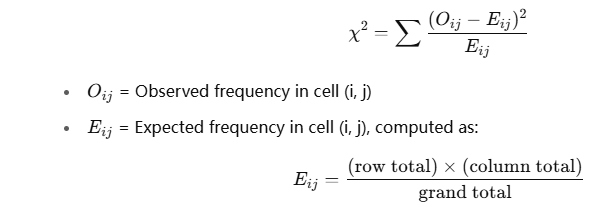
import numpy as np
from scipy.stats import chi2_contingency

# Contingency table
table = np.array([[30, 20],
                  [10, 40]])

# Perform chi-square test of independence
chi2, p, dof, expected = chi2_contingency(table)

print("Chi-square statistic:", chi2)
print("Degrees of freedom:", dof)
print("Expected frequencies:\n", expected)
print("P-value:", p)
Chi-square statistic: 15.041666666666668
Degrees of freedom: 1
Expected frequencies:
 [[20. 30.]
 [20. 30.]]
P-value: 0.00010516355403363114
📌 Output (interpreted)
-
Chi-square statistic: How different the observed frequencies are from expected ones.
-
Degrees of freedom: ({#rows} - 1) * ({#cols} - 1)
-
P-value: Probability of observing such a difference if the variables were truly independent.
✅ Interpretation
-
If p-value < 0.05 → Reject the null hypothesis → Variables are likely associated
-
If p-value ≥ 0.05 → Do not reject the null → No significant association


 浙公网安备 33010602011771号