
# Apply transform function to Numbers column
df_transformed = (
    df.select("category",
              "overallMotivation",
              "year",
              "laureates",
              transform(col("laureates"), lambda x: concat(x.firstname, lit(" "), x.surname))
              .alias("laureates_full_name")))
df_deduped = df.dropDuplicates(["category", "overallMotivation", "year"])
df_sorted = df.orderBy("year")
df_sorted = df.orderBy(["year", "category"], ascending=[False, True])
df_sorted = df.sort(["year", "category"], ascending=[False, True])
df_renamed = df.withColumnRenamed("category", "Topic")
df_renamed = (df.selectExpr("category as Topic", "year as Year", "overallMotivation as Motivation"))
Filtering data
filtered_df = df.filter(col("release_year") > 2020)
filtered_df = (df.filter((col("country") == "United States") & (col("release_year") > 2020)))
filtered_df = (df.filter(col("country").isin(["United States", "United Kingdom", "India"])))
Filtering on string
iltered_df = df.filter(col("listed_in").like("%Crime%"))
# filter the DataFrame based on a regular expression match
filtered_df = df.filter(col("listed_in").rlike("(Crime|Thrillers)"))
Filtering on Data Ranges
filtered_df = df.filter((col("date_added") >= "2021-09-05") & (col("date_added") <= "2021-09-01"))
filtered_df = df.filter((col("date_added").between("2021-02-01", "2021-03-01")))
Filter on Arrays
filtered_df = df_recipes.filter(array_contains(col("RecipeIngredientParts"), "apple"))
Filtering on map columns
filtered_df = (df_nobel_prizes_exploded.filter(
        (col("laureates").getItem("firstname") == "Albert")
        & (col("laureates").getItem("surname") == "Einstein")))
Performing joins
customer_cards_df = (cards_df.join(customers_df, on='Cust_ID', how='inner'))
joined_transactions_df = (transactions_df.join(fraud_df, on='Transaction_ID', how='left_outer'))
joinExpr = ((customer_cards_df["Card_Number"] == joined_transactions_df["Credit_Card_ID"])
            & (joined_transactions_df["Fraud_Flag"].isNotNull()))

customer_with_fraud_df = (customer_cards_df.join(joined_transactions_df, on=joinExpr, how='inner'))
right_join = df1.join(df2, on='Name', how='right_outer')
full_join = df1.join(df2, on='Name', how='outer')
cross_join = df1.crossJoin(df2)
Broadcast join
data1 = [("Alice", "F", 25),
         ("Bob", "M", 30),
         ("Charlie", "M", 35),
         ("Dave", "M", 40)]
df1 = spark.createDataFrame(data1, ["Name", "Gender", "Age"])
df1.show()
+-------+------+---+
|   Name|Gender|Age|
+-------+------+---+
|  Alice|     F| 25|
|    Bob|     M| 30|
|Charlie|     M| 35|
|   Dave|     M| 40|
+-------+------+---+
data2 = [("Charlie", "M"),
         ("Dave", "M"),
         ("Eve", "F")]
df2 = spark.createDataFrame(data2, ["Name", "Gender"])
df2.show()
+-------+------+
|   Name|Gender|
+-------+------+
|Charlie|     M|
|   Dave|     M|
|    Eve|     F|
+-------+------+
broadcast_join = df1.join(broadcast(df2), ["Name", "Gender"], "inner")
broadcast_join.show()
+-------+------+---+
|   Name|Gender|Age|
+-------+------+---+
|Charlie|     M| 35|
|   Dave|     M| 40|
+-------+------+---+
You typically use a broadcast join when you have one small dataset and one large dataset, and the small dataset is small enough to be broadcasted to all the worker nodes without causing memory issues.
Multiple Join Conditions
multi_join = df1.join(df2, on=['Name', 'Gender'], how='inner')
multi_join.show()
+-------+------+---+
|   Name|Gender|Age|
+-------+------+---+
|Charlie|     M| 35|
|   Dave|     M| 40|
+-------+------+---+
Performing aggregations
grouped_df = df.groupBy("country")

count_df = grouped_df.count()

max_release_df = grouped_df.agg(max(col("date_added")))

release_date_gouped_df = (
    df.groupBy("country")
    .agg(count("show_id").alias("NumberOfReleases"),
         max("date_added").alias("LastReleaseDate"),
         min("date_added").alias("FirstReleaseDate")))
Pivot Tables
pivot_table = (df.groupBy("country").pivot("type").agg(count("show_id")))
pivot_table.show()
+--------------------+-----+-------+
|             country|Movie|TV Show|
+--------------------+-----+-------+
|Peru, United Stat...|    1|   null|
|United Kingdom, C...| null|      1|
|India, United Kin...|    1|   null|
|      India, Germany|    2|   null|
|Japan, Canada, Un...| null|      1|
|South Africa, Uni...|    1|   null|
|              Russia|    1|     14|
|United Kingdom, G...| null|      1|
|Chile, United Sta...|    1|   null|
|  Philippines, Qatar|    1|   null|
|United States, Fr...| null|      1|
|Hong Kong, China,...|    1|   null|
|Denmark, France, ...|    1|   null|
|South Africa, Angola|    1|   null|
|United States, Po...| null|      1|
|  Germany, Sri Lanka|    1|   null|
|United Kingdom, N...|    2|   null|
|Australia, United...|    2|   null|
|United States, Ir...|    2|      1|
|Brazil, France, G...|    1|   null|
+--------------------+-----+-------+
only showing top 20 rows
Approximate Aggregations
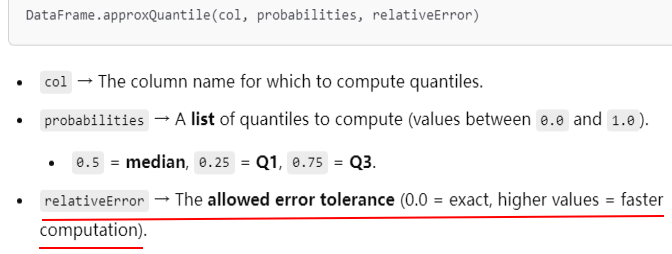
# Approximate quantile calculation
quantiles = review_df.approxQuantile("Score", [0.25, 0.5, 0.75], 0.1)
print("Approximate Quantiles:", quantiles)

# Approximate Quantiles: [4.0, 5.0, 5.0]
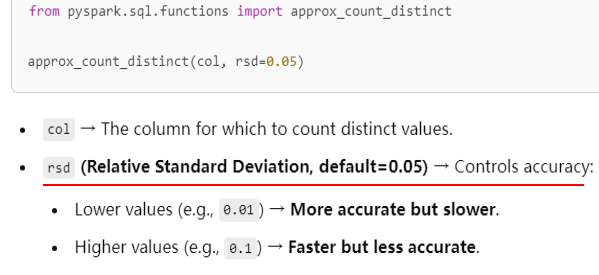
# Approximate distinct count calculation
approx_distinct_count = review_df.select(approx_count_distinct("ProductId", rsd=0.1).alias("approx_distinct_count"))
approx_distinct_count.show()
+---------------------+
|approx_distinct_count|
+---------------------+
|                 3780|
+---------------------+
Using window functions
from pyspark.sql.window import Window

window_spec = Window.partitionBy("country").orderBy("date_added")
# Assign row numbers within each partition
result = df.withColumn("row_number", row_number().over(window_spec))
# Add lead column
df = df.withColumn("lead_date_added", lead("date_added").over(window_spec))
# Add lag column
df = df.withColumn("lag_date_added", lag("date_added").over(window_spec))
Nested Window Functions
from pyspark.sql.functions import sum, lead
from pyspark.sql.window import Window

window_spec = Window.partitionBy("country").orderBy("release_year")
df = df.withColumn("running_total", count("show_id").over(window_spec))
df = df.withColumn("next_running_total", lead("running_total").over(window_spec))
df = df.withColumn("diff", df["next_running_total"] - df["running_total"])
Window Frames
data = [(1, 10),
        (2, 15),
        (3, 20),
        (4, 25),
        (5, 30)]
df = spark.createDataFrame(data, ["id", "value"])

windowSpec = Window.orderBy("id").rowsBetween(-2, 0)
df = df.withColumn("rolling_avg", avg(df["value"]).over(windowSpec))

df.show()
Writing custom UDFs
def concat(first_name, last_name):
    return first_name + " " + last_name

from pyspark.sql.functions import udf
concat_udf = udf(concat)


from pyspark.sql.types import StringType
concat_udf = udf(concat, StringType())

df_flattened = df_flattened.withColumn("full_name", concat_udf(df_flattened["firstname"], df_flattened["surname"]))
Using UDFs in Spark SQL
from pyspark.sql.types import IntegerType

# Define a UDF
def square_udf(x):
    return x ** 2

# Register the UDF
spark.udf.register("square", square_udf, IntegerType())

# Create a DataFrame
df = spark.createDataFrame([(1,), (2,), (3,), (4,), (5,)], ["num"])

# Use the registered UDF in a SQL query
df.createOrReplaceTempView("numbers")
result = spark.sql("SELECT num, square(num) AS square_num FROM numbers")

# Show the result
result.show()
+---+----------+
|num|square_num|
+---+----------+
|  1|         1|
|  2|         4|
|  3|         9|
|  4|        16|
|  5|        25|
+---+----------+
Handling null values
df = (spark.read.format("json")
      .option("multiLine", "true")
      .load("../data/nobel_prizes.json"))

df_flattened = (
    df.withColumn("laureates", explode(col("laureates")))
      .select(col("category"),
              col("year"),
              col("overallMotivation"),
              col("laureates.id"),
              col("laureates.firstname"),
              col("laureates.surname"),
              col("laureates.share"),
              col("laureates.motivation")))

# Dropping rows with null values
df_dropna = df_flattened.dropna()
# Filling null values with a specific value
df_fillna = df_flattened.fillna("N/A")
# Replacing null values based on conditions
df_replace = (df_flattened
                .withColumn("category", when(col("category").isNull(), "").otherwise(col("category")))
                .withColumn("overallMotivation", when(col("overallMotivation").isNull(), "").otherwise(col("overallMotivation")))
                .withColumn("firstname", when(col("firstname").isNull(), "").otherwise(col("firstname")))
                .withColumn("surname", when(col("surname").isNull(), "").otherwise(col("surname")))
                .withColumn("year", when(col("year").isNull(), 9999).otherwise(col("year"))))
Handling null values in user-defined functions (UDFs)
from pyspark.sql import SparkSession
from pyspark.sql.functions import udf
from pyspark.sql.types import StringType

# Sample DataFrame with null values
data = [("John", 25), ("Alice", None), ("Bob", 30)]
df = spark.createDataFrame(data, ["name", "age"])

# Define a UDF to handle null values
def process_name(name):
    if name is None:
        return "Unknown"
    else:
        return name.upper()

# Register the UDF
process_name_udf = udf(process_name, StringType())

# Apply the UDF to the DataFrame
df_with_processed_names = df.withColumn("processed_name", process_name_udf(df["name"]))

# Show the resulting DataFrame
df_with_processed_names.show()
+-----+----+--------------+
| name| age|processed_name|
+-----+----+--------------+
| John|  25|          JOHN|
|Alice|null|         ALICE|
|  Bob|  30|           BOB|
+-----+----+--------------+
Handling null values in machine learning pipelines
from pyspark.sql import SparkSession
from pyspark.ml.feature import Imputer

# Create a sample DataFrame with missing values
data = [
    (1, 2.0),
    (2, None),
    (3, 5.0),
    (4, None),
    (5, 7.0)
]
df = spark.createDataFrame(data, ["id", "value"])

# Create an instance of Imputer and specify the input/output columns
imputer = Imputer(inputCols=["value"], outputCols=["imputed_value"])

# Fit the imputer to the data and transform the DataFrame
imputer_model = imputer.fit(df)
imputed_df = imputer_model.transform(df)

# Show the resulting DataFrame
imputed_df.show()
+---+-----+-----------------+
| id|value|    imputed_value|
+---+-----+-----------------+
|  1|  2.0|              2.0|
|  2| null|4.666666666666667|
|  3|  5.0|              5.0|
|  4| null|4.666666666666667|
|  5|  7.0|              7.0|
+---+-----+-----------------+


 浙公网安备 33010602011771号