


In routes.go:
router.Handler(http.MethodGet, "/debug/vars", expvar.Handler())
func main() {
    expvar.NewString("version").Set(version)
...


func main() {
...
    // Publish the version number.
    expvar.NewString("version").Set(version)

    // Publish the number of active goroutines.
    expvar.Publish("goroutines", expvar.Func(func() any {
        return runtime.NumGoroutine()
    }))

    // Publish the database connection pool statistics.
    expvar.Publish("database", expvar.Func(func() any {
        return poolWrapper
    }))

    // Publish the current Unix timestamp.
    expvar.Publish("timestamp", expvar.Func(func() any {
        return time.Now().Unix()
    }))

    // Create the application instance.
    app := &application{
        config:      cfg,
        logger:      logger,
        models:      data.NewModels(&poolWrapper),
        emailSender: &mail.EmailSender{SMTPCfg: cfg.smtp},
    }
...
internal/data/db.go:
package data

import (
    "context"
    "encoding/json"
    "time"

    "github.com/jackc/pgx/v5/pgxpool"
)

// PoolWrapper wraps a *pgxpool.Pool.
type PoolWrapper struct {
    Pool *pgxpool.Pool `json:"-"`
    Stat struct {
        PoolSerialNumber        int32         `json:"pool_serial_number"`      // serial number of the pool in use
        AcquireCount            int64         `json:"AcquireCount"`            // cumulative count of successful acquires from the pool
        AcquireDuration         time.Duration `json:"AcquireDuration"`         // total duration of all successful acquires from the pool
        AcquiredConns           int32         `json:"AcquiredConns"`           // number of currently acquired connections in the pool
        CanceledAcquireCount    int64         `json:"CanceledAcquireCount"`    // cumulative count of acquires from the pool that were canceled by a context
        EmptyAcquireCount       int64         `json:"EmptyAcquireCount"`       // cumulative count of successful acquires from the pool that waited for a resource to be released or constructed because the pool was empty
        IdleConns               int32         `json:"IdleConns"`               // number of currently idle conns in the pool
        MaxConns                int32         `json:"MaxConns"`                // maximum size of the pool
        TotalConns              int32         `json:"TotalConns"`              // total number of resources currently in the pool, the sum of ConstructingConns, AcquiredConns, and IdleConns
        NewConnsCount           int64         `json:"NewConnsCount"`           // cumulative count of new connections opened
        MaxLifetimeDestroyCount int64         `json:"MaxLifetimeDestroyCount"` // cumulative count of connections destroyed because they exceeded MaxConnLifetime
        MaxIdleDestroyCount     int64         `json:"MaxIdleDestroyCount"`     // cumulative count of connections destroyed because they exceeded MaxConnIdleTime
    }
}

// Implement the MarshalJSON method on PoolWrapper struct so that it satisfies the jons.Marshaler interface.
func (pw *PoolWrapper) MarshalJSON() ([]byte, error) {
    return json.Marshal(pw.Stat)
}

// CreatePool creates a *pgxpool.Pool and assigns it to the wrapper's Pool field.
func (pw *PoolWrapper) CreatePool(connString string) error {
    ctx, cancel := context.WithTimeout(context.Background(), 5*time.Second)
    defer cancel()

    p, err := pgxpool.New(ctx, connString)
    if err != nil {
        return err
    }

    err = p.Ping(ctx)
    if err != nil {
        p.Close()
        return err
    }

    pw.Pool = p
    pw.Stat.PoolSerialNumber = pw.Stat.PoolSerialNumber + 1
    pw.Stat.AcquireCount = p.Stat().AcquireCount()
    pw.Stat.AcquireDuration = p.Stat().AcquireDuration()
    pw.Stat.AcquiredConns = p.Stat().AcquiredConns()
    pw.Stat.CanceledAcquireCount = p.Stat().CanceledAcquireCount()
    pw.Stat.EmptyAcquireCount = p.Stat().EmptyAcquireCount()
    pw.Stat.IdleConns = p.Stat().IdleConns()
    pw.Stat.MaxConns = p.Stat().MaxConns()
    pw.Stat.TotalConns = p.Stat().TotalConns()
    pw.Stat.NewConnsCount = p.Stat().NewConnsCount()
    pw.Stat.MaxLifetimeDestroyCount = p.Stat().MaxLifetimeDestroyCount()
    pw.Stat.MaxIdleDestroyCount = p.Stat().MaxIdleDestroyCount()

    return nil
}
Note that the anonymous functions in the expvar.Publish statements are run only when the /debug/vars endpoint is visited.
    // Publish the number of active goroutines.
    expvar.Publish("goroutines", expvar.Func(func() any {
        return runtime.NumGoroutine()
    }))

    // Publish the database connection pool statistics.
    expvar.Publish("database", expvar.Func(func() any {
        return poolWrapper
    }))

    // Publish the current Unix timestamp.
    expvar.Publish("timestamp", expvar.Func(func() any {
        return time.Now().Unix()
    }))
func (app *application) metrics(next http.Handler) http.Handler {
    var (
        totalRequestsReceived           = expvar.NewInt("total_requests_received")
        totalResponsesSent              = expvar.NewInt("total_responses_sent")
        totalProcessingTimeMicroseconds = expvar.NewInt("total_processing_time_μs")
    )

    return http.HandlerFunc(func(w http.ResponseWriter, r *http.Request) {
        start := time.Now()

        totalRequestsReceived.Add(1)

        next.ServeHTTP(w, r)

        totalResponsesSent.Add(1)

        duration := time.Since(start).Microseconds()
        totalProcessingTimeMicroseconds.Add(duration)
    })
}
In routes.go:
return app.metrics(app.recoverPanic(app.enableCORS(app.rateLimit(app.authenticate(router)))))

zzh@ZZHPC:~$ BODY='{"email": "alice@example.com", "password": "pa55word"}'
zzh@ZZHPC:~$ hey -d "$BODY" -m "POST" http://localhost:4000/v1/tokens/authentication

Summary:
  Total:	6.9818 secs
  Slowest:	2.0896 secs
  Fastest:	1.0939 secs
  Average:	1.6953 secs
  Requests/sec:	28.6458

  Total data:	28581 bytes
  Size/request:	142 bytes

Response time histogram:
  1.094 [1]	|■
  1.193 [0]	|
  1.293 [2]	|■■
  1.393 [2]	|■■
  1.492 [20]	|■■■■■■■■■■■■■■■
  1.592 [25]	|■■■■■■■■■■■■■■■■■■■
  1.691 [40]	|■■■■■■■■■■■■■■■■■■■■■■■■■■■■■■
  1.791 [53]	|■■■■■■■■■■■■■■■■■■■■■■■■■■■■■■■■■■■■■■■■
  1.890 [39]	|■■■■■■■■■■■■■■■■■■■■■■■■■■■■■
  1.990 [14]	|■■■■■■■■■■■
  2.090 [4]	|■■■


Latency distribution:
  10% in 1.4837 secs
  25% in 1.5957 secs
  50% in 1.7114 secs
  75% in 1.8080 secs
  90% in 1.8827 secs
  95% in 1.9387 secs
  99% in 2.0885 secs

Details (average, fastest, slowest):
  DNS+dialup:	0.0003 secs, 1.0939 secs, 2.0896 secs
  DNS-lookup:	0.0001 secs, 0.0000 secs, 0.0011 secs
  req write:	0.0001 secs, 0.0000 secs, 0.0010 secs
  resp wait:	1.6949 secs, 1.0938 secs, 2.0884 secs
  resp read:	0.0000 secs, 0.0000 secs, 0.0001 secs

Status code distribution:
  [201]	200 responses
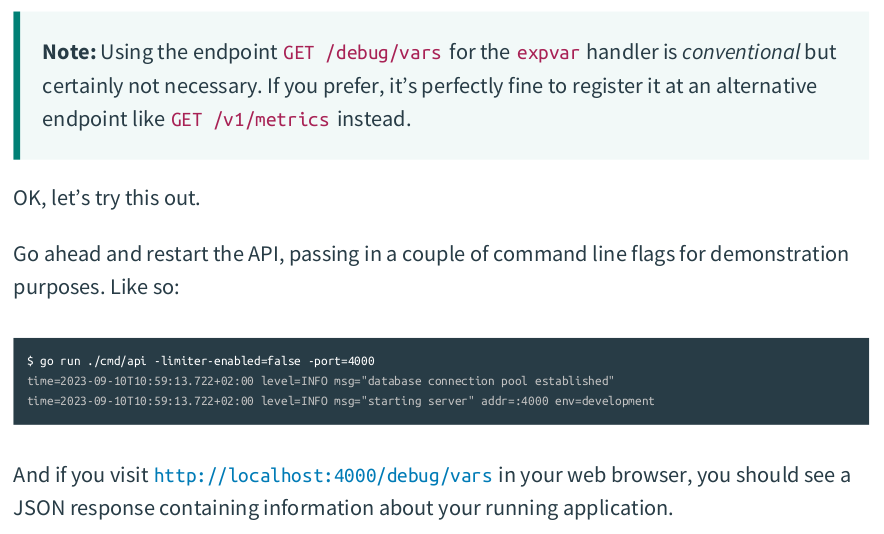
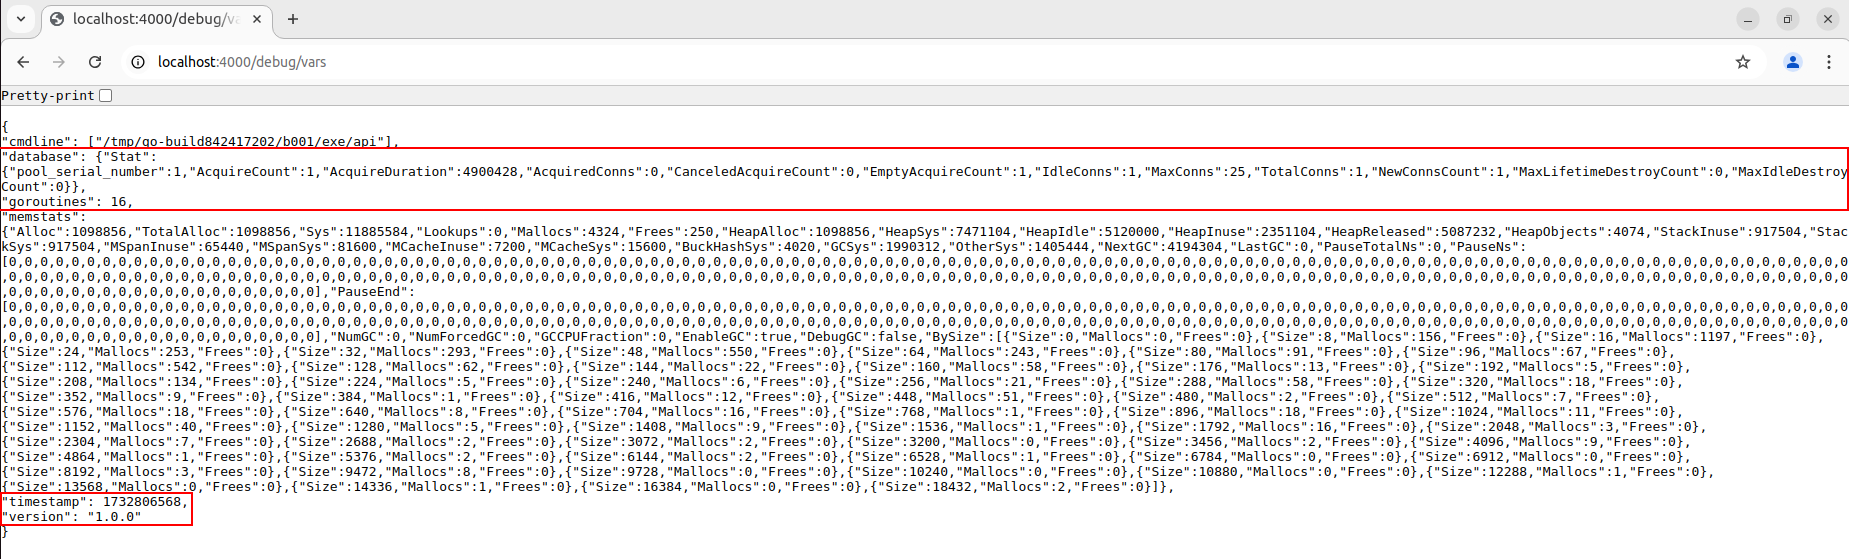
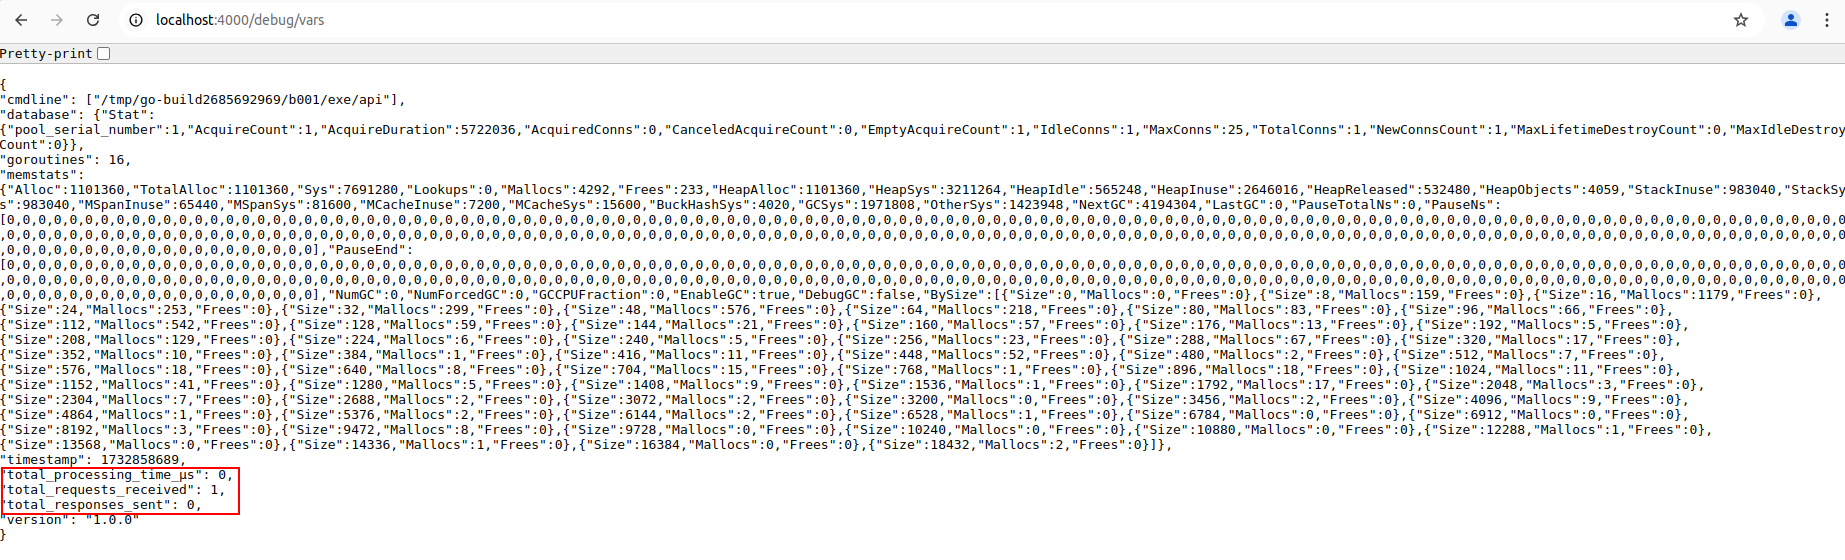
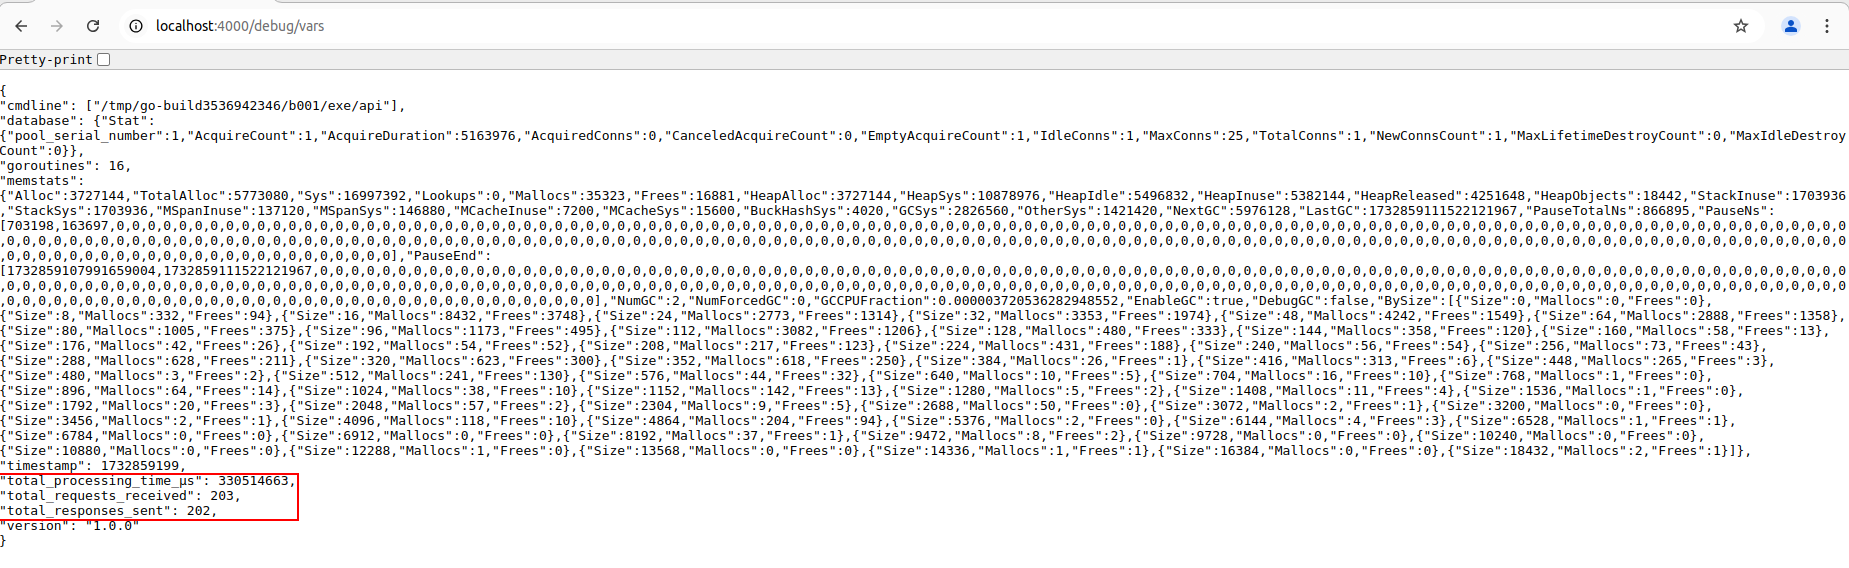
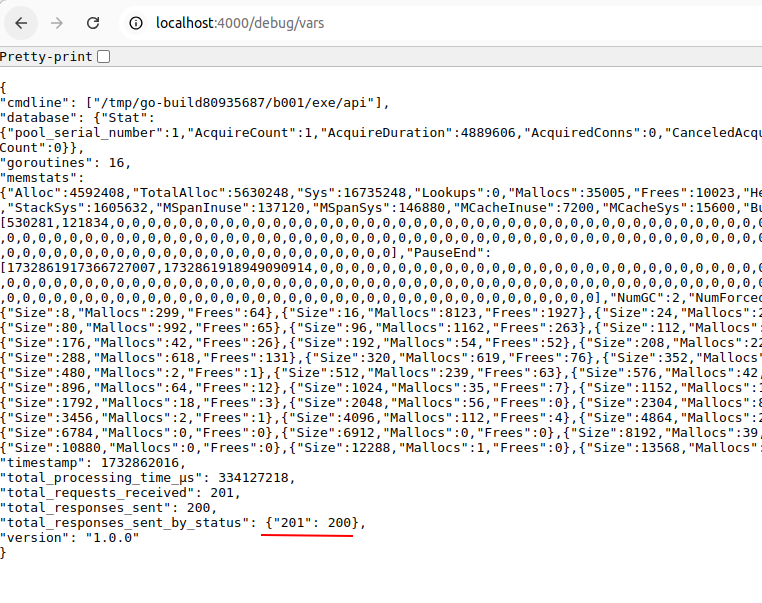
Once that has completed, if you refresh localhost:4000/debug/vars in your browser your metrics should now look something like this:

In middleware.go:
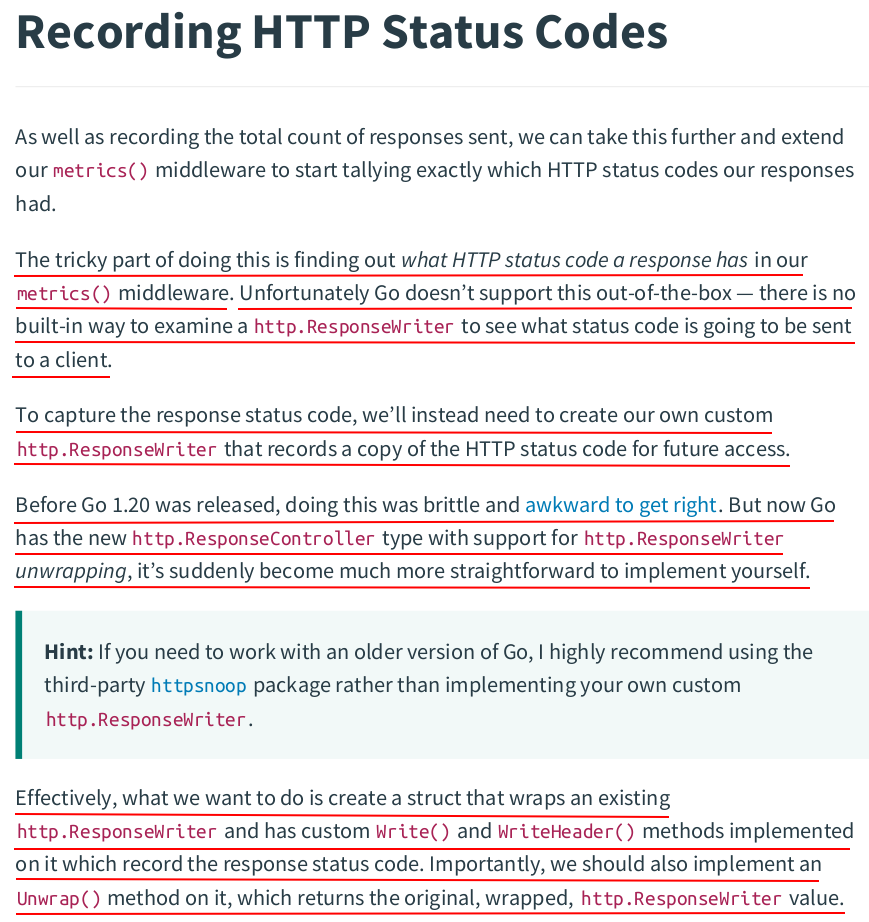
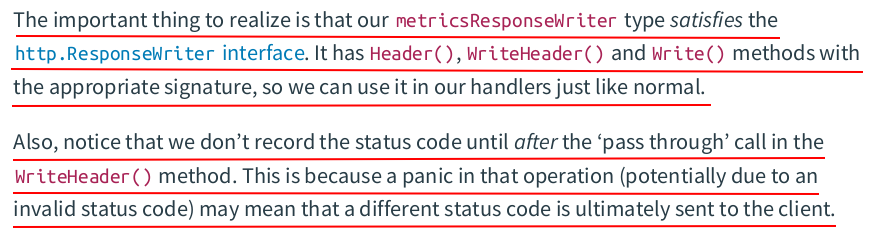
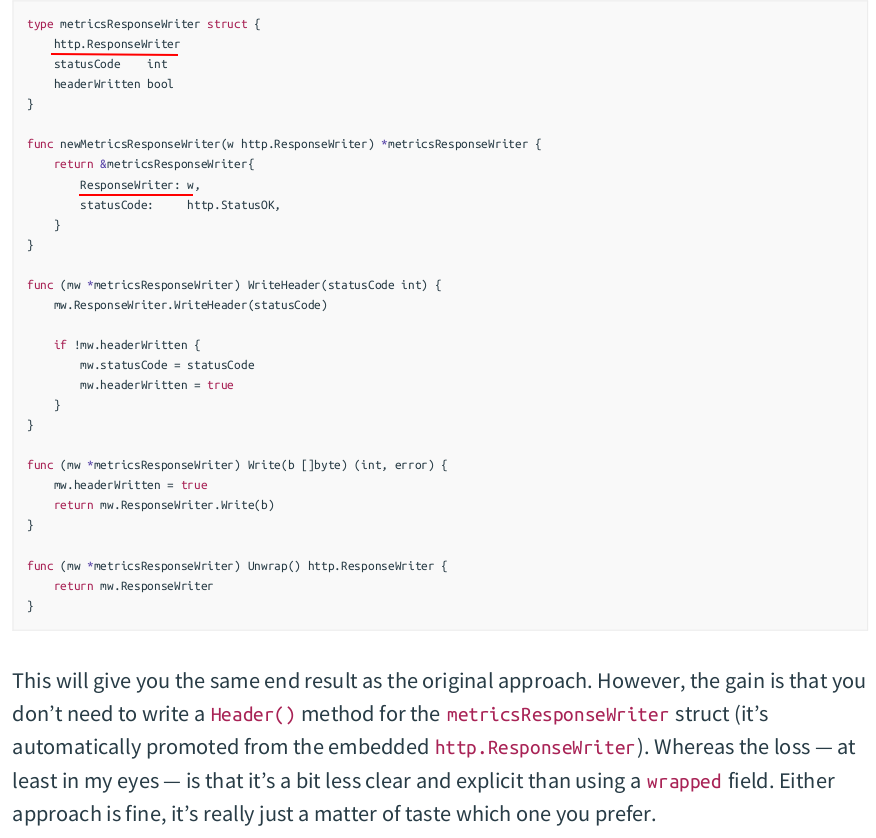
// The metricsResponseWriter type wraps an existing http.ResponseWriter and also
// contains a field for recording the response status code, and a boolen flag
// to indicate whether the response headers have already been written.
type metricsResponseWriter struct {
    wrapped       http.ResponseWriter
    statusCode    int
    headerWritten bool
}

func newMetricsResponseWriter(w http.ResponseWriter) *metricsResponseWriter {
    return &metricsResponseWriter{
        wrapped:    w,
        statusCode: http.StatusOK,
    }
}

// Header is a simple 'pass through' to the Header() method of the wrapped
// http.ResponseWriter.
func (mrw *metricsResponseWriter) Header() http.Header {
    return mrw.wrapped.Header()
}

// WriteHeader does a 'pass through' to the WriteHeader() method of the wrapped
// http.ResponseWriter. But after this returns, we also record the response status
// code (if it hasn't already been recorded) and set the headerWritten field to
// true to indicate that the HTTP response headers have now been written.
func (mrw *metricsResponseWriter) WriteHeader(statusCode int) {
    mrw.wrapped.WriteHeader(statusCode)

    if !mrw.headerWritten {
        mrw.statusCode = statusCode
        mrw.headerWritten = true
    }
}

// Write does a 'pass through' to the Write() method of the wrapped http.ResponseWriter.
// Calling this will automatically write any response headers, so we set the
// headerWritten field to true.
func (mrw *metricsResponseWriter) Write(b []byte) (int, error) {
    mrw.headerWritten = true
    return mrw.wrapped.Write(b)
}

// Unwrap returns the existing wrapped http.ResponseWriter.
func (mrw *metricsResponseWriter) Unwrap() http.ResponseWriter {
    return mrw.wrapped
}
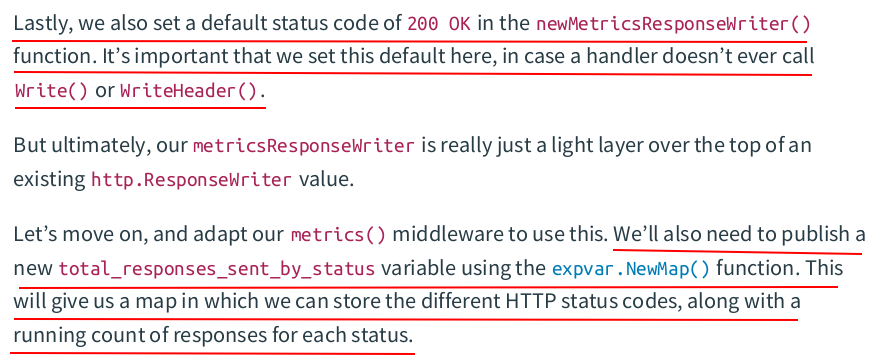
func (app *application) metrics(next http.Handler) http.Handler {
    var (
        totalRequestsReceived           = expvar.NewInt("total_requests_received")
        totalResponsesSent              = expvar.NewInt("total_responses_sent")
        totalProcessingTimeMicroseconds = expvar.NewInt("total_processing_time_μs")
        totalResponsesSentByStatus      = expvar.NewMap("total_responses_sent_by_status")
    )

    return http.HandlerFunc(func(w http.ResponseWriter, r *http.Request) {
        start := time.Now()

        totalRequestsReceived.Add(1)

        mrw := newMetricsResponseWriter(w)

        next.ServeHTTP(mrw, r)

        totalResponsesSent.Add(1)

        totalResponsesSentByStatus.Add(strconv.Itoa(mrw.statusCode), 1)

        duration := time.Since(start).Microseconds()
        totalProcessingTimeMicroseconds.Add(duration)
    })
}
zzh@ZZHPC:~$ BODY='{"email": "alice@example.com", "password": "pa55word"}'
zzh@ZZHPC:~$ hey -d "$BODY" -m "POST" http://localhost:4000/v1/tokens/authentication

Summary:
  Total:	7.0053 secs
  Slowest:	2.3455 secs
  Fastest:	1.0091 secs
  Average:	1.7081 secs
  Requests/sec:	28.5500

  Total data:	28577 bytes
  Size/request:	142 bytes

Response time histogram:
  1.009 [1]	|■
  1.143 [1]	|■
  1.276 [2]	|■
  1.410 [11]	|■■■■■■■
  1.544 [19]	|■■■■■■■■■■■■
  1.677 [45]	|■■■■■■■■■■■■■■■■■■■■■■■■■■■■■
  1.811 [63]	|■■■■■■■■■■■■■■■■■■■■■■■■■■■■■■■■■■■■■■■■
  1.945 [39]	|■■■■■■■■■■■■■■■■■■■■■■■■■
  2.078 [15]	|■■■■■■■■■■
  2.212 [3]	|■■
  2.346 [1]	|■


Latency distribution:
  10% in 1.4508 secs
  25% in 1.5917 secs
  50% in 1.7303 secs
  75% in 1.8421 secs
  90% in 1.9413 secs
  95% in 1.9940 secs
  99% in 2.1478 secs

Details (average, fastest, slowest):
  DNS+dialup:	0.0003 secs, 1.0091 secs, 2.3455 secs
  DNS-lookup:	0.0002 secs, 0.0000 secs, 0.0011 secs
  req write:	0.0001 secs, 0.0000 secs, 0.0010 secs
  resp wait:	1.7076 secs, 1.0091 secs, 2.3455 secs
  resp read:	0.0000 secs, 0.0000 secs, 0.0001 secs

Status code distribution:
  [201]	200 responses


 浙公网安备 33010602011771号