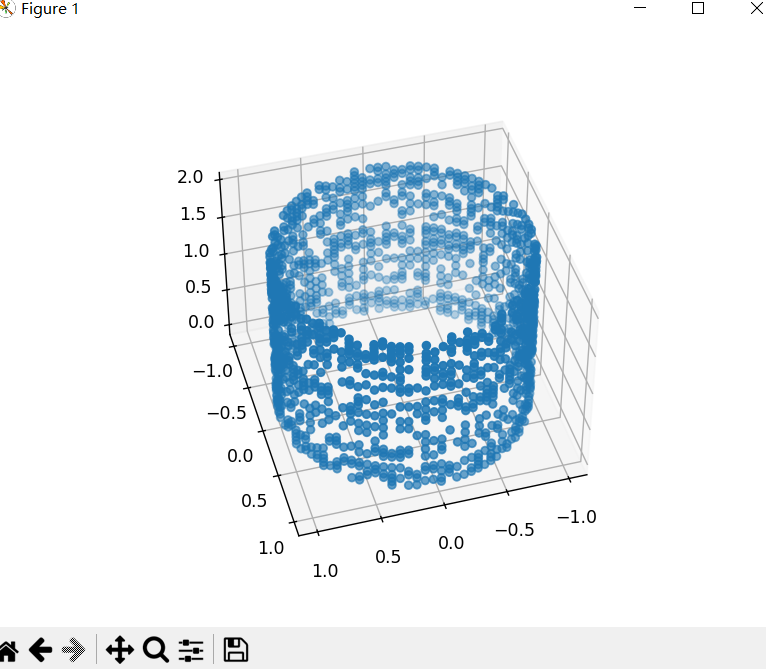
python绘制圆柱体
import os
import random
import numpy as np
import matplotlib.pyplot as plt

def plot_cylinder(center, radius, height, num_points=100):
    # 生成圆柱体的侧面点坐标
    theta = np.linspace(0, 2*np.pi, num_points)
    intervalZ = np.floor(height/0.05)
    indx2 = [ix for ix in range(int(intervalZ))]
    random_int2 = random.sample(indx2, int(intervalZ - 10))
    xx = []
    yy = []
    zz = []
    print(random_int2)
    for j in random_int2:
        indx = [i for i in range(num_points)]
        random_int = random.sample(indx, 50)
        theta2 = theta[random_int]
        print(random_int)
        x = center[0] + radius * np.cos(theta2)
        y = center[1] + radius * np.sin(theta2)

        z = (center[2]+0.05*j)*np.ones_like(x)
        xx = np.hstack((xx, x))
        yy = np.hstack((yy, y))
        zz = np.hstack((zz, z))
        print(j)

    #np.linspace(center[2], center[2]+height, num_points)
    return xx,yy,zz

x,y,z=plot_cylinder((0, 0, 0), 1, 2)
print(x.shape,y.shape,z.shape)
fig = plt.figure()
ax = fig.add_subplot(111, projection='3d')
ax.scatter(x, y, z)
plt.show()
随机生成一个圆柱体点集合:
import os
import random
import numpy as np
import matplotlib.pyplot as plt

def plot_cylinder(center, radius, height, num_points=100):
    # 生成圆柱体的侧面点坐标
    theta = np.linspace(0, 2*np.pi, num_points)
    intervalZ = height/num_points
    indx2 = [ix for ix in range(num_points)]
    random_int2 = random.sample(indx2, 90)
    xx = []
    yy = []
    zz = []
    print(random_int2)
    for j in random_int2:
        indx = [i for i in range(num_points)]
        random_int = random.sample(indx, 50)
        theta2 = theta[random_int]
        print(random_int)
        x = center[0] + radius * np.cos(theta2)
        y = center[1] + radius * np.sin(theta2)

        z = (center[2]+intervalZ*j)*np.ones_like(x)
        xx = np.hstack((xx, x))
        yy = np.hstack((yy, y))
        zz = np.hstack((zz, z))
        print(j)

    #np.linspace(center[2], center[2]+height, num_points)
    return xx,yy,zz

def rotate_X(x, y, z, alpha):
    alpha = alpha * (np.pi / 180)
    x_r = x
    y_r = np.cos(alpha) * y - np.sin(alpha) * z
    z_r = np.sin(alpha) * y + np.cos(alpha) * z
    return round(x_r, 4), round(y_r, 4), round(z_r, 4)

def rotate_Y(x, y, z, beta):
    beta = beta * (np.pi / 180)
    x_r = np.cos(beta) * x + np.sin(beta) * z
    y_r = y
    z_r = -np.sin(beta) * x + np.cos(beta) * z
    return round(x_r, 4), round(y_r, 4), round(z_r, 4)

def rotate_Z(x, y, z, gamma):
    gamma = gamma * (np.pi / 180)
    x_r = np.cos(gamma) * x - np.sin(gamma) * y
    y_r = np.sin(gamma) * x + np.cos(gamma) * y
    z_r = z
    return round(x_r, 4), round(y_r, 4), round(z_r, 4)

x,y,z = plot_cylinder((0, 0, 0), 0.2, 1)
x_new=[]
y_new=[]
z_new=[]
theta = np.linspace(0,360, 360)
random_int_angle = random.randint(1,360)
random_int_angle2 = random.randint(1,360)
for x_t, y_t, z_t in zip(x, y, z):
    x1, y1, z1 = rotate_X(x_t, y_t, z_t, theta[random_int_angle])
    x2, y2, z2 = rotate_Y(x1, y1, z1, theta[random_int_angle2])
    x_new = np.hstack((x_new,x2))
    y_new = np.hstack((y_new,y2))
    z_new = np.hstack((z_new,z2))

print(x.shape,y.shape,z.shape)
fig = plt.figure()
ax = fig.add_subplot(111, projection='3d')
ax.scatter(x_new, y_new, z_new)
ax.set_xlim([-1.5 * 1, 1.5 * 1])
ax.set_ylim([-1.5 * 1, 1.5 * 1])
ax.set_zlim([-1, 2])
ax.set_xlabel('X')
ax.set_ylabel('Y')
ax.set_zlabel('Z')
plt.show()
随机生成一个圆柱体
import os
import random
import numpy as np
import matplotlib.pyplot as plt
def plot_cylinder(center, radius, height, num_points=100):
    # 生成圆柱体的侧面点坐标
    theta = np.linspace(0, 2*np.pi, num_points)
    intervalZ = height/num_points
    indx2 = [ix for ix in range(num_points)]
    random_int2 = random.sample(indx2, 100)
    xx = []
    yy = []
    zz = []
    nx = []
    ny = []
    nz = []
    print(random_int2)
    for j in random_int2:
        indx = [i for i in range(num_points)]
        random_int = random.sample(indx, 50)
        theta2 = theta[random_int]
        print(random_int)
        x = center[0] + radius * np.cos(theta2)
        y = center[1] + radius * np.sin(theta2)
        z_tmp= intervalZ * j
        z = (center[2]+ z_tmp)*np.ones_like(x)
        for iz in range(50):
            z[iz] = z[iz]+ 0.5* intervalZ * random.uniform(-1,1)
        nxx = np.cos(theta2)
        nyy = np.sin(theta2)
        nzz = 0 * np.ones_like(x)
        xx = np.hstack((xx, x))
        yy = np.hstack((yy, y))
        zz = np.hstack((zz, z))
        nx = np.hstack((nx, nxx))
        ny = np.hstack((ny, nyy))
        nz = np.hstack((nz, nzz))
        print(j)

    #np.linspace(center[2], center[2]+height, num_points)
    return xx,yy,zz,nx,ny,nz

def rotate_X(x, y, z, alpha):
    alpha = alpha * (np.pi / 180)
    x_r = x
    y_r = np.cos(alpha) * y - np.sin(alpha) * z
    z_r = np.sin(alpha) * y + np.cos(alpha) * z
    return round(x_r, 4), round(y_r, 4), round(z_r, 4)

def rotate_Y(x, y, z, beta):
    beta = beta * (np.pi / 180)
    x_r = np.cos(beta) * x + np.sin(beta) * z
    y_r = y
    z_r = -np.sin(beta) * x + np.cos(beta) * z
    return round(x_r, 4), round(y_r, 4), round(z_r, 4)

def rotate_Z(x, y, z, gamma):
    gamma = gamma * (np.pi / 180)
    x_r = np.cos(gamma) * x - np.sin(gamma) * y
    y_r = np.sin(gamma) * x + np.cos(gamma) * y
    z_r = z
    return round(x_r, 4), round(y_r, 4), round(z_r, 4)


data_path = '../data/Cylinders'
n_samples = 10
if not os.path.exists(data_path):
    os.makedirs(data_path)


theta_ply = np.linspace(0,360, 360)
nr = np.linspace(1,8, 16)
for isample in range(n_samples):
    x_new=[]
    y_new=[]
    z_new=[]
    nx_new = []
    ny_new = []
    nz_new = []
    random_int_angle = random.randint(1, 360)
    random_int_angle2 = 360 - random.randint(1, 360)
    random_int_nr = isample % 16 if (isample % 16 > 0) else  1
    x,y,z,nx,ny,nz = plot_cylinder((0, 0, 0), 0.025 * random_int_nr, 1)
    for x_t, y_t, z_t,nx_t,ny_t,nz_t in zip(x, y, z, nx, ny, nz):
        x1, y1, z1 = rotate_X(x_t, y_t, z_t, theta_ply[random_int_angle])
        x2, y2, z2 = rotate_Y(x1, y1, z1, theta_ply[random_int_angle2])
        nx1, ny1, nz1 = rotate_X(nx_t, ny_t, nz_t, theta_ply[random_int_angle])
        nx2, ny2, nz2 = rotate_Y(nx1, ny1, nz1, theta_ply[random_int_angle2])
        x_new = np.hstack((x_new,x2))
        y_new = np.hstack((y_new,y2))
        z_new = np.hstack((z_new,z2))
        nx_new = np.hstack((nx_new, nx2))
        ny_new = np.hstack((ny_new, ny2))
        nz_new = np.hstack((nz_new, nz2))


    f_Edges = data_path + '/{}{}.ply'.format('cylinder', isample)
    with open(f_Edges, 'w') as file:
        file.writelines('ply\nformat ascii 1.0\ncomment VCGLIB generated\nelement vertex 5000\nproperty float x\n'
                        'property float y\nproperty float z\nproperty float nx\nproperty float ny\n'
                        'property float nz\nelement face 0\nproperty list uchar int vertex_indices\nend_header\n')
        for a, l, lc,bnx,bny,bnz in zip(x_new, y_new, z_new,nx_new, ny_new, nz_new):
            #写入一条记录
            file.writelines('{} {} {} {} {} {}\n'.format(a, l, lc,bnx,bny,bnz))

print(x.shape,y.shape,z.shape)
fig = plt.figure()
ax = fig.add_subplot(111, projection='3d')
ax.scatter(x_new, y_new, z_new)
ax.set_xlim([-1.5 * 1, 1.5 * 1])
ax.set_ylim([-1.5 * 1, 1.5 * 1])
ax.set_zlim([-1, 2])
ax.set_xlabel('X')
ax.set_ylabel('Y')
ax.set_zlabel('Z')
plt.show()
作者:太一吾鱼水
文章未经说明均属原创,学习笔记可能有大段的引用,一般会注明参考文献。
欢迎大家留言交流,转载请注明出处。

 浙公网安备 33010602011771号