PKU-MMD骨架数据可视化程序,动态图,python
PKU-MMD数据集简介
官网链接:https://www.icst.pku.edu.cn/struct/Projects/PKUMMD.html,
The dataset is captured via the Kinect v2 sensors from multiple viewpoints with recording ratio set as 25 fps, which collect color images, depth maps, IR sequences, and human skeleton joints synchronously.
RGB videos are recorded in the provided resolution of 1920 × 1080.
Depth maps are sequences of 2D depth values in millimeters. The resolution of each depth frame is 512 × 424.
IR sequences are also collected and stored frame by frame in the resolution of 512 × 424.
骨架数据是从视频帧中姿态估计得到的。
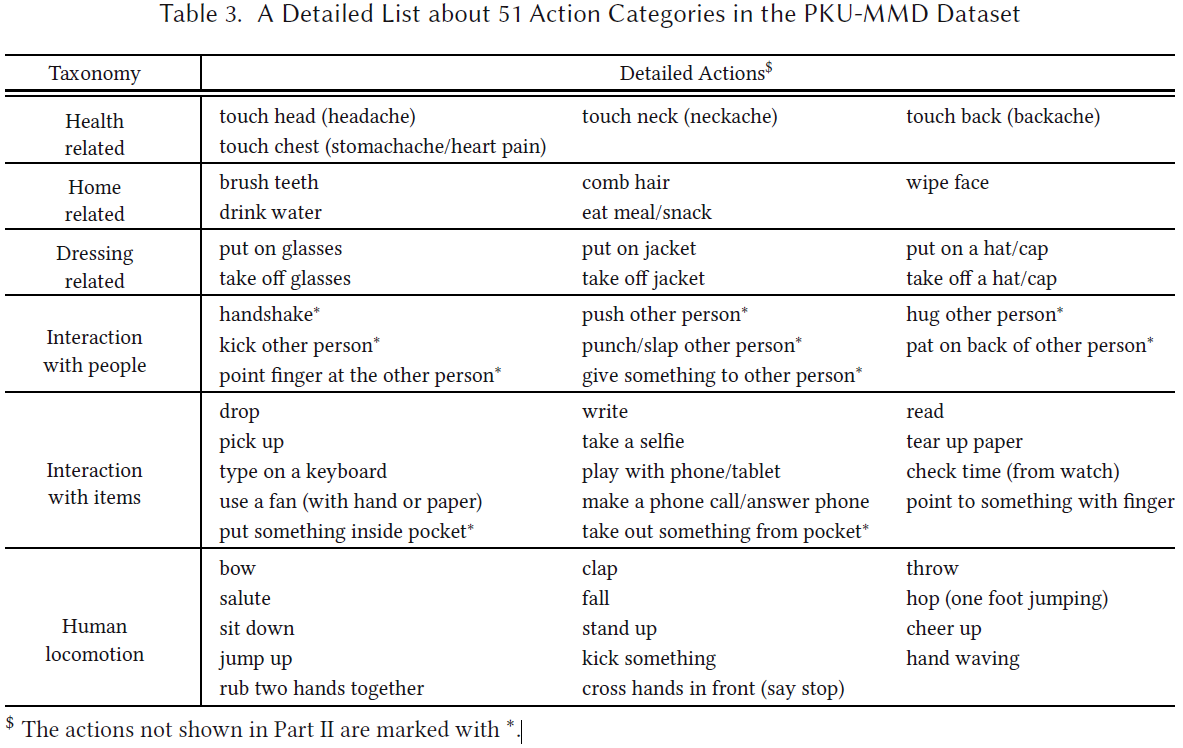
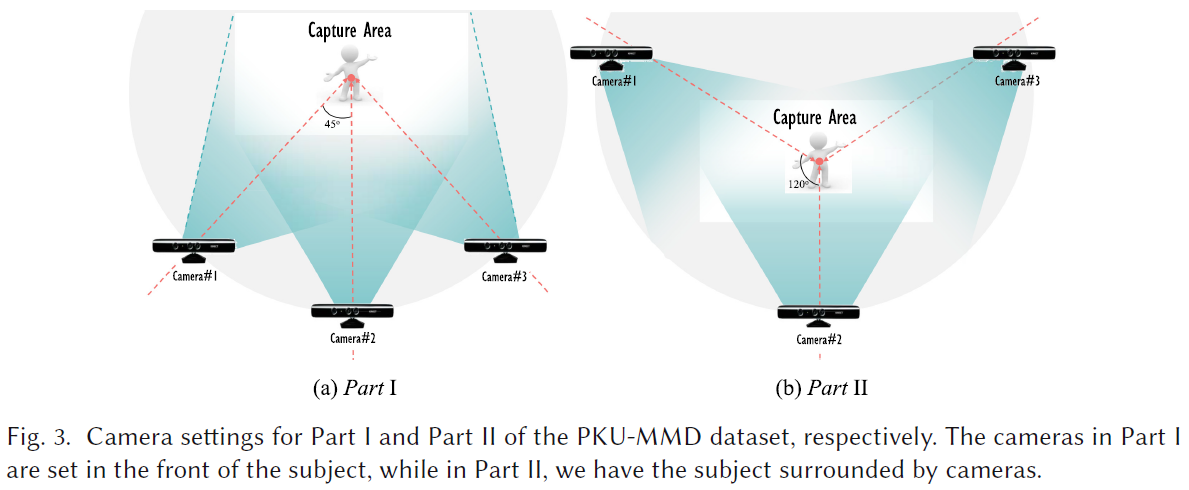
PKU-MMD contains 2 parts, for action detection tasks with increasing difficulty. Part 1 is large-margin action detection task. Part 2 is small-margin action detection task. Compared to Part I, Part II is more challenging due to short action intervals, concurrent actions and heavy occlusion.
Part I contains 1,076 untrimmed video sequences with 51 action classes performed by 66 subjects.
Part II contains 1,009 untrimmed video sequences with 41 action classes performed by 13 subjects.
Part 1 有43个单个人的动作类别,以及8个两个人互动的动作类别;
Part 2 只有41个单个人的动作类别,没有两个人的互动动作。
除官网提供的一些信息外,下面我再补充两点信息。
补充信息1 (PKU-MMD Part1)
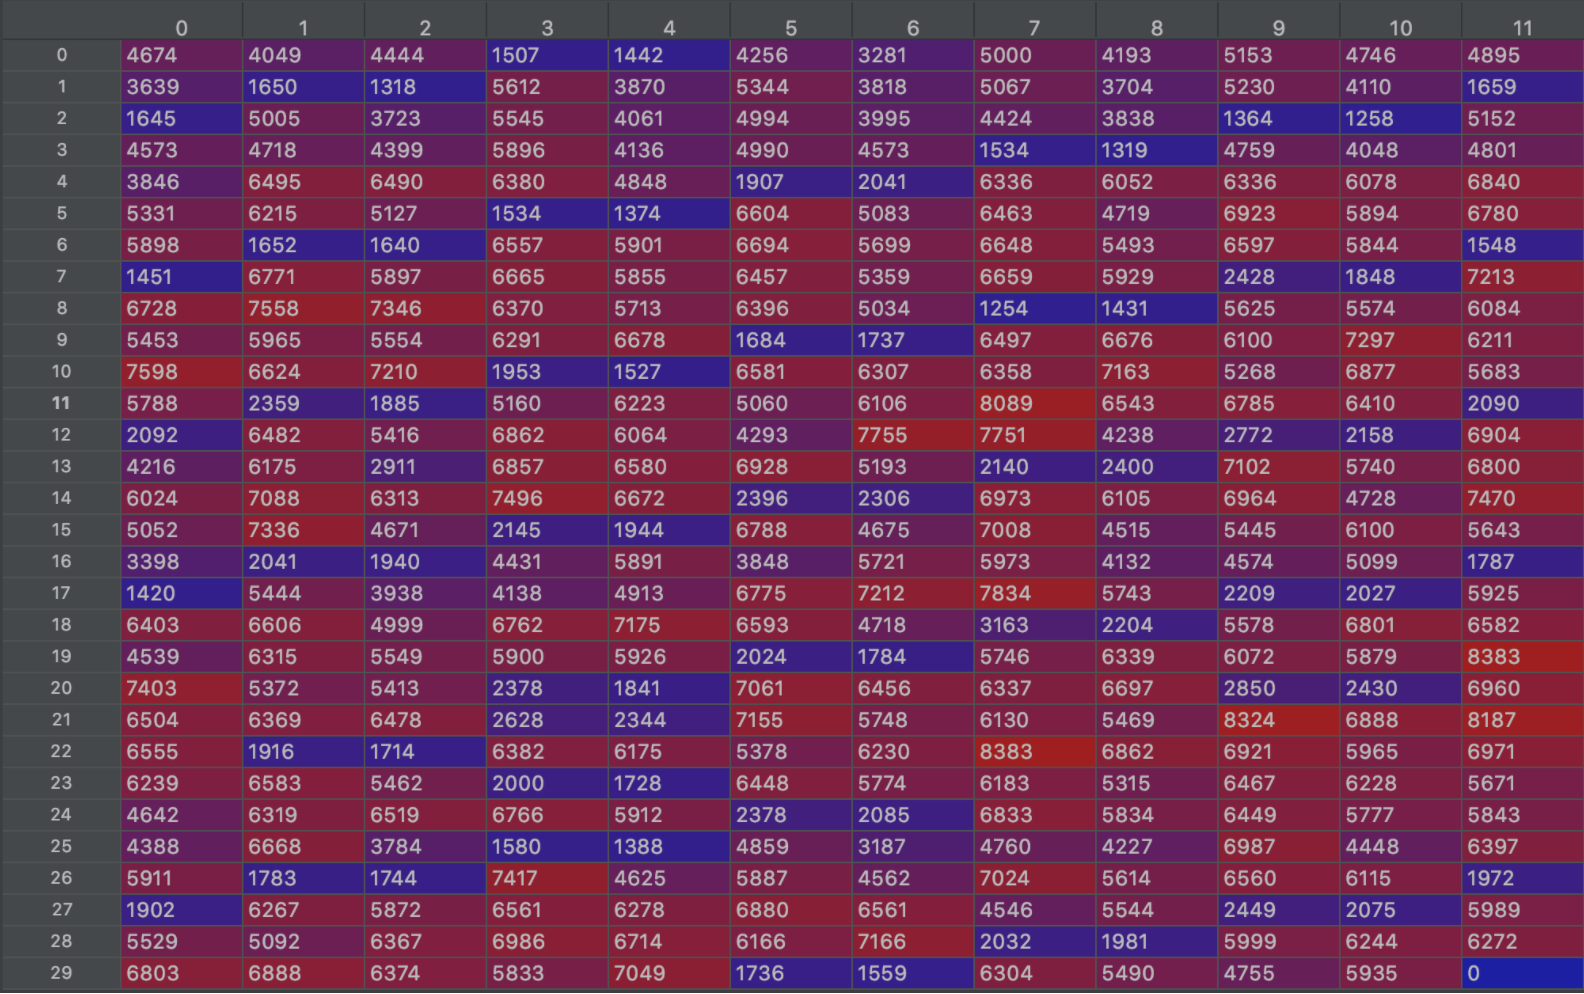
各条视频的长度,如下表,第一条视频有4674帧,第二条视频有4049帧。这个数据集有三个view,每一个view有359条视频,总共有1825266帧,平均每个视频有约5070帧。下表中的最后一个数字0是为了画表格而随手加上去的。
补充信息2 (PKU-MMD Part1)
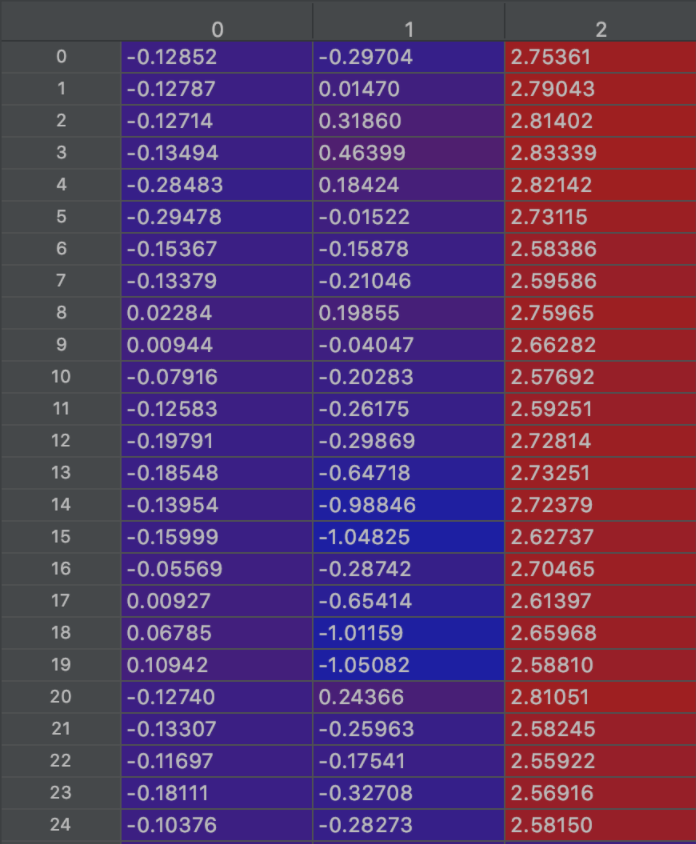
第一个视频的第一帧中,第一个人的骨架节点坐标,第一列表示x坐标,第二列表示y坐标,第三列表示z坐标:
补充信息3 (PKU-MMD Part1)
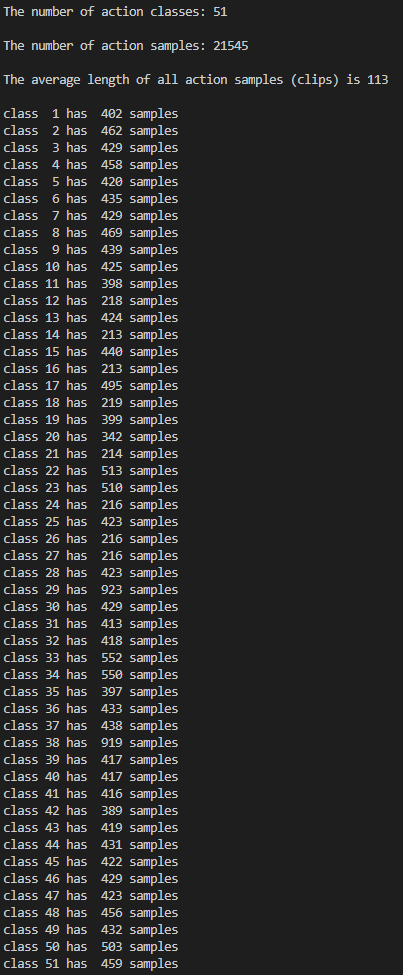
把PKU-MMD Part1和Part2条长视频按照单个动作进行切割,得到各个动作的clip。下面的是一些统计信息:
Part 1:
Part 2:
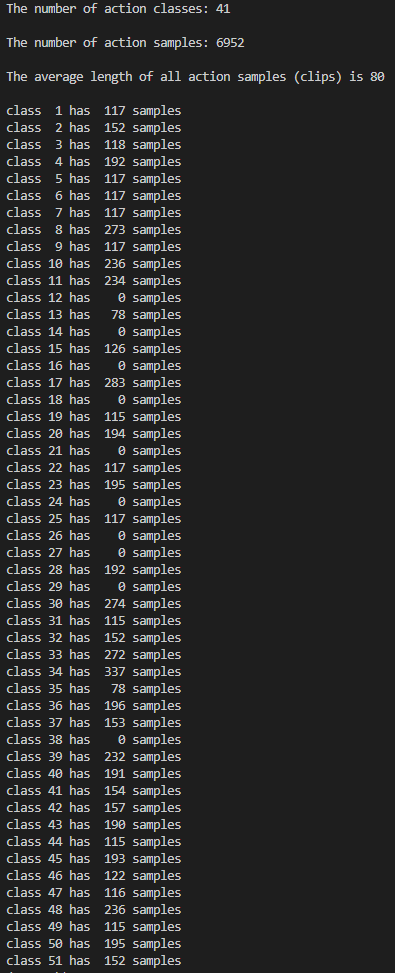
上面这两组统计信息中,在action clips数目上,part 1 与下表的数字相差一点点,part 2 的与下表相等。
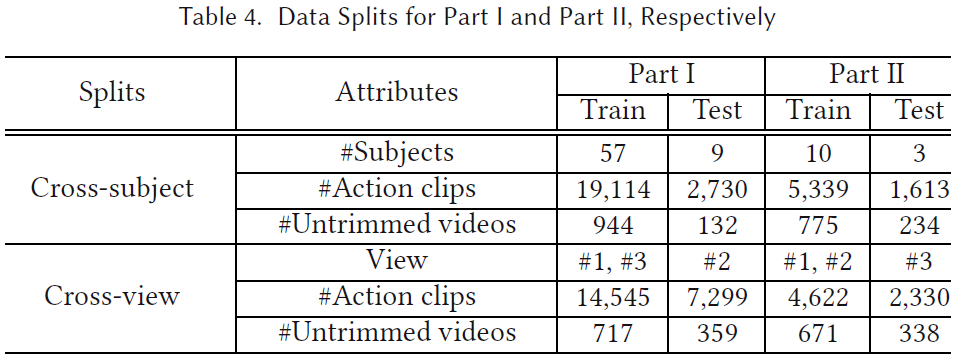
论文 “Skeleton-Contrastive 3D Action Representation Learning” 中关于PKU-MMD数据集action clip的统计信息:
骨架数据可视化
PKU-MMD数据集中数据数据顺序与各节点的对应关系如下图所示。官网上没给出这个对应关系,我通过视频和数据散点图之间来回核对,摸清了这个对应关系。
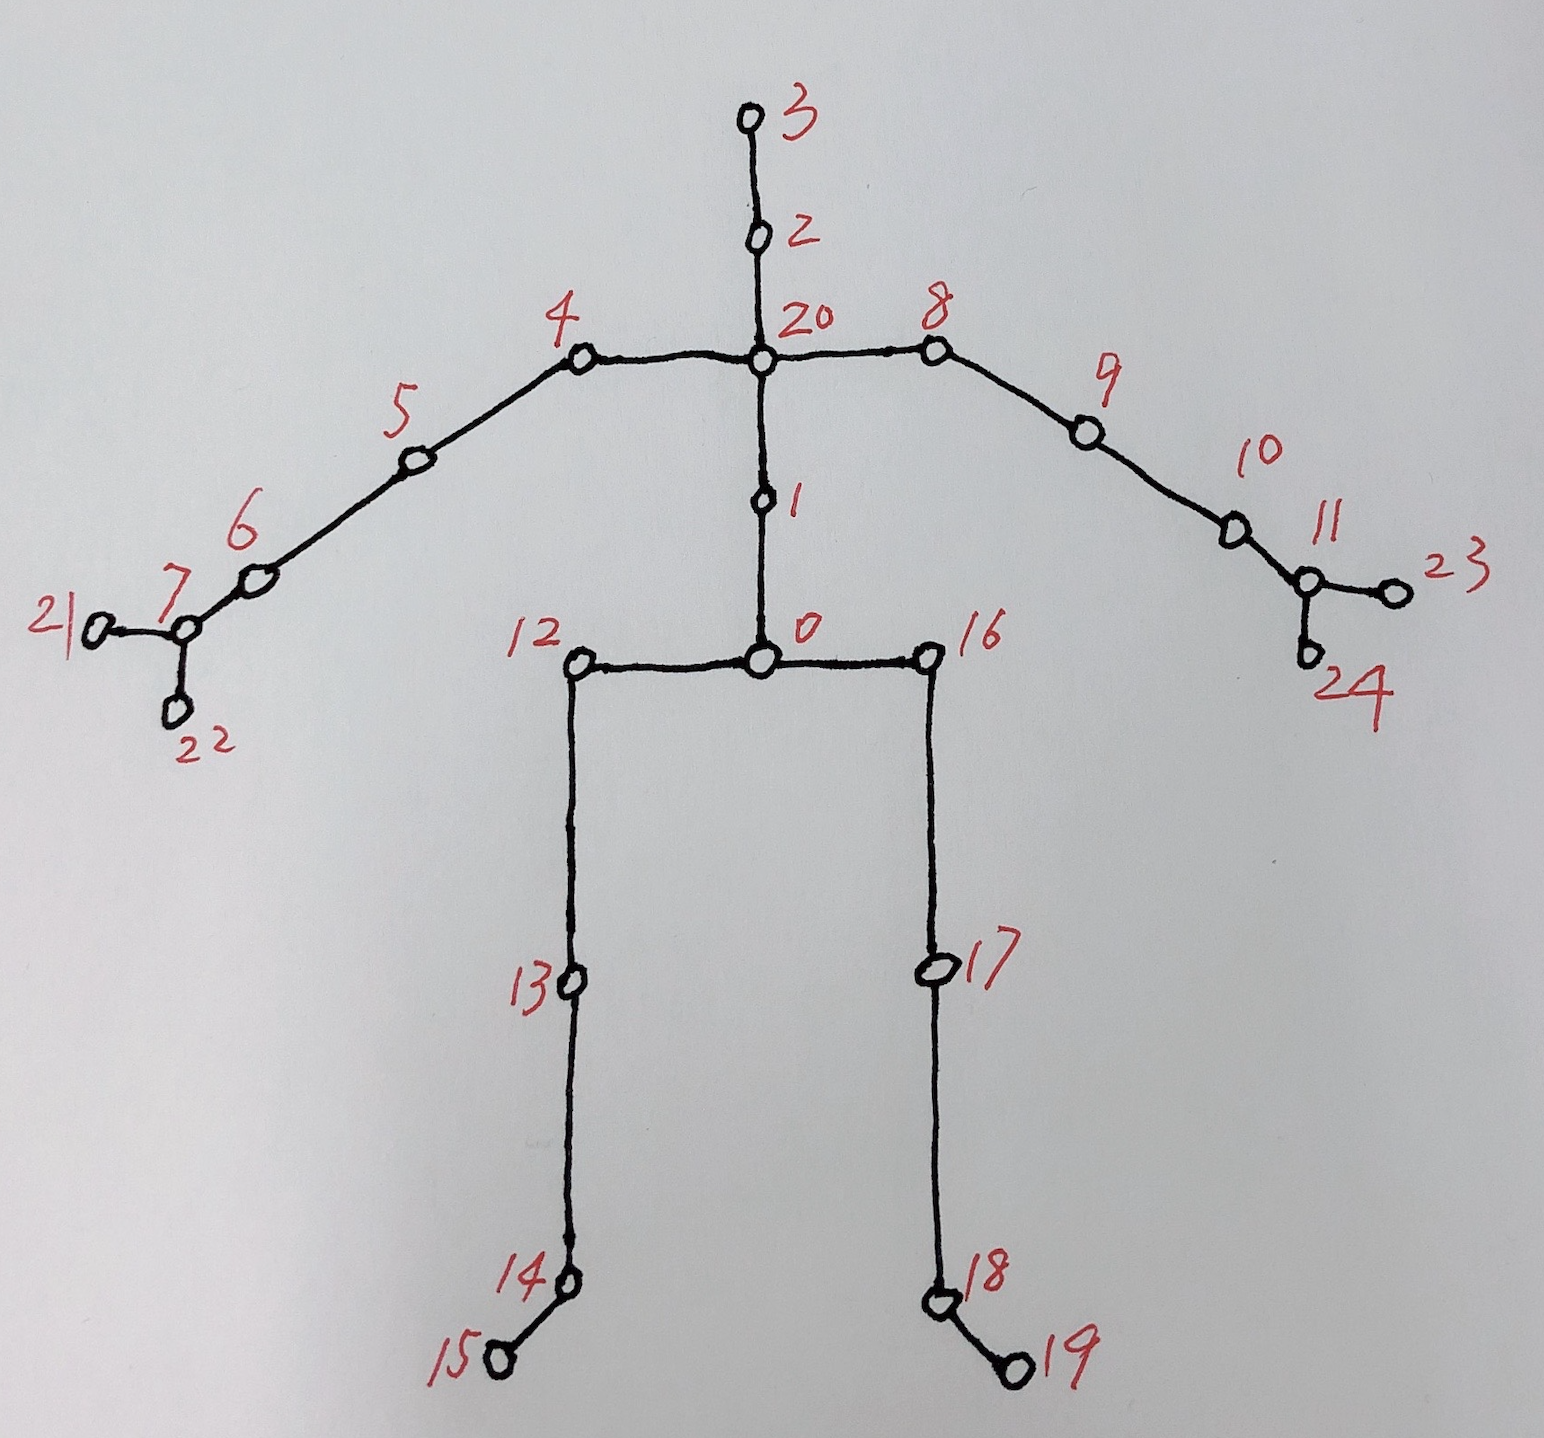
图中的骨架各节点的连接方式是通过看原论文(PKU-MMD: A Large Scale Benchmark for Continuous Multi-Modal Human Action Understanding)而画出来的,但我最近看到另外一篇论文(A Deep Learning Approach for Human Action Recognition using Skeletal Information)的画法:
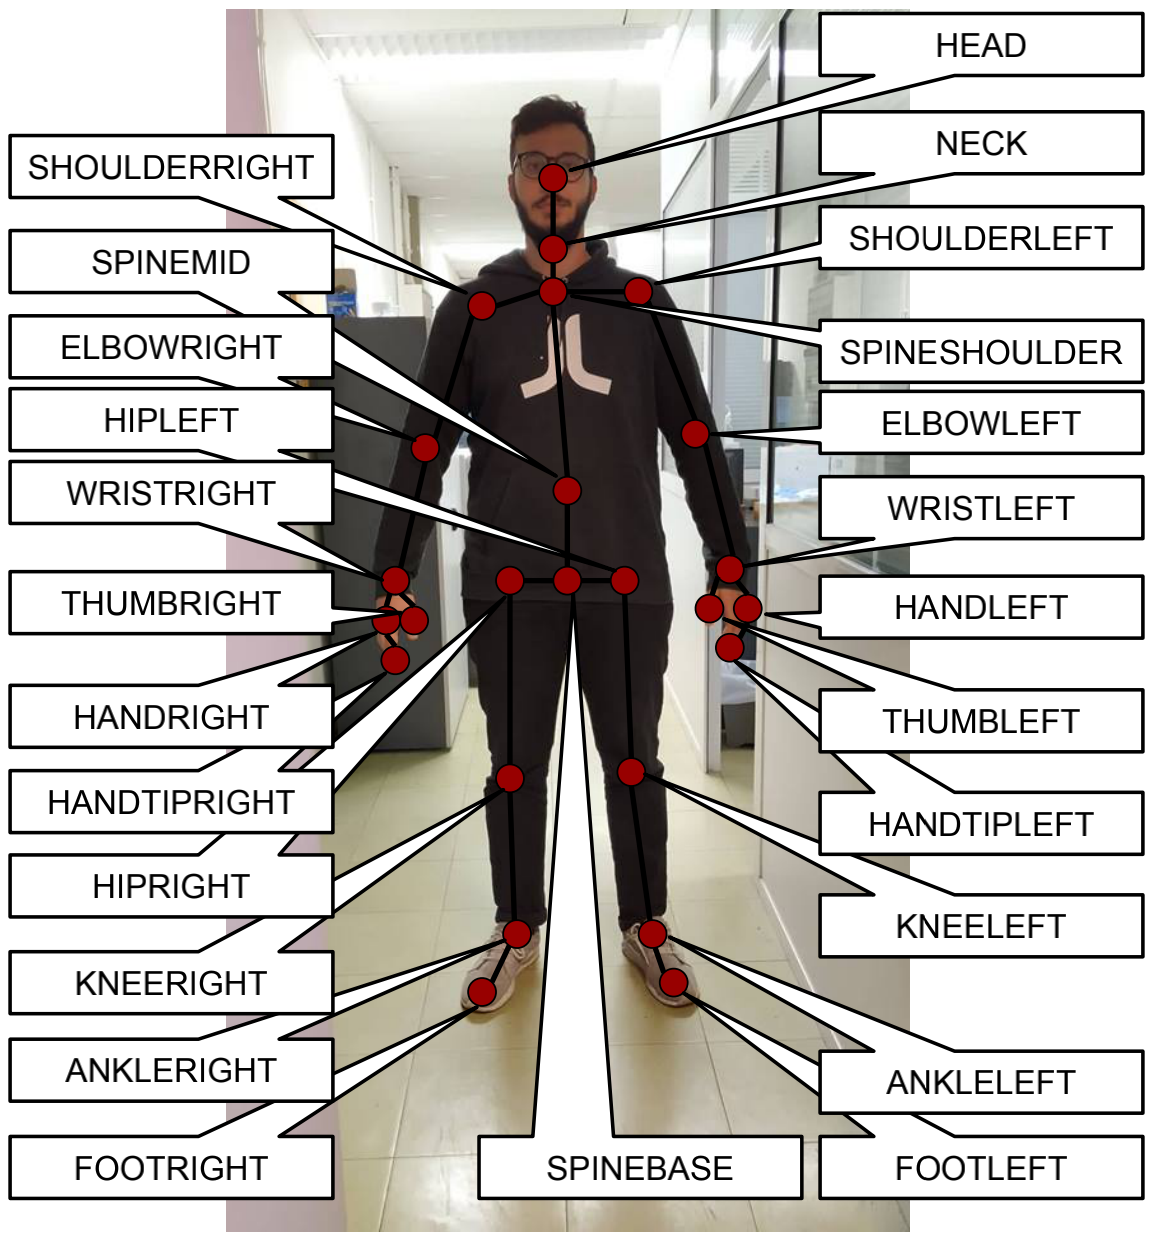
这两种画法唯一的区别在手部,后者似乎更合理。但为了和原论文吻合,下面的可视化程序采用的是前者。
动态可视化程序如下:
import os
import numpy as np
import matplotlib.pyplot as plt
from mpl_toolkits.mplot3d import Axes3D

file_name = '0017-M.txt'
points = np.loadtxt(os.path.join('/Users/wangpeng/Desktop/PKU_MMD/Skeleton', file_name), dtype=np.float)
row = points.shape[0]
point = (points[:, :75]).reshape(row, 25, 3)
xmax = np.max(point[:, :, 0])
xmin = np.min(point[:, :, 0])
ymax = np.max(point[:, :, 1])
ymin = np.min(point[:, :, 1])
zmax = np.max(point[:, :, 2])
zmin = np.min(point[:, :, 2])

# 读取标签
num_classes = 52   # number of classes
gt_array = np.loadtxt(os.path.join('/Users/wangpeng/Desktop/PKU_MMD/Label', file_name), dtype=np.int, delimiter=',')
label = np.ones([row, ], dtype=np.int) * (num_classes - 1)   # 0~50th is the original ground truth. The 51st class is the background.
for i in range(gt_array.shape[0]):
    label[gt_array[i, 1]-1: gt_array[i, 2]-1] = gt_array[i, 0] - 1   # 末尾的-1是为了让标签从0开始

# 相邻各节点列表,用来画节点之间的连接线
arm = [21, 7, 6, 5, 4, 20, 8, 9, 10, 11, 23]
rightHand = [22, 7]
leftHand = [24, 11]
bodyLeg = [3, 2, 20, 1, 0, 12, 13, 14, 15]
leftLeg = [0, 16, 17, 18, 19]

# 2D展示------------------------------------------------------------------------
n = 0   # 从第n帧开始展示
m = 1   # 到第m帧结束,n<m<row
plt.figure()
plt.ion()
for i in range(n, m):
    plt.cla()
    plt.scatter(point[i, :, 0], point[i, :, 1], c='red', s=40.0)
    plt.plot(point[i, arm, 0], point[i, arm, 1], c='green', lw=2.0)
    plt.plot(point[i, rightHand, 0], point[i, rightHand, 1], c='green', lw=2.0)
    plt.plot(point[i, leftHand, 0], point[i, leftHand, 1], c='green', lw=2.0)
    plt.plot(point[i, bodyLeg, 0], point[i, bodyLeg, 1], c='green', lw=2.0)
    plt.plot(point[i, leftLeg, 0], point[i, leftLeg, 1], c='green', lw=2.0)
    plt.text(xmax-0.8, ymax-0.2, 'frame: {}/{}'.format(i, row))
    plt.text(xmax-0.8, ymax-0.4, 'label: ' + str(label[i]))
    plt.xlim(xmin, xmax)
    plt.ylim(ymin, ymax)
    plt.pause(0.01)

plt.ioff()
plt.show()


# 3D展示------------------------------------------------------------------------
#n = 1100   # 从第n帧开始展示
#m = 1200   # 到第m帧结束,n<m<row
#fig = plt.figure()   # 先生成一块画布,然后在画布上添加3D坐标轴
#plt.ion()
#for i in range(n, m):
#    fig.clf()
#    ax = Axes3D(fig)
#    ax.scatter(point[i, :, 0], point[i, :, 1], point[i, :, 2], c='red', s=40.0)
#    ax.plot(point[i, arm, 0], point[i, arm, 1], point[i, arm, 2], c='green', lw=2.0)
#    ax.plot(point[i, rightHand, 0], point[i, rightHand, 1], point[i, rightHand, 2], c='green', lw=2.0)
#    ax.plot(point[i, leftHand, 0], point[i, leftHand, 1], point[i, leftHand, 2], c='green', lw=2.0)
#    ax.plot(point[i, bodyLeg, 0], point[i, bodyLeg, 1], point[i, bodyLeg, 2], c='green', lw=2.0)
#    ax.plot(point[i, leftLeg, 0], point[i, leftLeg, 1], point[i, leftLeg, 2], c='green', lw=2.0)
#    ax.text(xmax-0.8, ymax-0.2, zmax-0.2, 'frame {}/{}'.format(i, row))
#    ax.text(xmax-0.8, ymax-0.4, zmax-0.4, 'label: ' + str(label[i]))
#    ax.set_xlabel("X")
#    ax.set_ylabel("Y")
#    ax.set_zlabel("Z")
#    ax.set_xlim(xmin, xmax)
#    ax.set_ylim(ymin, ymax)
#    ax.set_zlim(zmin, zmax)
#    plt.pause(0.01)
#
#plt.ioff()
#plt.show()
下面只展示第一帧:


 浙公网安备 33010602011771号