
perf report的文件如何在windows下查看
在 Windows 下,perf report 生成的报告文件通常是以二进制格式保存的,无法直接在 Windows 下查看。不过,你可以将 perf.data 文件转换为文本格式,然后在 Windows 下使用其他工具进行分析和查看。
你可以使用 perf script 命令将 perf.data 文件转换为文本格式的报告,然后将文本文件复制到 Windows 系统中,并使用文本编辑器或其他适当的工具来查看和分析。例如,在 Linux 或 macOS 环境中:
perf script > perf.txt
然后将 perf.txt 文件复制到 Windows 系统中,使用文本编辑器打开查看。
perf report 生成的报告中使用键盘按键查看report
g—— 回到最开始
F——翻页(大幅度)
D——翻页(大幅度)
S——打开日志文件
Q——退出
E——逐行向下类似向下按键
Y——逐行向上
W——大幅向上翻页
在 perf report 生成的报告中,调用关系图(Call Graph)可以展开和收起以查看更详细或更高层次的信息。以下是一些在 perf report 中展开和收起调用关系图的常用命令:
-
展开函数调用栈:
- 使用回车键:在报告界面中,按下回车键可以展开当前选定的函数调用栈,显示更详细的信息。
-
收起函数调用栈:
- 使用退格键(Backspace):按下退格键可以收起当前选定的函数调用栈,以便在更高层次查看信息。
-
移动到上一层调用:
- 使用左箭头键(←)或 ‘b’ 键:这些命令可以将视图移动到上一层调用,显示调用关系图的父函数。
-
移动到下一层调用:
- 使用右箭头键(→)或 ‘f’ 键:这些命令可以将视图移动到下一层调用,显示调用关系图的子函数。
-
查看特定函数的调用关系:
- 使用 ‘s’ 键:选中一个函数之后,按下 ‘s’ 键可以显示该函数的子函数,展开调用关系图。
-
返回到顶层调用关系图:
- 使用 ‘t’ 键:按下 ‘t’ 键可以返回到顶层的调用关系图,显示整个程序的性能概览。
通过这些命令,你可以在 perf report 的交互式界面中灵活地展开和收起函数调用关系图,以便更好地理解性能数据并定位可能的性能问题。请注意,具体的命令和键盘快捷键可能会有一些变化,取决于 perf 工具的版本和配置。
你可以通过查看 perf 的文档或使用 perf report --help 命令来获取更多详细信息。
perf report --help 命令用于显示 perf report 命令的帮助信息,包括可用选项、参数和示例用法等。在终端或命令提示符下执行此命令可以获取详细的使用说明。以下是可能出现的一些帮助信息:
Usage: perf report [<options>] [<input>]

  -i, --input=<file>         input file name
  -D, --dump-raw-trace       dump raw trace to stdout
  -s, --show-nr-samples      show the number of samples on each function
  -u, --show-total-period    show the total period on each function
  -S, --symfs=<path>         look for files with symbols in this directory
  -k, --kernel               prefer kernel samples (default)
  -u, --user                 prefer user samples
  -d, --dsos=<path>          look for files with symbols in this directory
  -n, --symbols               show symbol names
  -v, --verbose              be more verbose (show raw counts)
  -g, --group                group by thread
  -t, --thread               synthesize threads from CPU samples
  -l, --list-symbols         list symbols in data file
  -q, --quiet                do not show percentiles
  -T, --timestamp            show time stamp of the data file
  -w, --weight               show samples weight
  -C, --children             show children of functions
  -c, --call-graph           generate call graph
  -P, --percent-limit=<nr>   threshold percentage to limit the call chains (default: 1)
  -M, --max-stack            set the maximum call chain depth (default: 0)
  -m, --min-stack            set the minimum call chain depth (default: 0)
  -p, --pid=<pid>            only report samples from this pid
  -e, --event=<event>        event selector (or use -f)
  -f, --fields=<fields>      field selector (or use -e)
  -F, --field-separator=<char> field separator (default: ',')
  -A, --address              show symbol addresses
  -x, --cross-namespace      show cross-namespace callchains
  -h, --help                 show this help

For example, 'perf report -i perf.data' will show the perf report of the file perf.data.
这些选项允许你在运行 perf report 时指定各种参数,以自定义报告的输出内容和格式。例如,你可以使用 -i 选项指定输入文件名,使用 -c 选项生成函数调用图,使用 -p 选项指定特定的进程 ID 等。
perf 工具功能非常多,今天我们就来学习最常使用的两个命令:perf record 和 perf report。其中,一个用来统计,一个用来展示。
示例
使用下面这个示例程序,来学习 perf record/report 命令的使用。
perftest.c
#include <stdio.h>
#include <math.h>
#include <stdlib.h>
#include <unistd.h>
#include <sys/types.h>
void for_loop()
{
int i, j;
int x;
for (i = 0; i < 1000; i++) {
for (j = 0; j < 10000; j++) {
x = sin(i) + cos(j);
}
}
}
void loop_samll()
{
int i;
for (i = 0; i < 10; i++) {
for_loop();
}
}
void loop_big()
{
int i;
for (i = 0; i < 100; i++) {
for_loop();
}
}
int main(int argc, char *argv[])
{
printf("pid = %d\n", getpid());
loop_big();
loop_samll();
return EXIT_SUCCESS;
}
1
2
3
4
5
6
7
8
9
10
11
12
13
14
15
16
17
18
19
20
21
22
23
24
25
26
27
28
29
30
31
32
33
34
35
36
37
38
39
40
41
42
43
44
45
$ gcc -o perftest.out perftest.c -lm
$ ./perftest.out
pid = 826526
1
2
3
perf record
$ sudo perf record -p 826526 -a -g -F 99 -- sleep 10
Warning:
PID/TID switch overriding SYSTEM
[ perf record: Woken up 1 times to write data ]
[ perf record: Captured and wrote 0.082 MB perf.data (991 samples) ]
1
2
3
4
5
-p:分析指定进程
-a:对所有 CPU 进行采样
-g:启用调用追溯功能
-F:指定采样频率
-- sleep:采集时长
执行这个命令后,会在当前目录下产生一个 perf.data 文件,接下来就可以使用 perf report 命令来分析这份采样记录了。
perf report
$ sudo perf report
1
通过 perf report 命令可以展示采样记录,大概介绍下面板参数
Samples:采样个数
Event count:系统总共发生的事件数
Symbol:函数名,其中 [.] 表示用户空间函数,[k] 表示内核函数
Shared Objec:函数所在的共享库或所在的程序
Command:进程名
Self:该函数的 CPU 使用率
Children:该函数的子函数的 CPU 使用率
那么,通过示例的展示面板,我们能得到的信息如下:
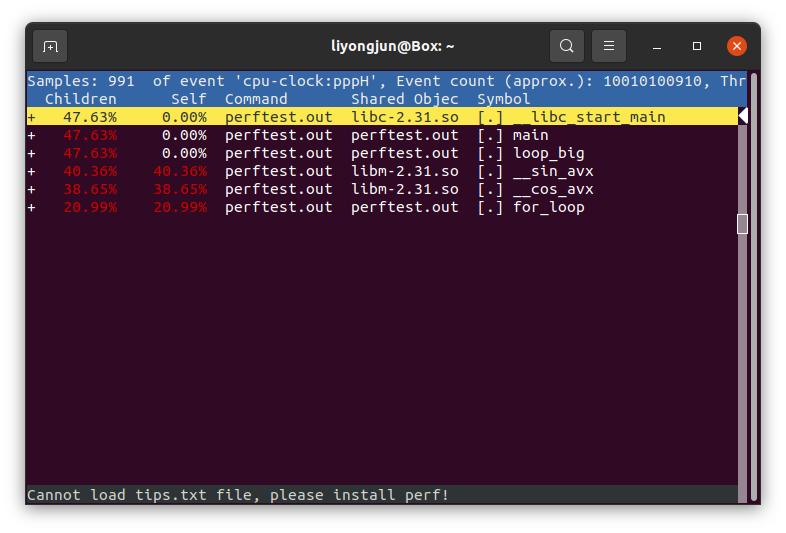
这次采样,是对 perftest.out 这个进程进行采样
总共采集到了 991 个事件(符合 -F 99 -- sleep 10,即,一秒钟采样 99 次,采样 10 秒钟)
第一行:__libc_start_main 函数,处于用户空间,处于共享库 libc-2.31.so 中,CPU 使用率为 0,其子函数的 CPU 使用率为 47.63%。(因为 __libc_start_main 只调用一次,实际使用 CPU 的都是其子函数)
第二行:main 函数同 __libc_start_main
第三行:loop_big 函数同 __libc_start_main
第四行:__sin_avx 函数,自身 CPU 使用率为 40.36%,子函数 CPU 使用率为 40.36%,说明其没有子函数。
第五行:__cos_avx 函数,CPU 使用率为 38.65%
第六行:for_loop 函数,CPU 使用率 20.99%
通过以上分析,可以知道 CPU 大部分时间都花在执行 sin() 和 cos() 这两个函数上,和示例代码吻合。
以上分析中,有些参数还没理解透彻,后面还会继续对 perf 工具进行学习,逐步增强吧。
原文链接:https://blog.csdn.net/lyndon_li/article/details/127472703

 浙公网安备 33010602011771号