Debugging in VSCode & PyCharm
VScode官方channel是学习best practice的最佳之处
https://www.youtube.com/@code/playlists
GDB is REALLY easy! Find Bugs in Your Code with Only A Few Commands
https://www.youtube.com/watch?v=Dq8l1_-QgAc
Timestamps
Intro 0:00
gcc -o main main.c -s
file main
wc -c main
./main
Compiling Code for GDB 0:20
Starting GDB 1:27
gcc -o main main.c -g
gdb ./main
lay next
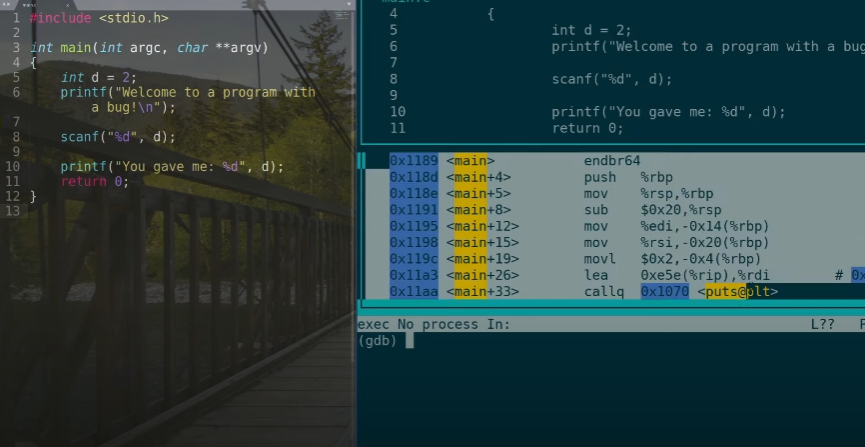
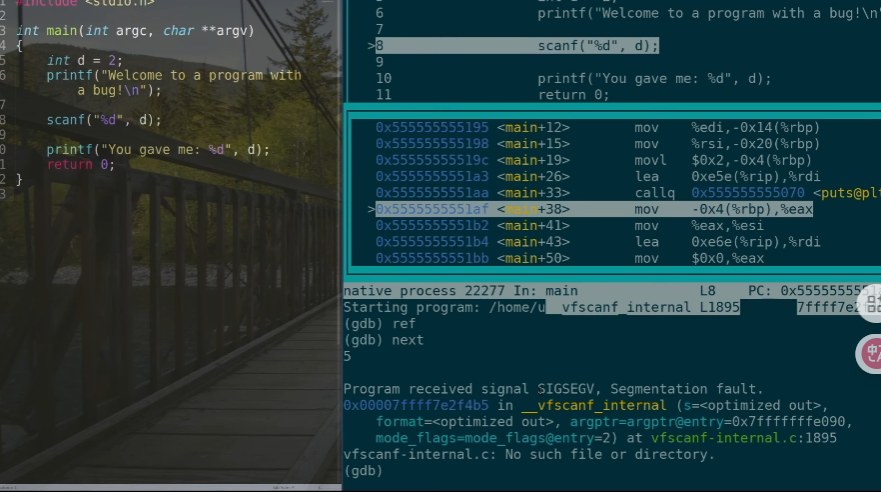
Breakpoints 2:05
(gdb)
break main
run
next
nexti
nexti
next
ref
next
5
C Step vs ASM Step 2:37
Step Over vs Step In 3:26
Finding the Bug 4:26
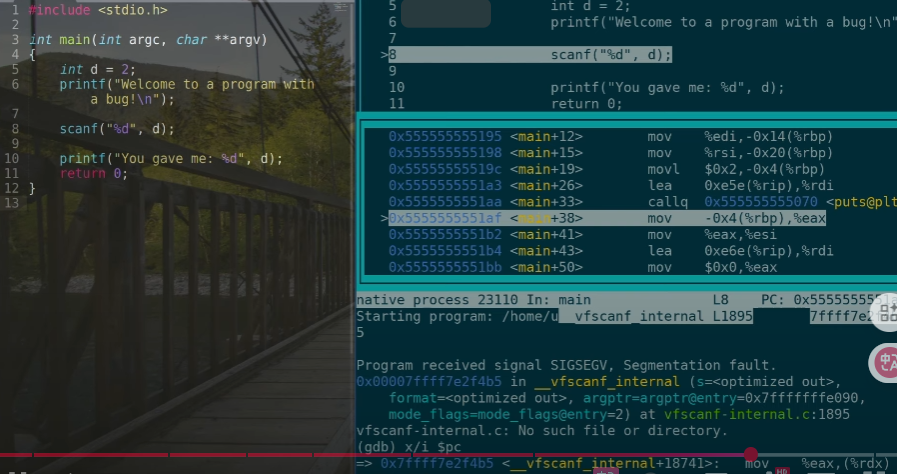
info registers
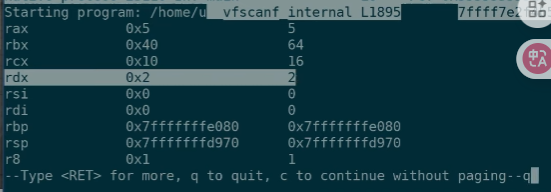
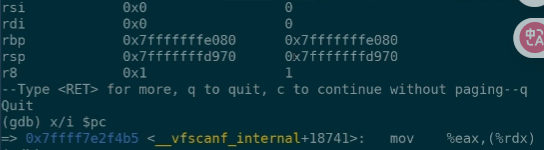
所以问题出在scanf里,point指的位置有问题
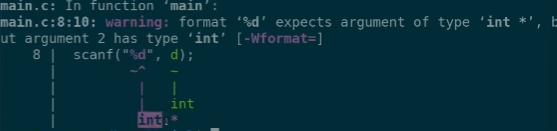
就是需要取地址&嘛
Outro 7:16
Getting Started with Debugging in VS Code (Official Beginner Guide)
https://www.youtube.com/watch?v=3HiLLByBWkg
官方的教程非常好!主要是js的教程,但是很详细每个功能都有讲到
00:00 GitHub Insider Newsletter
00:22 Debugging in VS Code
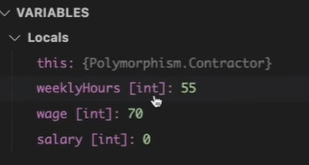
01:11 Variables
Displays the variables in the current debugging scope,including their types and values.
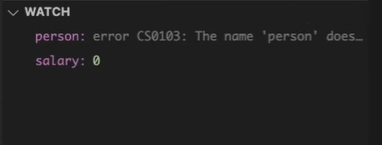
01:21 Watch
Allows you to track the values of specific expresssions or variables you're interested in throughout the debugging session.
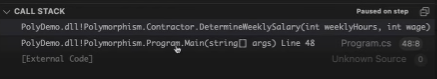
01:30 Call Stack
Shows the hierarchy of function calls at the current moment in the execution, indicating the path the program took to reach the current point.
01:38 Loaded Scripts
Lists all the scripts that have been loaded into the current debugging session,useful for navigating to different parts of your code or libraries being used.
01:49 Debug Tool Bar
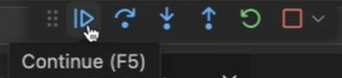
Continue(F5) continue to the next break point
Step Over(F10) come to a method, do not want to jump into that method
Step Into(F11) step into a method
Step Out(Shift + F11)
Restart(Ctrl + Shift + F5)
Stop(Shift + F5)
02:29 Polymorphism Demo
06:10 CRUD App Demo
09:12 Edit mode
10:35 Debug in Microsoft Edge
这里有一个条件break point
12:09 Learn more
12:30 Want more on Debugging? Drop a "Part 2" in the comments!
Navigate your code more quickly with the outline view!

看了三个youtube短视频,就这个最深入,之前的太基础,不过也有一个讲到debug到web app的

 浙公网安备 33010602011771号