机器学习-svd实现人脸识别
加载sklearn中的人脸数据集
from sklearn.datasets import fetch_lfw_people
faces = fetch_lfw_people()
执行上面的第二行程序,python会从网上下载labeled_face_wild people数据集,这个数据集大概200M,因为墙的原因下载很慢失败。
使用百度云下载该数据集,是个.tgz的压缩包
把下载好的压缩包放入C:\Users\Tim\scikit_learn_data\lfw_home,其中yyy是我的用户名,再次运行faces = fetch_lfw_people(),成功,jupyter notebook中的输出如下:
from sklearn.datasets import fetch_lfw_people
faces = fetch_lfw_people(min_faces_per_person=60)
print(faces.target_names)
print(faces.images.shape)
['Donald Rumsfeld' 'George W Bush' 'Gerhard Schroeder' 'Junichiro Koizumi'
 'Tony Blair']
(964, 62, 47)
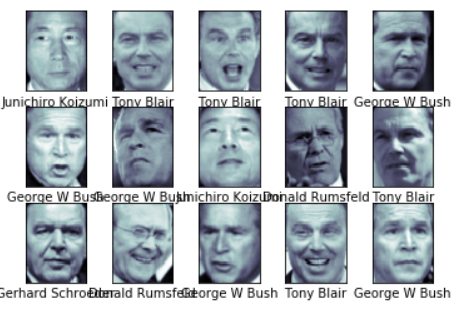
# 进行完上一步还可以看一下图片长什么样子
import matplotlib.pyplot as plt
%matplotlib inline
fig, ax = plt.subplots(3, 5)
for i, axi in enumerate(ax.flat):
    axi.imshow(faces.images[i], cmap='bone')
    axi.set(xticks=[], yticks=[],
            xlabel=faces.target_names[faces.target[i]])
解决人脸识别(jupyter)
人脸识别是一个分类问题,因为机器学习中svd属于王霸地位(深度学习不算),所以使用svd对图像进行训练。
# svc 支持向量解决分类问题
from sklearn.svm import SVC
# 图片的维度太高,降维
from sklearn.decomposition import PCA
# 管道
from sklearn.pipeline import make_pipeline

pca = PCA(n_components=150, whiten=True, random_state=42)
svc = SVC(kernel='rbf', class_weight='balanced')
model = make_pipeline(pca, svc)
和上一步一样看看我们数据的同时加载数据
from sklearn.datasets import fetch_lfw_people
faces = fetch_lfw_people(min_faces_per_person=60)
print(faces.target_names)
print(faces.images.shape)
import matplotlib.pyplot as plt
%matplotlib inline
fig, ax = plt.subplots(3, 5)
for i, axi in enumerate(ax.flat):
    axi.imshow(faces.images[i], cmap='bone')
    axi.set(xticks=[], yticks=[],
            xlabel=faces.target_names[faces.target[i]])
切分训练集和测试集
from sklearn.model_selection import train_test_split
Xtrain, Xtest, ytrain, ytest = train_test_split(faces.data, faces.target,
                                                random_state=40)
# 进行训练
from sklearn.model_selection import GridSearchCV
param_grid = {'svc__C': [1, 5, 10],
              'svc__gamma': [0.0001, 0.0005, 0.001]}
grid = GridSearchCV(model, param_grid)

%time grid.fit(Xtrain, ytrain)
GridSearchCV(cv='warn', error_score='raise-deprecating',
             estimator=Pipeline(memory=None,
                                steps=[('pca',
                                        PCA(copy=True, iterated_power='auto',
                                            n_components=150, random_state=42,
                                            svd_solver='auto', tol=0.0,
                                            whiten=True)),
                                       ('svc',
                                        SVC(C=1.0, cache_size=200,
                                            class_weight='balanced', coef0=0.0,
                                            decision_function_shape='ovr',
                                            degree=3, gamma='auto_deprecated',
                                            kernel='rbf', max_iter=-1,
                                            probability=False,
                                            random_state=None, shrinking=True,
                                            tol=0.001, verbose=False))],
                                verbose=False),
             iid='warn', n_jobs=None,
             param_grid={'svc__C': [1, 5, 10],
                         'svc__gamma': [0.0001, 0.0005, 0.001]},
             pre_dispatch='2*n_jobs', refit=True, return_train_score=False,
             scoring=None, verbose=0)
print(grid.best_params_)
{'svc__C': 10, 'svc__gamma': 0.0001}
查看测试集的测试结果
model = grid.best_estimator_
yfit = model.predict(Xtest)
yfit.shape
import matplotlib as mpl
# 防止中文报错
mpl.rcParams["font.sans-serif"] = ["SimHei"]
mpl.rcParams["axes.unicode_minus"] = False
# 画图
fig, ax = plt.subplots(4, 6)
for i, axi in enumerate(ax.flat):
    # 调整像素为[62,47]
    axi.imshow(Xtest[i].reshape(62, 47), cmap='bone')
    axi.set(xticks=[], yticks=[])
    # 截取目标名字的最后一组字
    axi.set_ylabel(faces.target_names[yfit[i]].split()[-1],
                   color='black' if yfit[i] == ytest[i] else 'red')
fig.suptitle('预测错误的名字被红色标注', size=14);
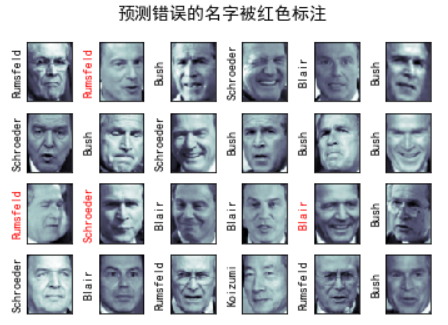
可以看到预测错误了四个,准确率欠佳,下面打印分类报告
from sklearn.metrics import classification_report
print(classification_report(ytest, yfit,
                            target_names=faces.target_names))
                   precision    recall  f1-score   support

  Donald Rumsfeld       0.75      0.87      0.81        31
    George W Bush       0.97      0.92      0.94       124
Gerhard Schroeder       0.80      0.83      0.81        29
Junichiro Koizumi       1.00      1.00      1.00        16
       Tony Blair       0.85      0.85      0.85        41

         accuracy                           0.90       241
        macro avg       0.87      0.89      0.88       241
     weighted avg       0.90      0.90      0.90       241
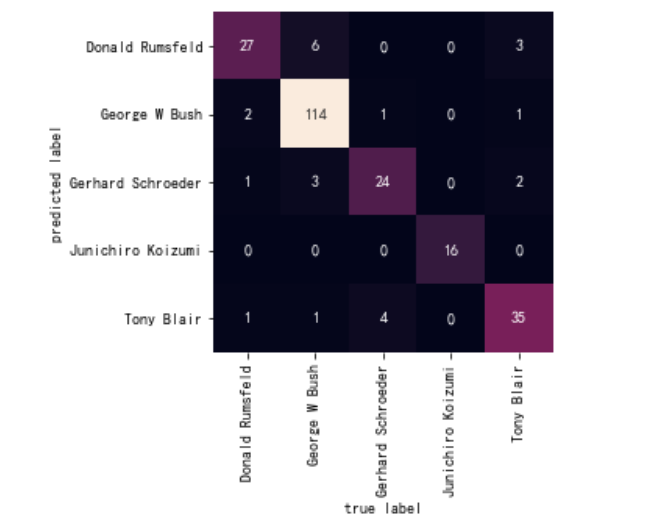
最后使用seaborn的heatmap打印混淆矩阵
import seaborn as sns
from sklearn.metrics import confusion_matrix
# 混淆矩阵
mat = confusion_matrix(ytest, yfit)
# 注意这里的混淆矩阵的画图
sns.heatmap(mat.T, square=True, annot=True, fmt='d', cbar=False,
            xticklabels=faces.target_names,
            yticklabels=faces.target_names)
plt.xlabel('true label')
plt.ylabel('predicted label');
对于svd不懂得可以转头看一下,svm原理

 浙公网安备 33010602011771号