1 ) Prometheus Server 端安装
# 1.1 ) Promethrus Server 端下载:
cd /data/src/
wget https://github.com/prometheus/prometheus/releases/download/v2.23.0/prometheus-2.23.0.linux-amd64.tar.gz
tar -zxf  prometheus-2.23.0.linux-amd64.tar.gz

# 1.2 Prometheus server 部署:
mv prometheus-2.23.0.linux-amd64 /data/soft/
cd /data/soft/
ln -sv /data/soft/prometheus-2.23.0.linux-amd64 /data/soft/prometheus
2 ) 创建 Prometheus 启动脚本:
# 2.1 ) 启动脚本:
vim /etc/systemd/system/prometheus.service

[Unit]
Description=Prometheus Server
Documentation=https:/prometheus.io/docs/introduction/overview/
After=network.target

[Service]
Type=simple
User=work                                      # 此处注意 用户一定要存在并且有proemtheus 目录读写权限,否则用root也可以.
Restart=on-failure
WorkingDirectory=/data/soft/prometheus/        # 注意路径
ExecStart=/data/soft/prometheus/prometheus \
    --config.file=/data/soft/prometheus/prometheus.yml \
    --web.max-connections=3000 \
    --web.external-url "http://${ip}:9090" \                 #  这里要注意没有"=", 空格后面引号+URL +端口即可
    --web.listen-address "0.0.0.0:9090"                      #  这里要注意没有"=", 空格后面引号+URL +端口即可

[Install]
WantedBy=multi-user.target

*** 重点 ***

--web.external-url "http://${ip}:9090"   # 用于生成返回Prometheus 的相对和绝对连接地址,可以在后续告警通知内容中点击连接地址访问Prometheus Web UI
--web.listen-address "0.0.0.0:9090"      # Prometheus 默认监控端口
1 )  注意以上都不带=, 空格即可,否则启动报错.
2 )  启动最好带上这个参数,否则alertmanager 发出来的报警邮件source 这个参数会连接到服务器的主机名,这个参数可以修改连接直接到服务器域名上.注意后面端口9090
3 ) 启动prometheus服务:
# 3.1 ) 启动Prometheus server:

 systemctl daemon-reload
 systemctl restart prometheus
 systemctl enable prometheus
4 ) 验证是否启动:
# 4.1 ) 检查端口(9090):
ss -tunkpa | grep 9090 or lsof -i: 9090
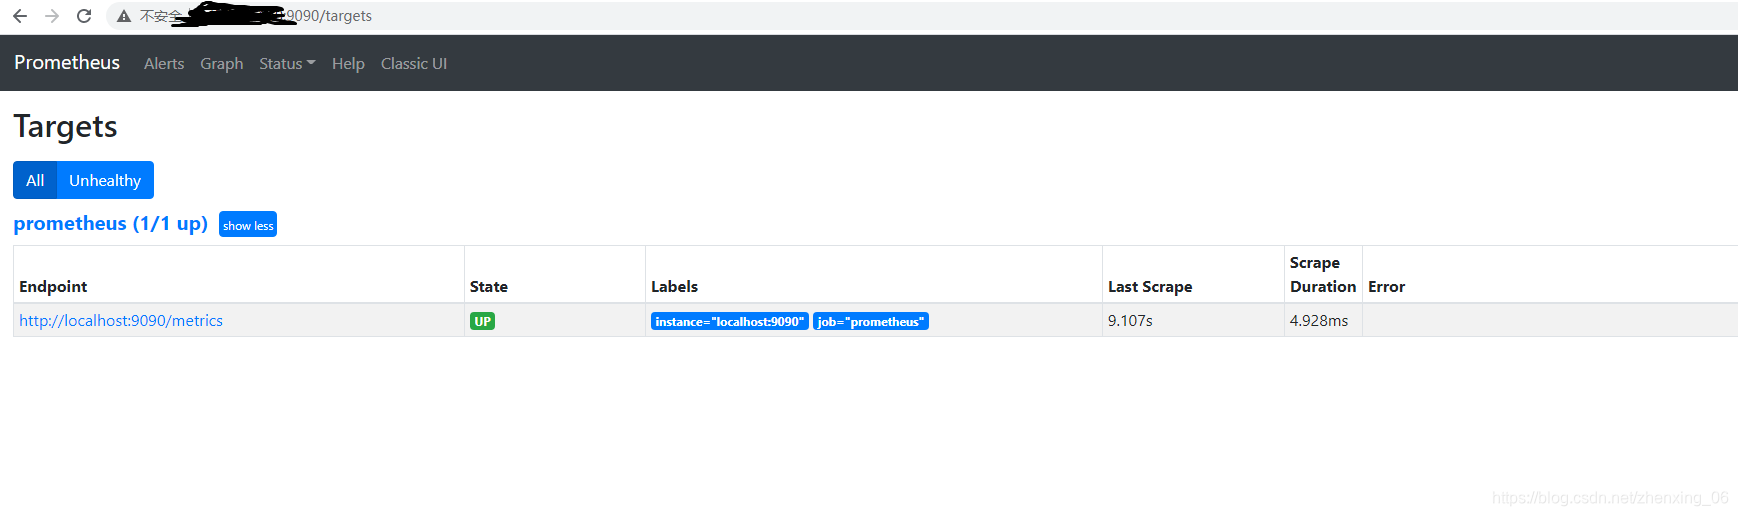
# 4.2 ) 访问Prometheus Web页面:
http://IP:9090/ #如果安装成功界面就会出来
![image]()
5 ) Prometheus 配置文件:
......
scrape_configs:
  - job_name: 'prometheus'
    static_configs:
    - targets: ['localhost:9090','10.0.2.4:9100','10.0.2.5:9100','10.0.2.10:9100']

  - job_name: 'redis_exporter'
    static_configs:
    - targets: ['10.0.2.8:9121']
      labels:
        operator: 'Azure'
        area: "中国北部2"
        env: 'Test'
6 ) 安装 Prometheus client (node_exporter):
# 6.1 ) 下载并安装node_exporter:
cd /data/src/
wget https://github.com/prometheus/node_exporter/releases/download/v1.0.1/node_exporter-1.0.1.linux-amd64.tar.gz
tar -zxf node_exporter-1.0.1.linux-amd64.tar.gz && mv node_exporter-1.0.1.linux-amd64 /data/soft/
ln -sv /data/soft/node_exporter-1.0.1.linux-amd64 /data/soft/node_exporter

# 6.2 ) 添加运行用户:
groupadd -g 1010 work
useradd -g 1010 -u 1010 work -s /sbin/nologin
echo "qwe123" | passwd --stdin  work

# 6.3 ) 给目录赋予权限:
chown -R work.work /data/soft/node_exporter-1.0.1.linux-amd64 /data/soft/node_exporter
*** 以上添加用户添加很关键 ***
7 ) node_exporter 启动脚本:
# 7.1 ) node_exporter 启动脚本内容:
    vim /etc/systemd/system/node-exporter.service

[Unit]
Description=Prometheus Node Exporter
After=network.targat

[Service]
Type=simple
User=work                  # 注意用户
Restart=on-failure
WorkingDirectory=/data/soft/node_exporter/   #注意目录
ExecStart=/data/soft/node_exporter/node_exporter

[Install]
WantedBy=multi-user.target
8 ) node_exporter 启动命令:
# 8.1 ) 启动 node_exporter :
   systemctl daemon-reload
   systemctl enable node-exporter
   systemctl start node-exporter
   systemctl status node-exporter
9 ) 验证是否启动:
## 9.1 ) 查看端口是否被占用:
   ss -tunlpa | grep 9100    or lsof -i:9100

## 9.2 ) 访问Node 节点页面:
   http://IP:9100/metrics
10 ) Grafana Web 安装:
主页: https://grafana.com/docs/
# 10.1 ) 下载并安装grafana-7.3.5:
cd /data/src/
wget https://dl.grafana.com/oss/release/grafana-7.3.5.linux-amd64.tar.gz
tar -zxvf grafana-7.3.5.linux-amd64.tar.gz
mv /data/src/grafana-7.3.5 /data/soft/grafana-7.3.5
ln -sv /data/soft/grafana-7.3.5 /data/soft/grafana

cd /data/soft/grafana-7.3.5/conf

# 10.3 ) Grafana 用户添加,如存在请略过这步,直接下一步:
groupadd 1010 work
usreadd -g 1010 -u 1010 work
echo "qwe123" | passwd --stdin  work

chown -R work.work /data/soft/grafana
*** 以上添加用户很关键 ***


# 10.4 ) Grafana 启动命令:
/data/soft/grafana/bin/grafana-server -config=/data/soft/grafana/conf/defaults.ini
11 ) Grafana 启动脚本:
# 11.1 ) node_exporter 启动脚本内容:
   vim /etc/systemd/system/grafana.service

[Unit]
Description=grafane web ui
After=network.targat

[Service]
Type=simple
User=work
Restart=on-failure
WorkingDirectory=/data/soft/grafana/
ExecStart=/data/soft/grafana/bin/grafana-server -config=/data/soft/grafana/conf/defaults.ini

[Install]
WantedBy=multi-user.target
12 ) 启动 Grafana-server :
 # 12.1 ) 启动 Grafana server:
sudo systemctl daemon-reload
sudo systemctl start grafana.server
sudo systemctl status grafana.server
![image]()

 浙公网安备 33010602011771号