

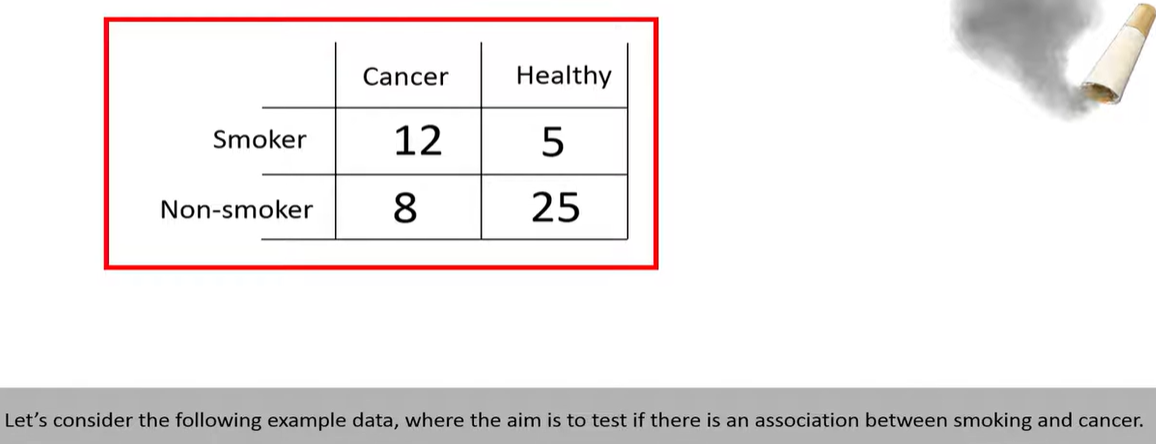
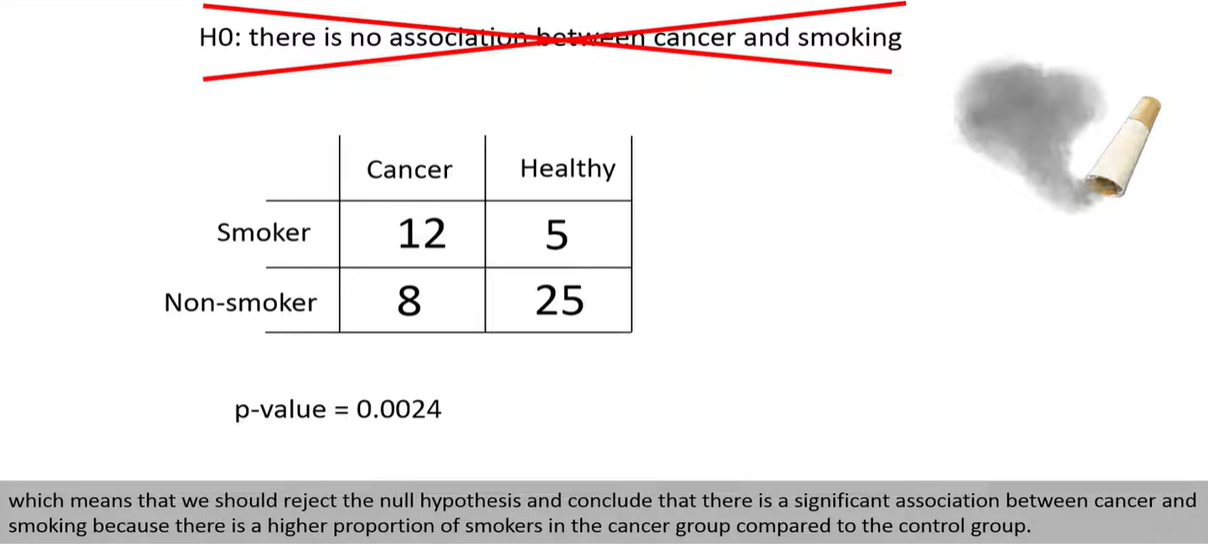
Fisher's Exact Test is a statistical significance test used to determine whether there is a nonrandom association between two categorical variables, typically organized in a 2×2 contingency table.
✅ When to Use Fisher’s Exact Test:
-
When sample sizes are small
-
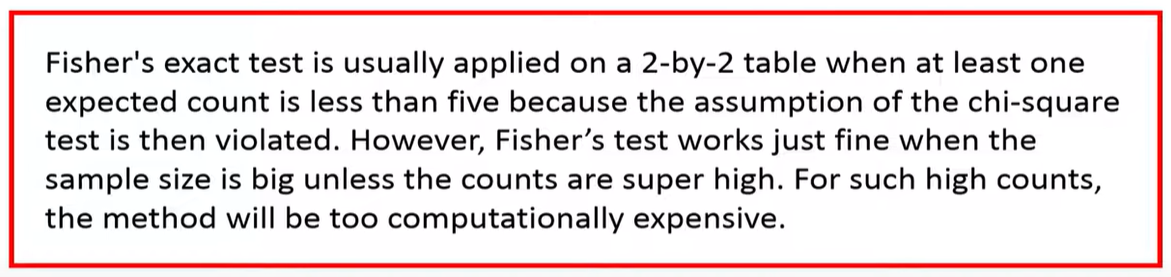
When expected frequencies in any cell of a contingency table are less than 5
-
As an alternative to the Chi-Square test when its assumptions are violated
📊 Example: 2×2 Contingency Table
| Success | Failure | Total | |
|---|---|---|---|
| Group A | a | b | a + b |
| Group B | c | d | c + d |
| Total | a + c | b + d | n |
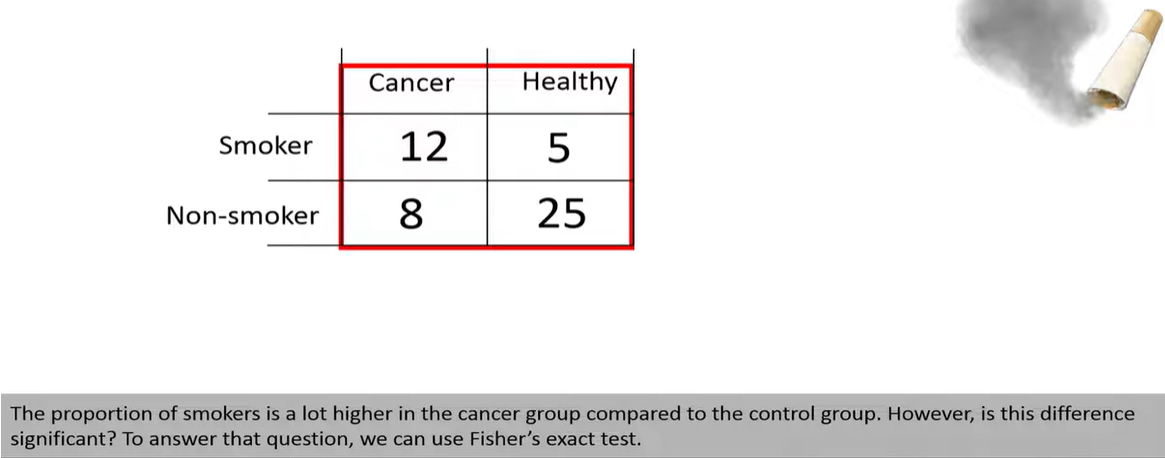
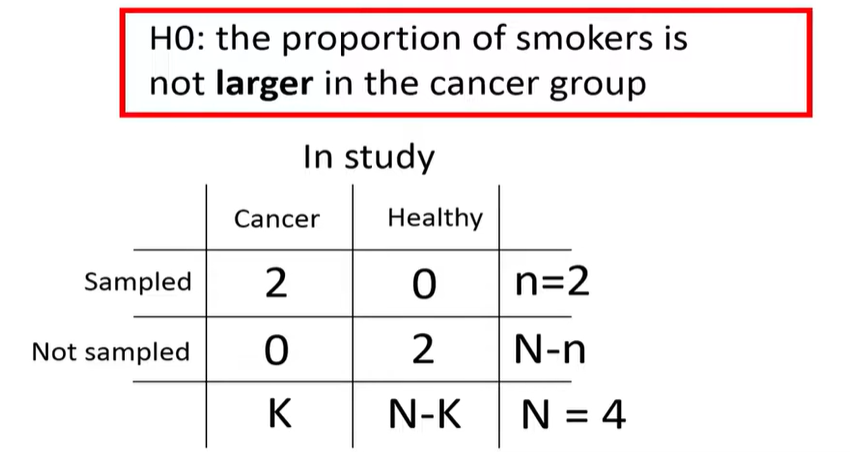
Fisher's Exact Test asks:
Are the row and column variables independent?
🧮 How It Works
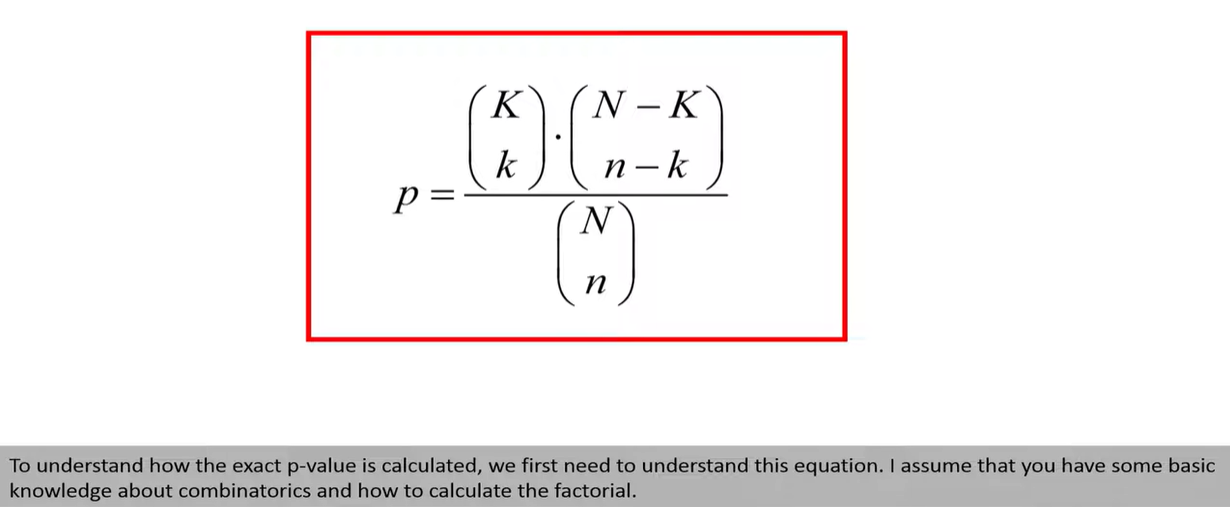
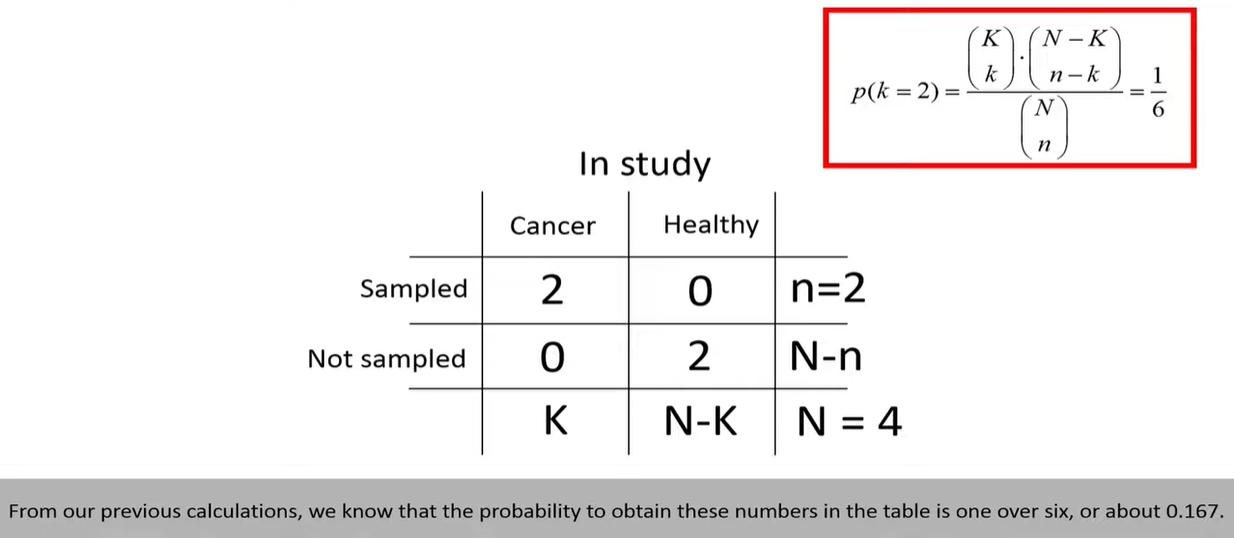
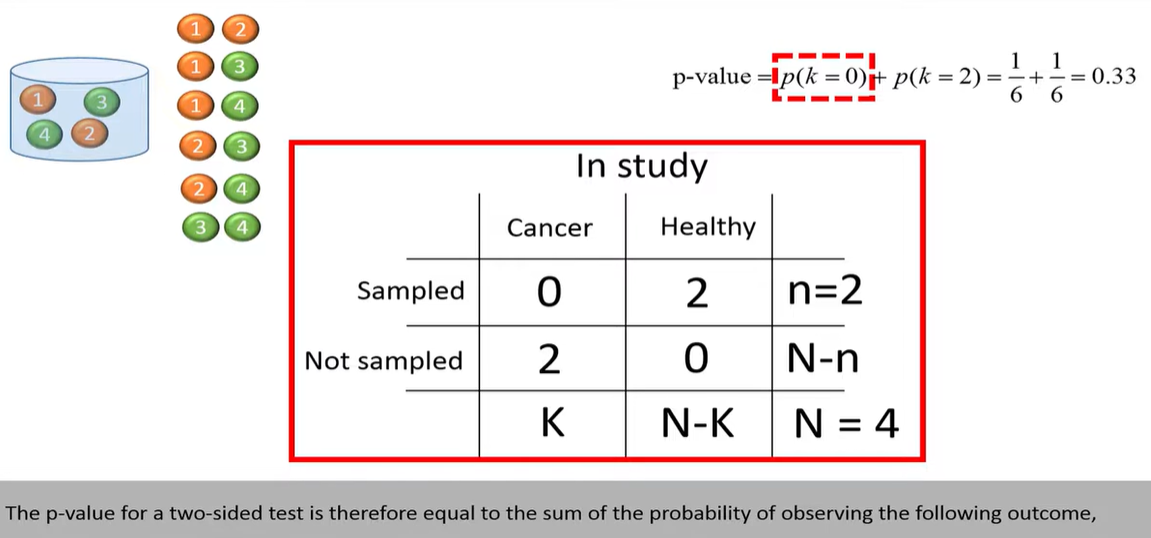
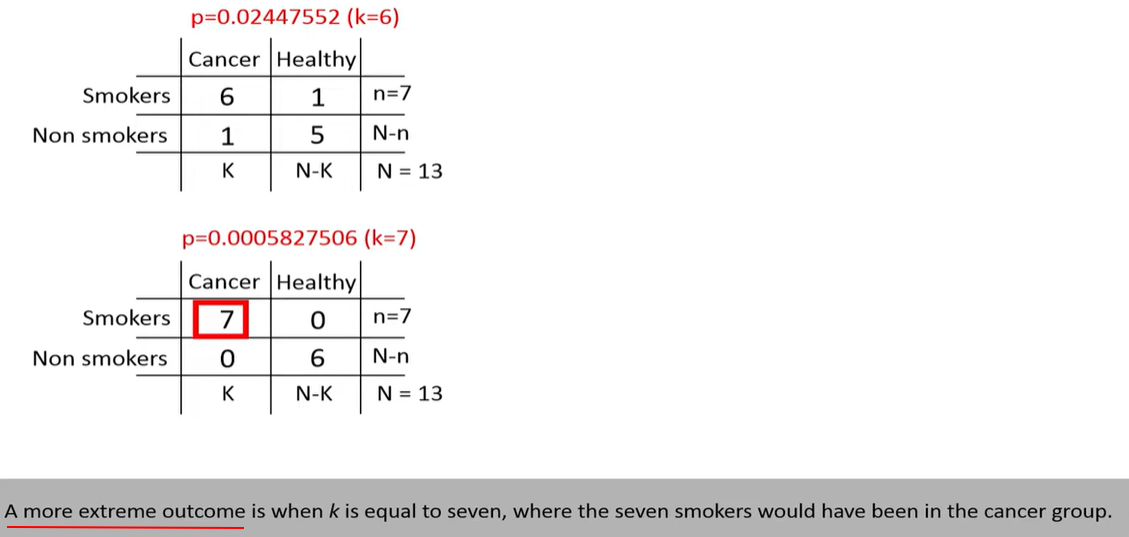
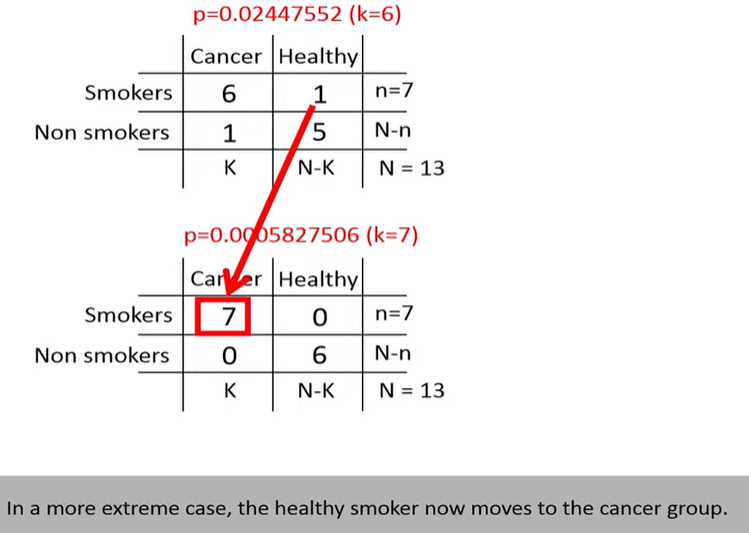
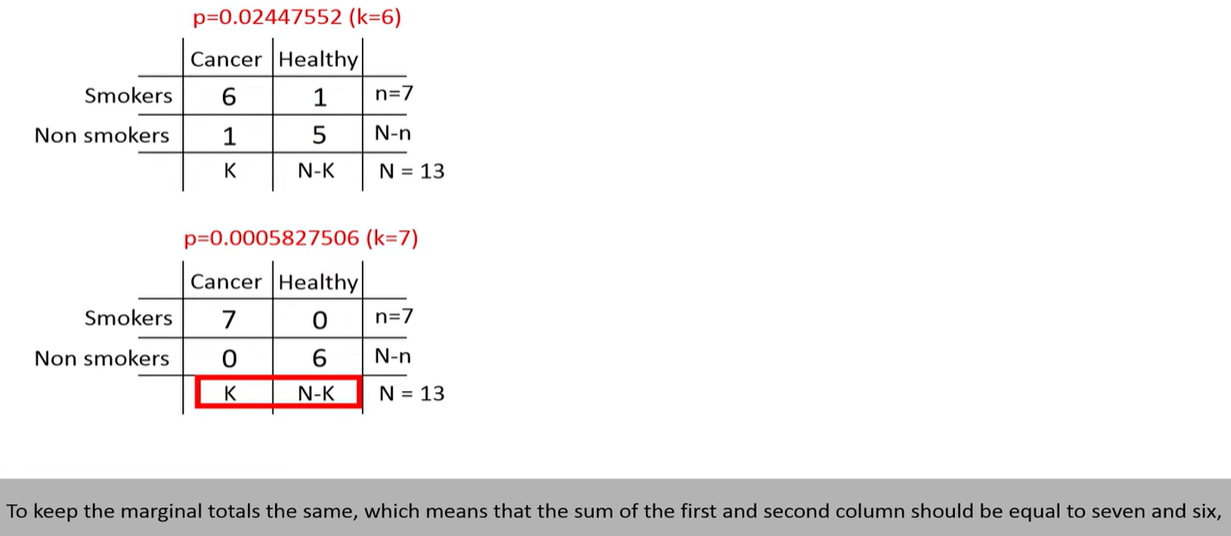
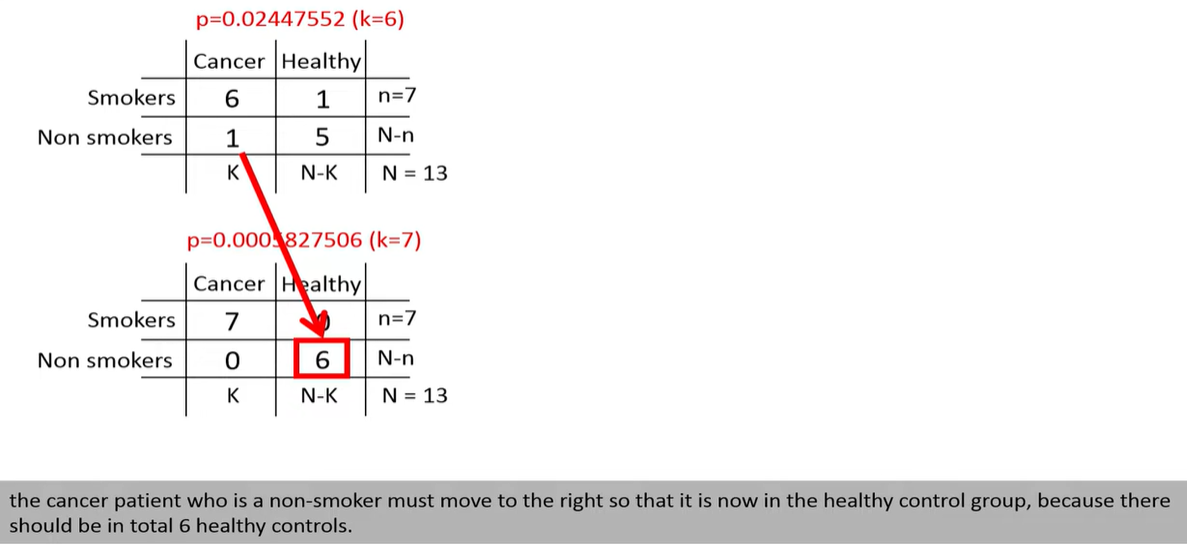
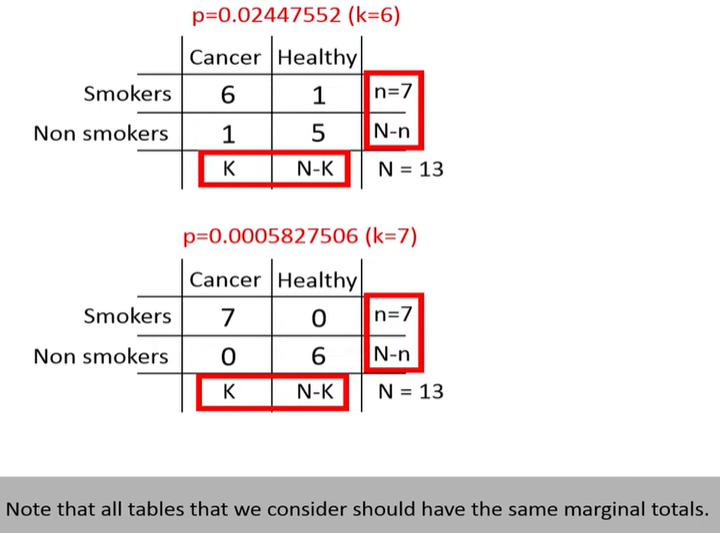
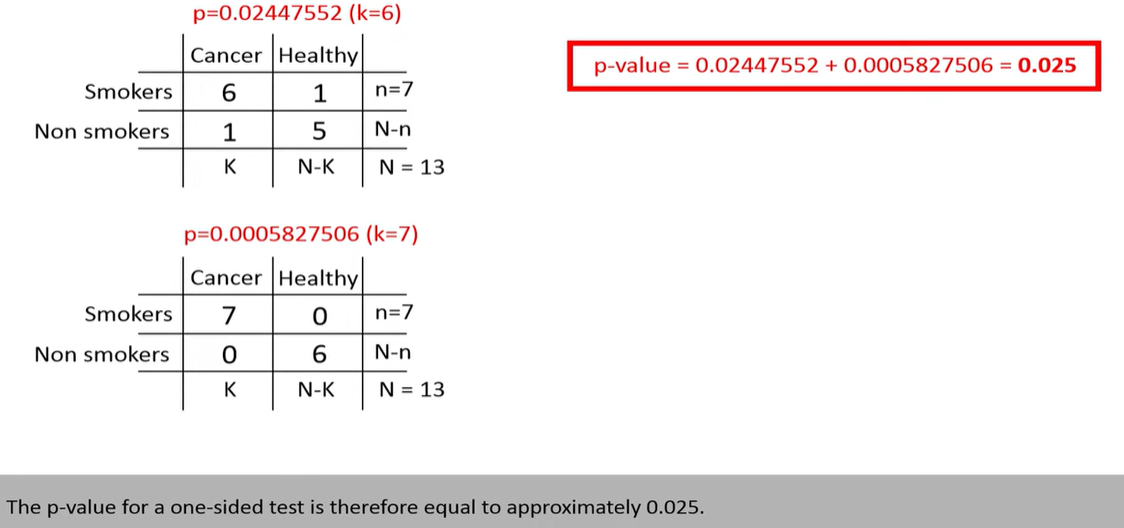
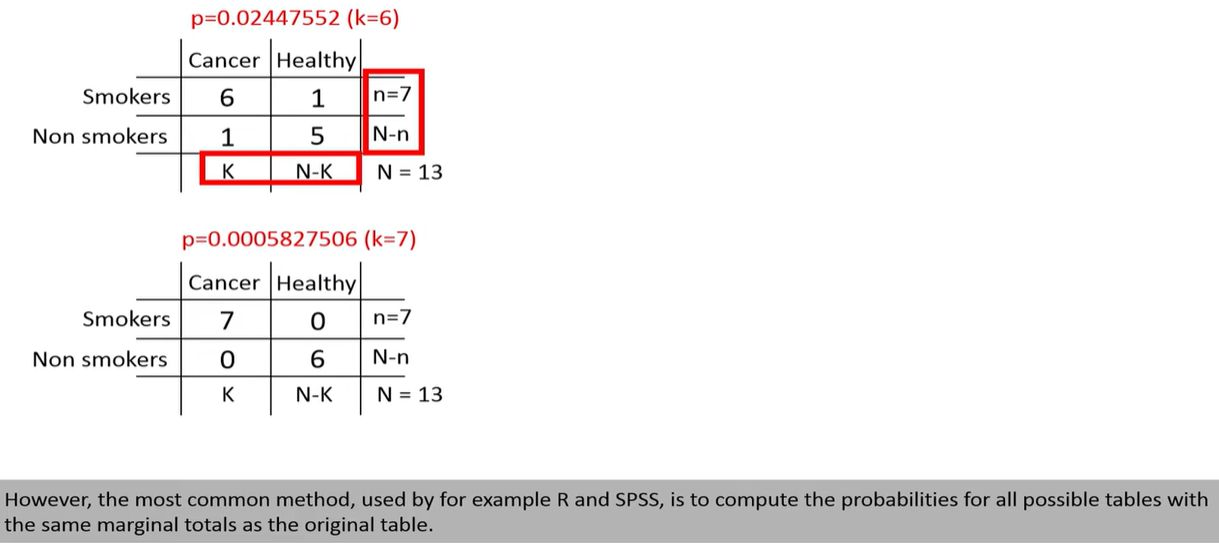
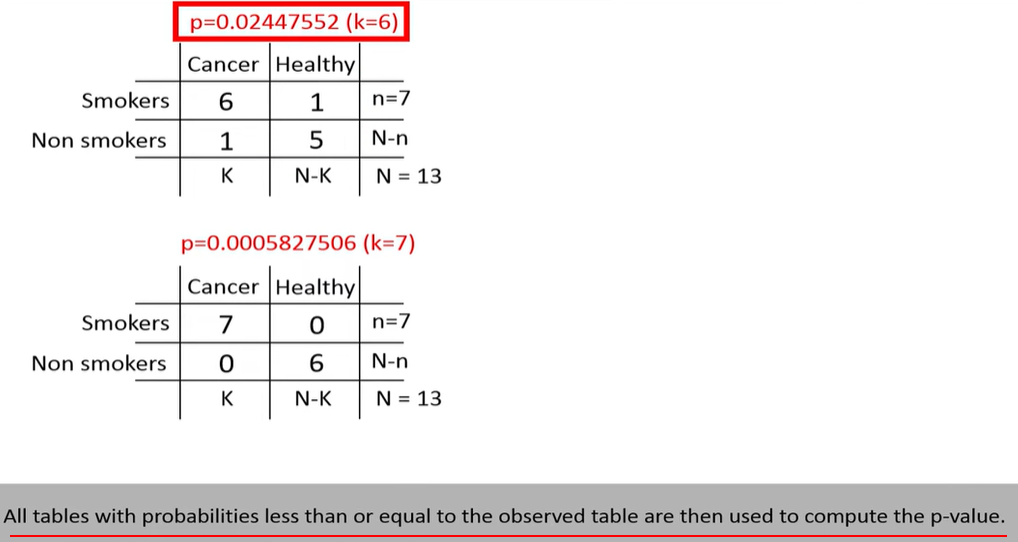
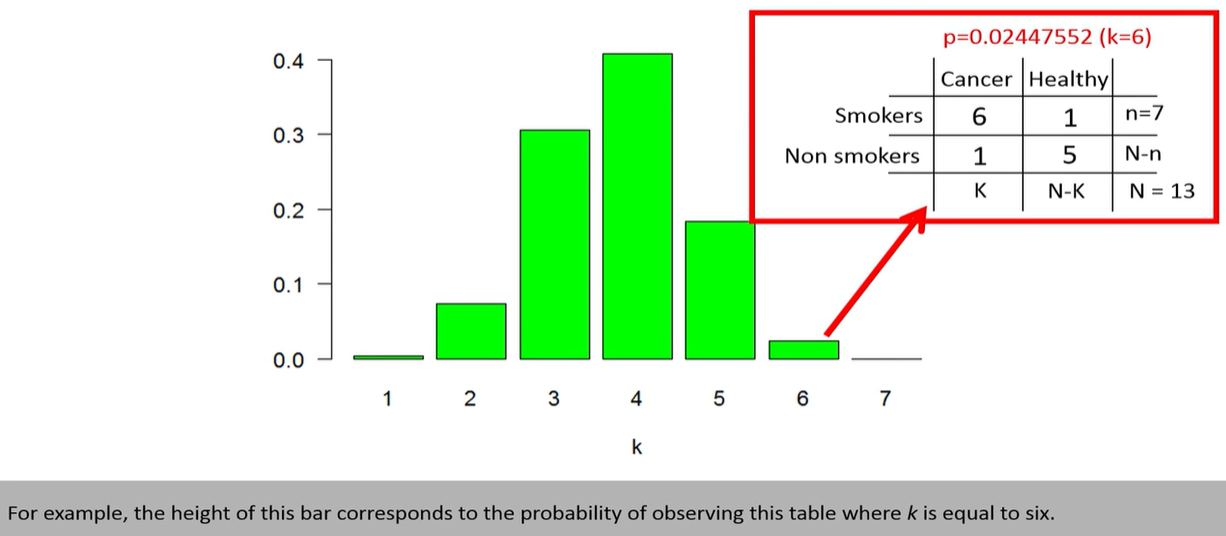
Fisher’s test computes the exact probability of observing a table as extreme as the one you have (or more extreme), assuming that the row and column totals (margins) are fixed.
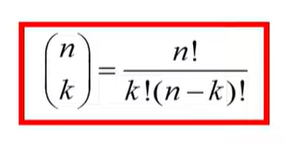
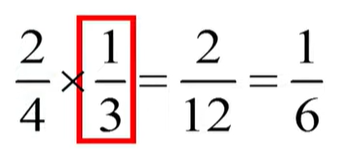
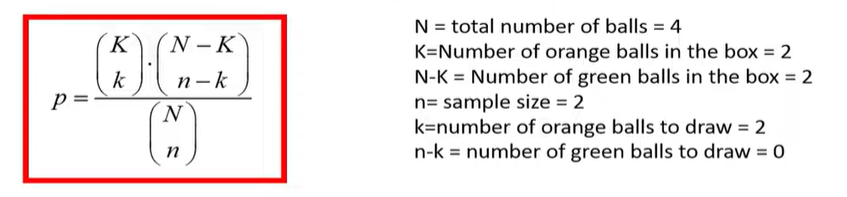
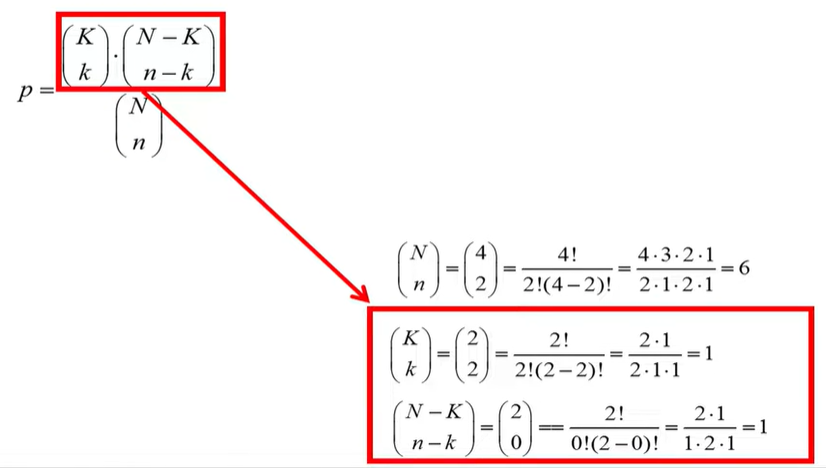
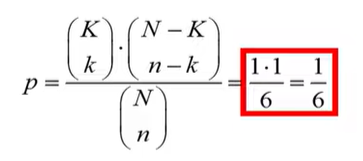
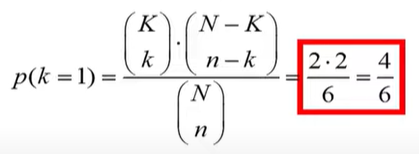
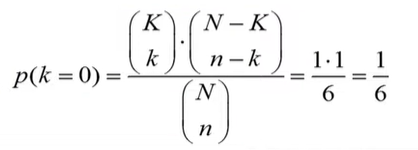
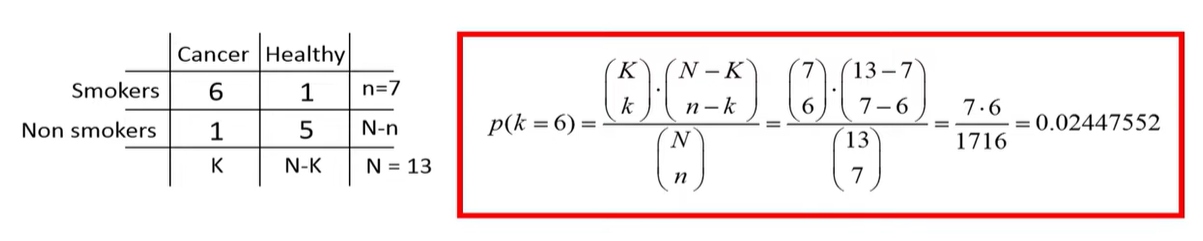
Formula (hypergeometric probability):
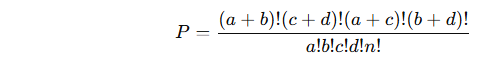
Where n=a+b+c+d is the total number of observations.
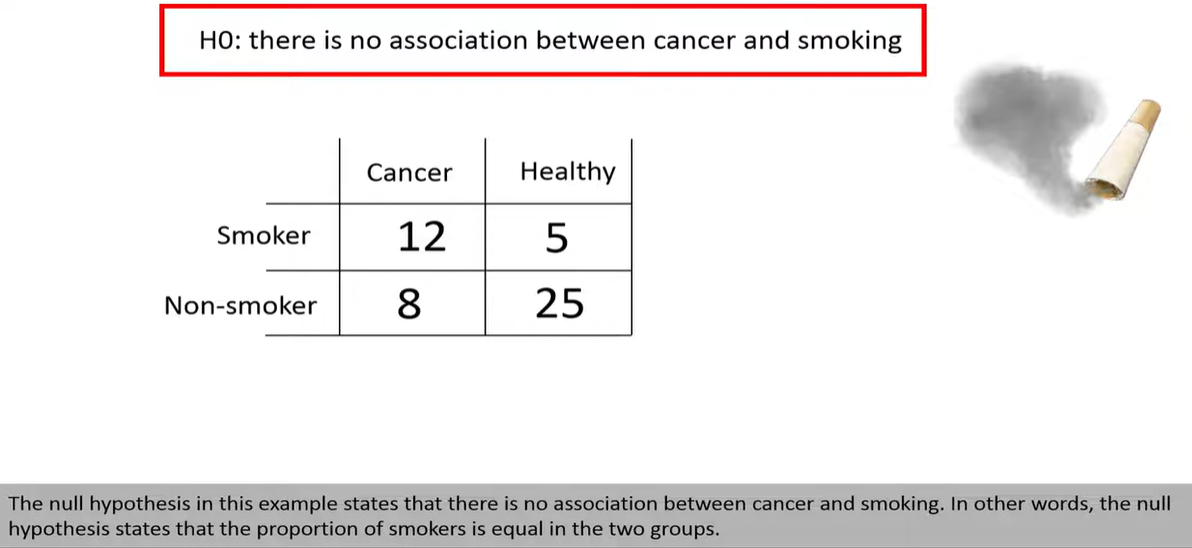
This gives the probability of observing the current table under the null hypothesis of independence.
🎯 One-sided vs Two-sided p-values:
-
One-sided: Tests whether one group has significantly more successes than the other
-
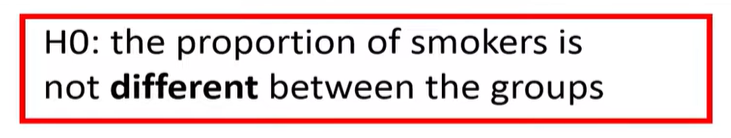
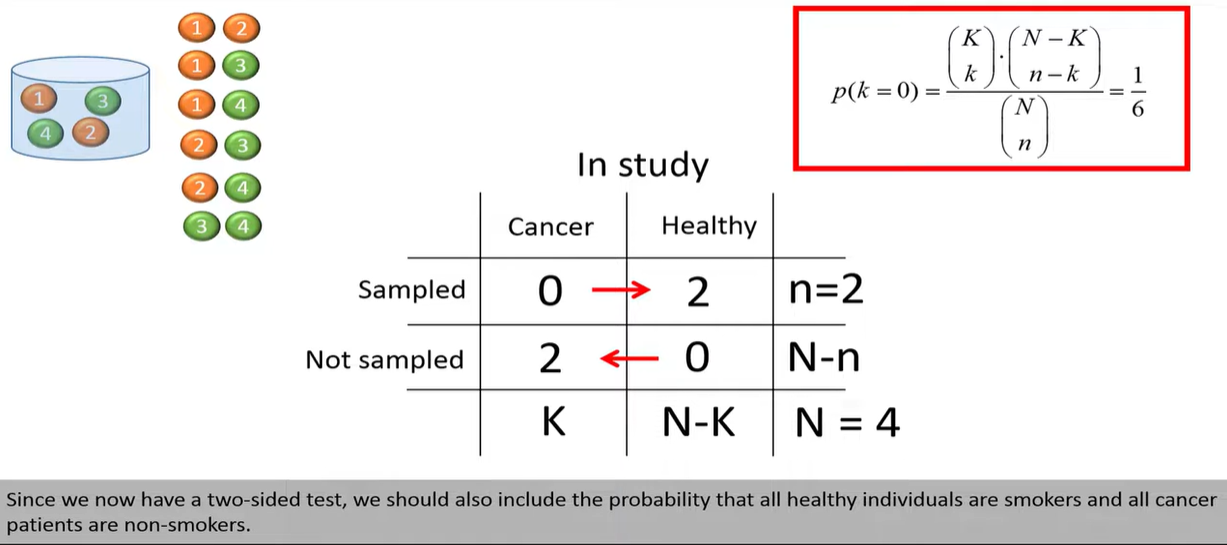
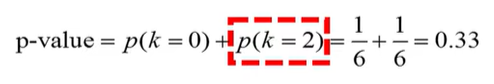
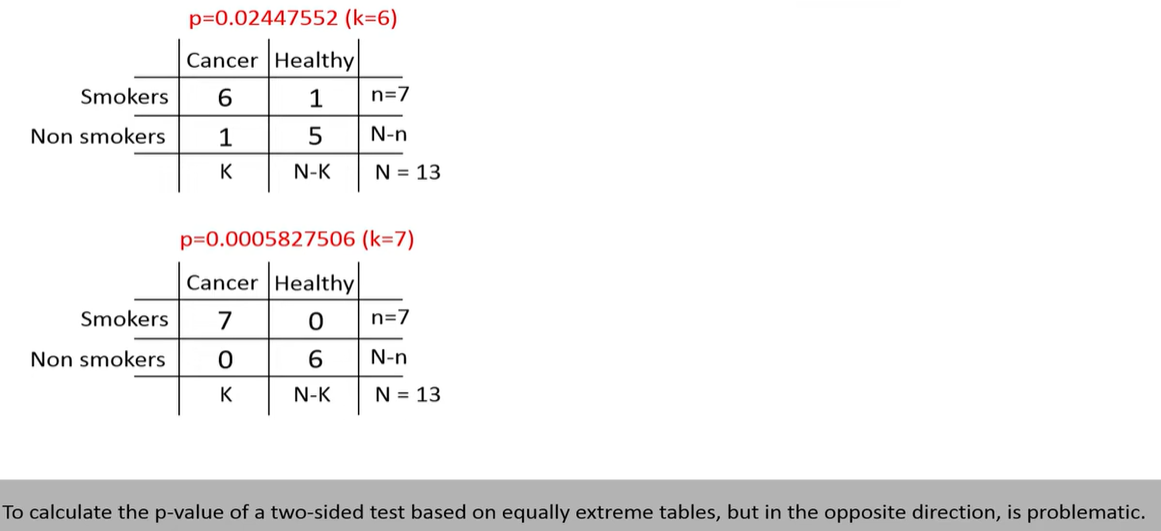
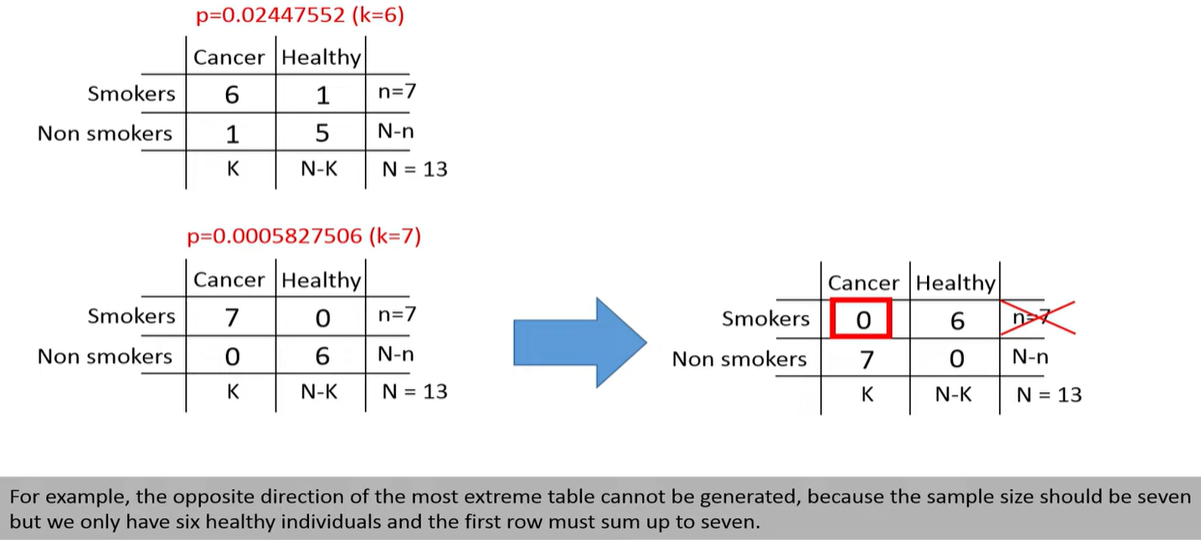
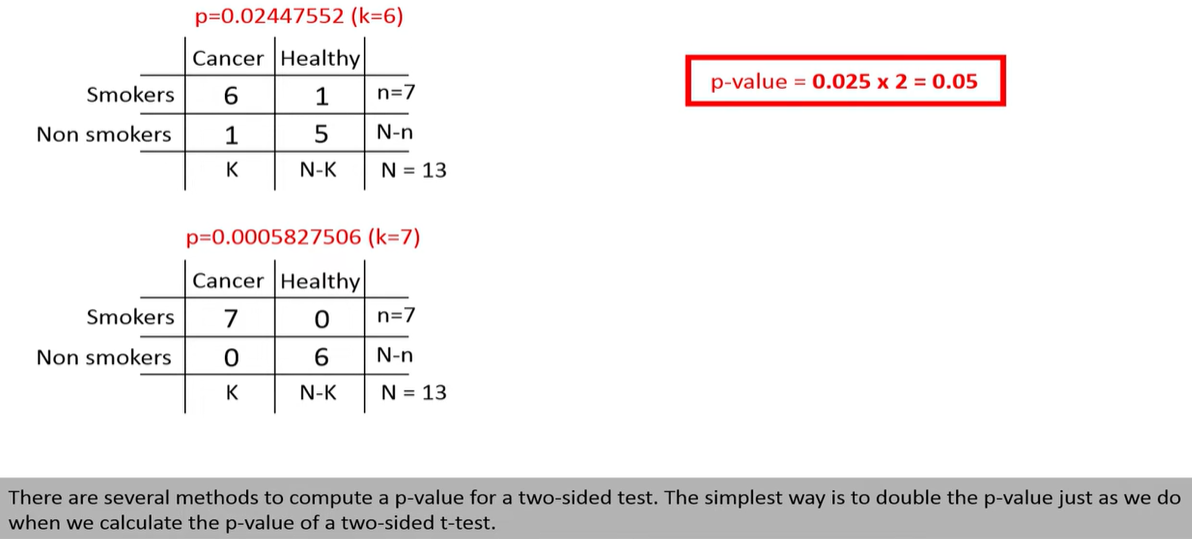
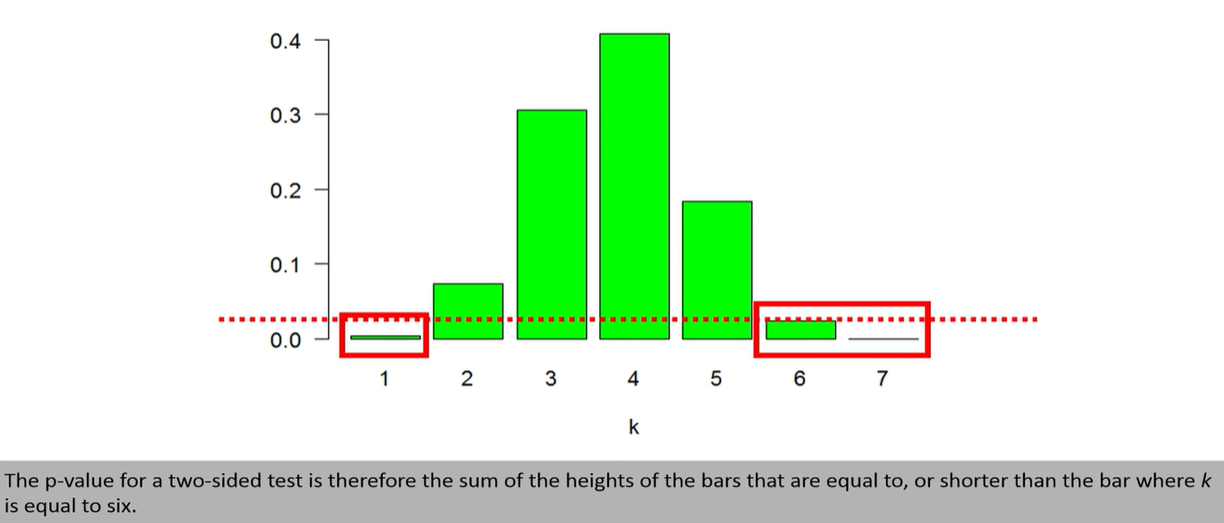
Two-sided: Tests whether there's any significant difference in proportions (higher or lower)
🔧 When is it used?
Fisher's Exact Test is widely used in:
-
Clinical trials
-
Biomedical studies
-
A/B testing with small data
-
Any 2×2 categorical test when data are sparse
✅ Summary
| Feature | Fisher's Exact Test |
|---|---|
| Data type | Categorical (2×2 contingency table) |
| Sample size | Works best for small samples |
| Assumptions | Fixed margins, categorical data |
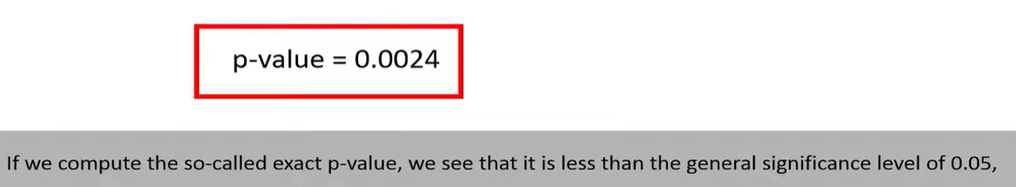
| Output | Exact p-value |
| Alternative to | Chi-square test when assumptions are not met |
✅ Step-by-Step Example
Suppose you have the following 2×2 contingency table:
| Success | Failure | |
|---|---|---|
| Group A | 8 | 2 |
| Group B | 1 | 5 |
You want to know if the success rate is significantly different between the two groups.
from scipy.stats import fisher_exact

# Define the 2×2 contingency table
table = [[8, 2],
         [1, 5]]

# Perform Fisher's Exact Test
oddsratio, p_value = fisher_exact(table, alternative='two-sided')

print("Odds Ratio:", oddsratio)
print("P-value:", p_value)
🔧 alternative options:
-
'two-sided'(default): tests for any association -
'less': tests if Group A has lower odds than Group B -
'greater': tests if Group A has higher odds than Group B
🧾 Output (for this example):
Odds Ratio: 20.0
P-value: 0.034965
The odds ratio (OR) is a measure used in statistics to quantify the strength of the association between two events, typically in the context of a 2×2 contingency table. It's commonly used in fields like epidemiology, medicine, and social sciences to compare the odds of an outcome occurring in one group to the odds of it occurring in another.
🔢 Formula
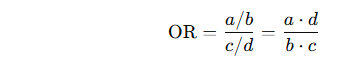
Given a 2×2 table:
| Outcome Present | Outcome Absent | |
|---|---|---|
| Group 1 | a | b |
| Group 2 | c | d |
The odds ratio (OR) is calculated as:
🔍 Interpretation
-
OR = 1: No association (odds are the same in both groups).
-
OR > 1: Positive association (the event is more likely in Group 1).
-
OR < 1: Negative association (the event is less likely in Group 1).
📌 Example
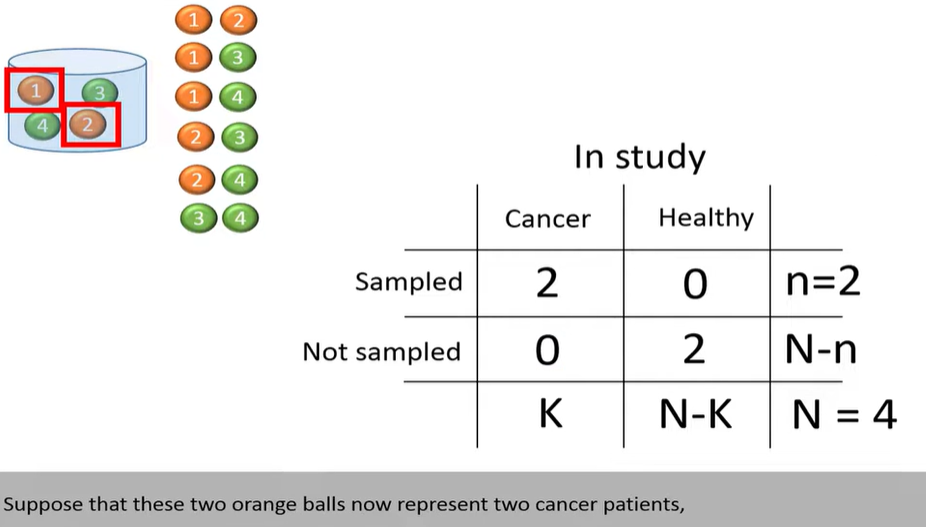
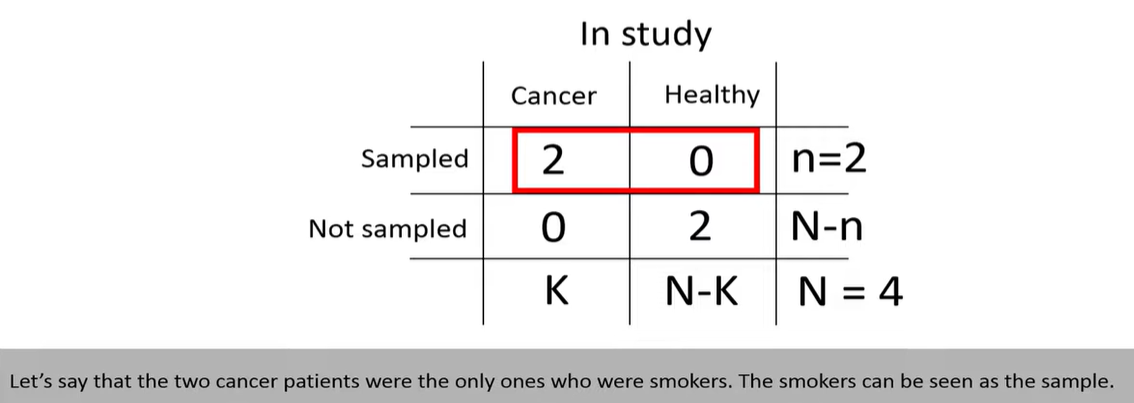
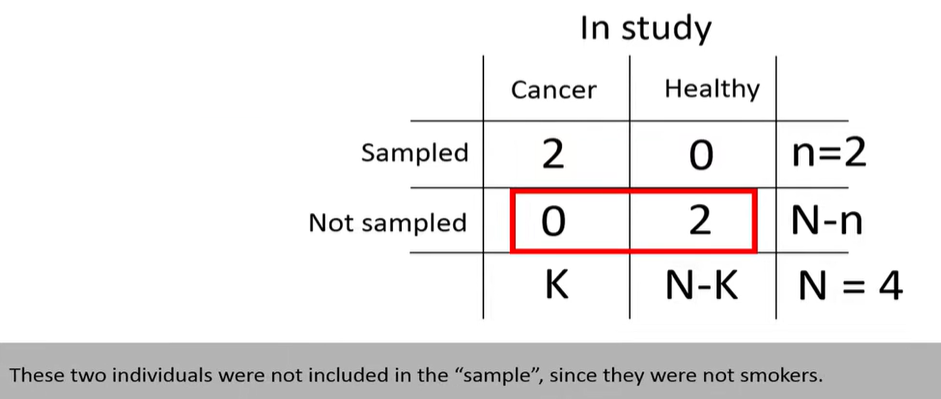
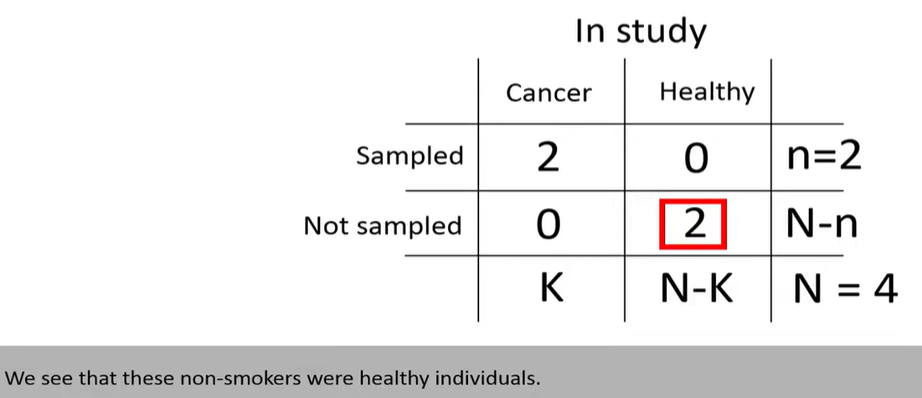
Suppose you're studying whether smoking is associated with lung cancer:
| Lung Cancer | No Lung Cancer | |
|---|---|---|
| Smokers | 90 | 110 |
| Non-Smokers | 30 | 270 |
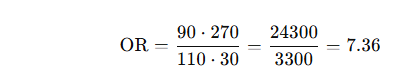
Interpretation: Smokers have about 7.36 times the odds of developing lung cancer compared to non-smokers.


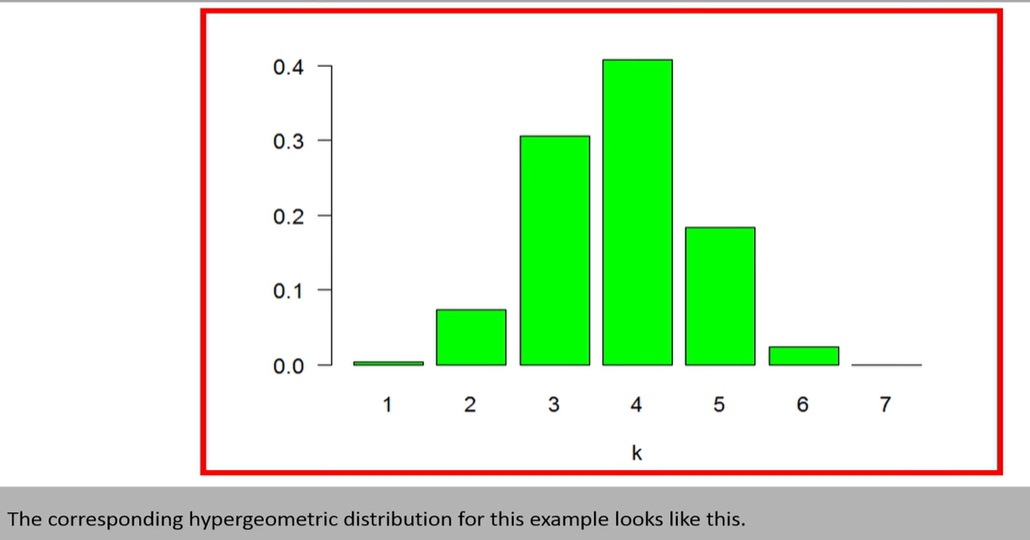
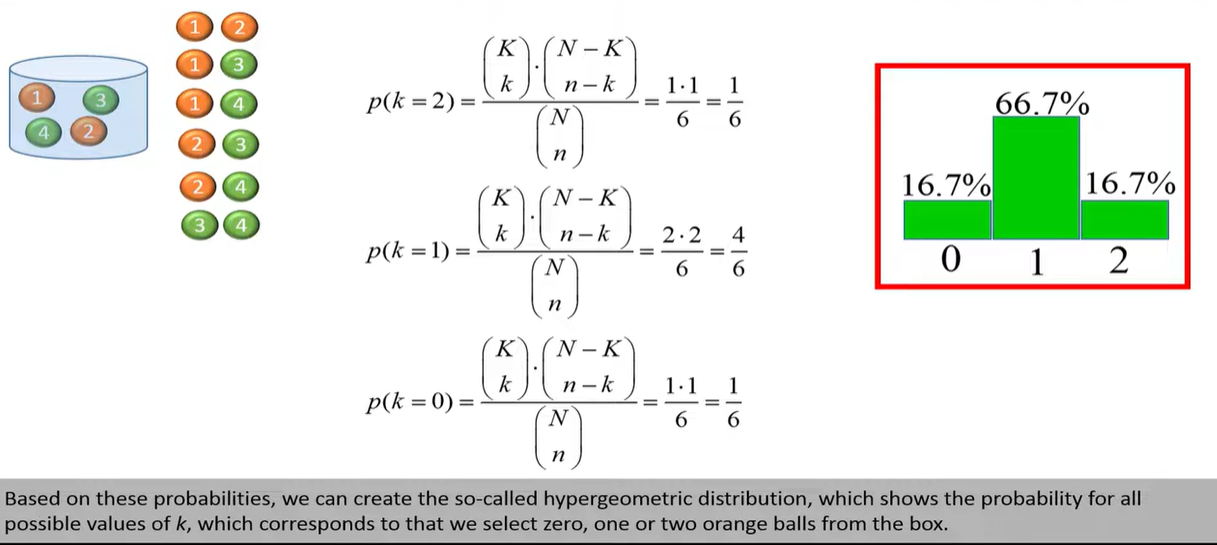 hypergeometric distribution

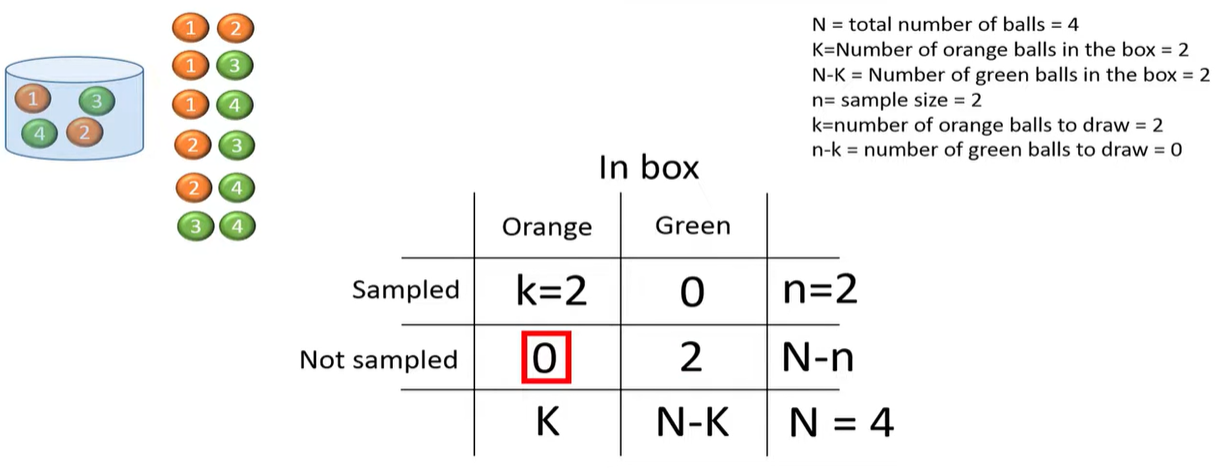


 hypergeometric distribution


 浙公网安备 33010602011771号