软件工程日报--实现echart 图表的展示

实现echart 图表的展示

下载 jquary.js

为了减少对于网络的依赖,我将js下载下来了,实现在本地就可以调用,实现对于echarts图表的展示
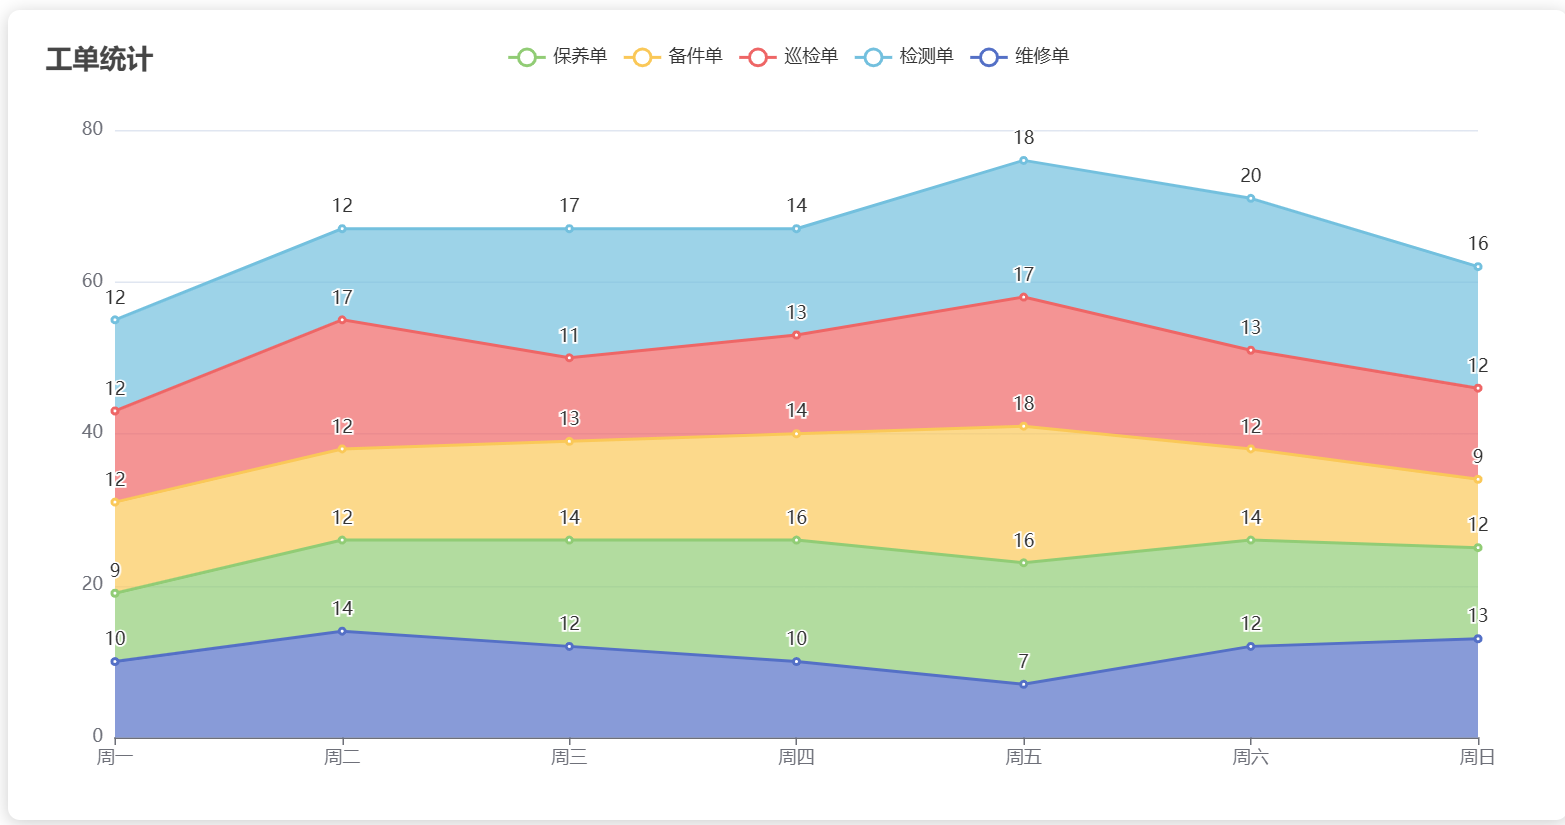
折线图

根据实例代码来实现基础折线图,然后添加各种属性效果如下
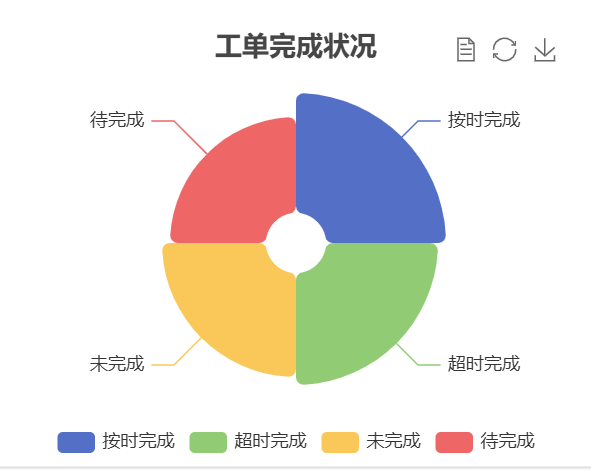
玫瑰图

玫瑰图需要设定每一部分数据的大小,和名称种类等等信息,效果如下

代码展示


                    const echarts = window.echarts;
                    const dom = document.getElementById('container01');
                    if (!dom) return;

                    const myChart = echarts.init(dom, null, {
                        renderer: 'canvas',
                        useDirtyRect: false
                    });

                    const option = {
                        tooltip: {
                            trigger: 'axis',
                            axisPointer: {
                                type: 'cross',
                                label: {
                                    backgroundColor: '#6a7985'
                                }
                            }
                        },
                        title: { text: '工单统计' },

                        legend: { data: [ '保养单', '备件单','巡检单', '检测单','维修单' ] },
                        grid: { left: '3%', right: '4%', bottom: '3%', containLabel: true },
                        xAxis: { type: 'category', data: ['周一', '周二', '周三', '周四', '周五', '周六', '周日'] ,boundaryGap: false},
                        yAxis: { type: 'value' },
                        series: [     {
                            name: '维修单',
                            type: 'line',
                            stack: 'Total',

                         //   smooth: true,
                            areaStyle: {},
                            emphasis: {
                                focus: 'series'
                            },
                            label: {
                                show: true,
                                position: 'top'
                            },
                            data: [10, 14, 12, 10, 7, 12, 13]
                        },
                            {
                          //      smooth: true,
                                name: '保养单',
                                type: 'line',
                                stack: 'Total',
                                areaStyle: {},
                                emphasis: {
                                    focus: 'series'
                                },
                                label: {
                                    show: true,
                                    position: 'top'
                                },
                                data: [9, 12, 14, 16, 16, 14, 12]

                            },
                            {
                          //      smooth: true,
                                name: '备件单',
                                type: 'line',
                                stack: 'Total',
                                areaStyle: {},
                                label: {
                                    show: true,
                                    position: 'top'
                                },
                                emphasis: {
                                    focus: 'series'
                                },
                                data: [12, 12, 13, 14, 18, 12, 9],
                         
                            },
                            {
                            //    smooth: true,
                                name: '巡检单',
                                type: 'line',
                                stack: 'Total',
                                areaStyle: {},
                                emphasis: {
                                    focus: 'series'
                                },
                                label: {
                                    show: true,
                                    position: 'top'
                                },
                                data: [12, 17, 11, 13, 17, 13, 12]
                            },
                            {
                            //    smooth: true,
                                name: '检测单',
                                type: 'line',
                                stack: 'Total',
                                areaStyle: {},
                                emphasis: {
                                    focus: 'series'
                                },
                                label: {
                                    show: true,
                                    position: 'top'
                                },
                                data: [12, 12,17, 14, 18, 20, 16]
                            }
                        ]
                    };


                    myChart.setOption(option);
                    window.addEventListener('resize', myChart.resize);

                const dom02 = document.getElementById('container02');
                if (!dom02) return;

                const myChart02 = echarts.init(dom02, null, {
                    renderer: 'canvas',
                    useDirtyRect: false
                });

                const option02 = {
                    title: {
                        text: '占比分析',
                        subtext: '',
                        left: 'center'
                    },
                    tooltip: {
                        trigger: 'item'
                    },
                    legend: {
                        top: '80%',
                        left: 'center'
                    },
                    series: [
                        {center: ['50%', '45%'],
                            name: '详细信息',
                            type: 'pie',
                            radius: ['40%', '70%'],
                            avoidLabelOverlap: false,
                            padAngle: 5,
                            itemStyle: {
                                borderRadius: 10
                            },
                            label: {
                                show: false,
                                position: 'center'
                            },
                            emphasis: {
                                label: {
                                    show: true,
                                    fontSize: 40,
                                    fontWeight: 'bold'
                                }
                            },
                            labelLine: {
                                show: false
                            },
                            data: [
                                { value: 30, name: '超时完成' },
                                { value: 120, name: '按时完成' },
                                { value: 50, name: '待完成' },
                                { value: 30, name: '超时未完成' },

                            ]
                        }
                    ]
                };

                if (option02 && typeof option02 === 'object') {
                    myChart02.setOption(option02);
                }

                window.addEventListener('resize', myChart.resize);

                axios.post("http://localhost:7469/MaintenanceManage/stop/selectAll",).then((res) => {

                    this.stationList = res.data;

                })

                axios.post("http://localhost:7469/MaintenanceManage/repairOrder/selectAll",).then((res) => {

                    this.tableData= res.data;

                })
posted @ 2025-04-27 23:58  元始天尊123  阅读(17)  评论(0)    收藏  举报