效果
![image]()
代码
import matplotlib.pyplot as plt
import numpy as np
from matplotlib.patches import Rectangle
from matplotlib.ticker import FixedLocator, FixedFormatter
# 数据
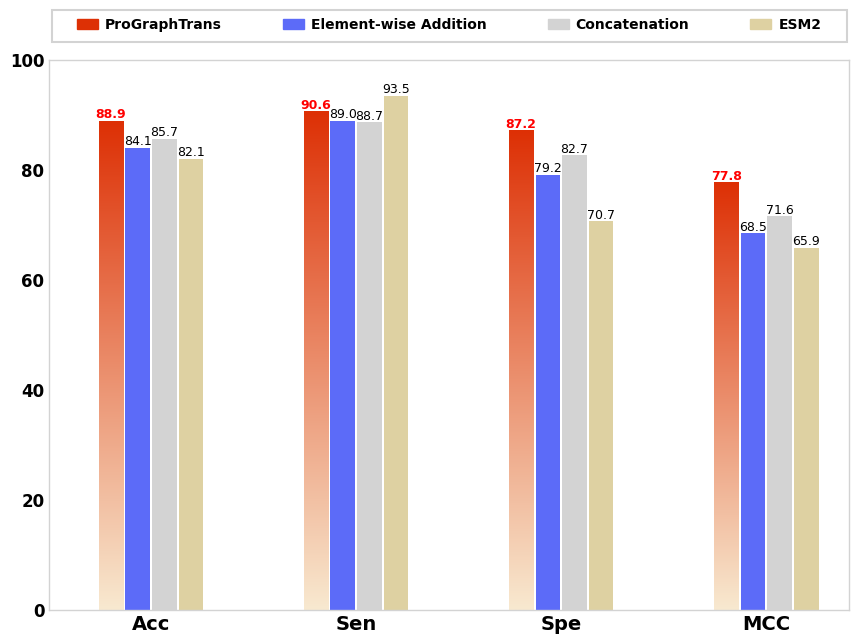
models = ['ProGraphTrans', 'Element-wise Addition', 'Concatenation', 'ESM2']
benchmarks = ['Acc', 'Sen', 'Spe', 'MCC']
data = [
[88.9, 90.6, 87.2, 77.8],
[84.1, 89.0, 79.2, 68.5],
[85.7, 88.7, 82.7, 71.6],
[82.1, 93.5, 70.7, 65.9]
]
# 颜色值
colors = ['#dd3005', '#5c6bf8', '#d3d3d3', '#ded1a2']
# 创建图表
fig, ax = plt.subplots(figsize=(10, 8)) # 设置图表尺寸为 12 英寸宽、8 英寸高
# ==================== 可调节参数 ====================
legend_y_offset = 1.15 # 控制图例垂直位置(越大距离柱状图越远)
legend_shift = -0.05 # 控制图例和矩形框整体下移的距离(负值表示下移)
rect_padding = 0.02 # 矩形框内边距
rect_linewidth = 1.5 # 矩形框线宽
rect_color = '#d3d3d3' # 矩形框颜色(浅灰色)
# 自定义空白长度(单位为英寸)
top_margin_inch = 1.5 # 图表顶部留白
bottom_margin_inch = 1.0 # 图表底部留白
left_margin_inch = 1.0 # 图表左侧留白
right_margin_inch = 1.0 # 图表右侧留白
# 获取当前图表的总宽度和高度(单位为英寸)
fig_width_inch, fig_height_inch = fig.get_size_inches()
# 计算比例
top_margin_ratio = top_margin_inch / fig_height_inch
bottom_margin_ratio = bottom_margin_inch / fig_height_inch
left_margin_ratio = left_margin_inch / fig_width_inch
right_margin_ratio = right_margin_inch / fig_width_inch
# 自定义 y 轴范围
y_min = 0 # y 轴最小值
y_max = 100 # y 轴最大值
# ==================================================
width = 0.12
gap_within_group = 0.01
gap_between_groups = 0.15
x = range(len(benchmarks))
offset = 0.15
# 计算 x 轴范围
left_edge = -offset
right_edge = len(benchmarks) - 1 + 2 * offset + gap_between_groups * (len(benchmarks) - 1)
ax.set_xlim(left_edge, right_edge)
# 定义渐变色函数
def gradient_color(height, color_top="#dd3005", color_bottom="#f8e9d0"):
gradient = np.linspace(0, 1, 256).reshape(-1, 1)
gradient = np.hstack((gradient, gradient))
cmap = plt.cm.colors.LinearSegmentedColormap.from_list("gradient", [color_bottom, color_top])
return cmap(gradient)
# 绘制柱状图
for i in range(len(models)):
positions = [xi + offset + (width + gap_within_group) * i for xi in x]
if i == 0:
for j, pos in enumerate(positions):
height = data[i][j]
ax.imshow(gradient_color(height),
extent=[pos - width / 2, pos + width / 2, 0, height],
aspect="auto", origin="lower")
else:
ax.bar(positions, data[i], width, color=colors[i])
for j, pos in enumerate(positions):
height = data[i][j]
ax.text(pos, height, '%.1f' % data[i][j],
ha='center', va='bottom', fontsize=9,
color='red' if i == 0 else 'black',
fontweight='bold' if i == 0 else 'normal')
# 设置轴标签和样式
ax.set_xticks([p + offset + (width + gap_within_group) * (len(models) - 1) / 2 for p in x])
ax.set_xticklabels(benchmarks, fontsize=14, fontweight='bold')
# ax.set_ylabel('Scores', fontsize=14, fontweight='bold')
# 设置 y 轴范围
ax.set_ylim(y_min, y_max)
# 设置 y 轴数字加粗
y_ticks = ax.get_yticks() # 获取当前 y 轴刻度值
y_tick_labels = [f'{int(tick)}' for tick in y_ticks] # 格式化刻度标签
# 使用 FixedLocator 和 FixedFormatter
ax.yaxis.set_major_locator(FixedLocator(y_ticks)) # 设置刻度位置
ax.yaxis.set_major_formatter(FixedFormatter(y_tick_labels)) # 设置刻度标签
for label in ax.get_yticklabels():
label.set_fontsize(12) # 设置字体大小
label.set_fontweight('bold') # 设置字体加粗
for spine in ax.spines.values():
spine.set_color('#d3d3d3')
spine.set_linewidth(1.0)
ax.tick_params(axis='both', which='both', length=0)
legend_elements = [Rectangle((0, 0), 1, 1, color=c, label=m)
for m, c in zip(models, colors)]
legend = ax.legend(handles=legend_elements,
loc='upper center',
bbox_to_anchor=(0.5, legend_y_offset + legend_shift), # 放置在柱状图上方
ncol=len(models),
fontsize=15,
prop={'weight': 'bold'}, # 设置图例文本加粗
frameon=False,
columnspacing=4.4, # 增大列间距以均匀分布
handletextpad=0.5, # 图例标记与文本之间的间距
handlelength=1.5) # 图例标记长度
# 获取图例的边界框
fig.canvas.draw()
legend_bbox = legend.get_tightbbox(fig.canvas.get_renderer())
legend_bbox = legend_bbox.transformed(fig.transFigure.inverted())
# 动态计算矩形框的宽度和高度
rect_x = 0.5 - (legend_bbox.width / 2 + rect_padding) # 水平居中
rect_width = legend_bbox.width + 2 * rect_padding # 矩形框宽度
rect_y = legend_bbox.ymin - legend_bbox.height-2.5*rect_padding # 垂直居中
rect_height = 2 * rect_padding # 矩形框高度
# 绘制矩形框
rect = Rectangle((rect_x, rect_y),
rect_width,
rect_height,
transform=fig.transFigure,
edgecolor=rect_color, # 浅灰色
facecolor='none',
linewidth=rect_linewidth, # 加粗
clip_on=False)
fig.patches.append(rect)
# 自定义左右上下留白距离
plt.subplots_adjust(
top=1 - top_margin_ratio, # 上方留白
bottom=bottom_margin_ratio, # 下方留白
left=left_margin_ratio, # 左侧留白
right=1 - right_margin_ratio # 右侧留白
)
plt.savefig('Figs/struct_aware.pdf', dpi=300, bbox_inches='tight') # 设置 dpi=100,确保分辨率为 1200x800
plt.show()


 浙公网安备 33010602011771号