
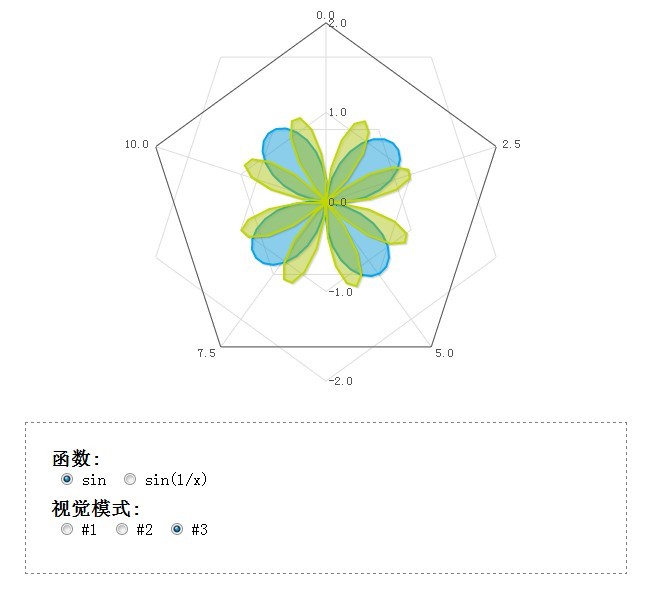
用 Flotr2 实现的 HTML5 图表
1. [图片] 未命名.jpg![]()

2. [代码][HTML]代码
<!DOCTYPE html>
<html lang="en" >
<head>
<meta charset="utf-8" />
<title>用 Flotr2 实现的 HTML5 图表</title>
<script src="http://www.script-tutorials.com/demos/235/js/flotr2.min.js"></script>
<!--[if lt IE 9]>
<script type="text/javascript" src="js/flashcanvas.js"></script>
<![endif]-->
<style>
/* page layout styles */
*{
margin:0;
padding:0;
}
header a.stuts,a.stuts:visited{
border:none;
text-decoration:none;
color:#fcfcfc;
font-size:14px;
left:50%;
line-height:31px;
margin:23px 0 0 110px;
position:absolute;
top:0;
}
header .stuts span {
font-size:22px;
font-weight:bold;
margin-left:5px;
}
.container {
color: #000;
margin: 20px auto;
overflow: hidden;
position: relative;
width: 600px;
height: 400px;
}
.controls {
border: 1px dashed gray;
color: #000;
margin: 20px auto;
padding: 25px;
position: relative;
width: 550px;
}
.controls p {
margin-bottom: 10px;
}
.controls input {
margin-left: 10px;
}
</style>
</head>
<body>
<div ><h2>使用<a href="http://www.oschina.net/p/flotr2" target="_blank">Flotr2</a>实现的HTML5图表效果</h2>源码地址:http://www.script-tutorials.com/html5-charts-and-graphs/</div>
<div id="container" class="container"></div>
<div class="controls">
<h3>函数:</h3>
<p>
<input type="radio" id="funcsin" name="func" value="1" onclick="toggleFunc(1)" checked><label for="funcsin"> sin</label>
<input type="radio" name="func" id="funcsin2" value="2" onclick="toggleFunc(2)"><label for="funcsin2"> sin(1/x)</lalel>
</p>
<h3>视觉模式:</h3>
<p>
<input type="radio" name="mode" value="1" id="vm1" onclick="toggleMode(1)" checked> <label for="vm1">#1</label>
<input type="radio" name="mode" value="2" id="vm2" onclick="toggleMode(2)"> <label for="vm2">#2</label>
<input type="radio" name="mode" value="3" id="vm3" onclick="toggleMode(3)"> <label for="vm3">#3</label>
</p>
</div>
</body>
</html>
3. [代码][JavaScript]代码
var container = document.getElementById('container');
var start = (new Date).getTime();
var data, graph, offset, i;
var mode = 1;
var fmode = 1; // 1- basic sin, 2 - sin(1/x)
// toggle mode
function toggleMode(i) {
mode = i;
}
// toggle func
function toggleFunc(i) {
fmode = i;
}
// Draw a sine curve at time t
function animateSine (t) {
data = [];
data2 = [];
// little offset between steps
offset = 2 * Math.PI * (t - start) / 10000;
http://www.enterdesk.com/special/meitu/
if (fmode == 2 && offset > 15) {
start = t;美图
}
for (i = 0; i < 4 * Math.PI; i += 0.2) {
if (fmode == 1) {
data.push([i, Math.sin(i - offset)]);
data2.push([i, Math.sin(i*2 - offset)]);
} else if (fmode == 2) {
data.push([i, Math.sin(1/(i-offset))]);
// data2.push([i, Math.sin(1/(i*2-offset))]);
}
}
// prepare properties
var properties;
switch (mode) {
case 1:
properties = {
yaxis : {
max : 2,
min : -2
}
};
break;
case 2:
properties = {
yaxis : {
max : 2,
min : -2
},
bars: {
show: true,
horizontal: false,
shadowSize: 0,
barWidth: 0.5
}
};
break;
case 3:
properties = {
yaxis : {
max : 2,
min : -2
},
radar: {
show: true
},
grid: {
circular: true,
minorHorizontalLines: true
}
};
break;
case 4:
properties = {
yaxis : {
max : 2,
min : -2
},
bubbles: {
show: true,
baseRadius: 5
},
};
break;
}
// draw graph
if (fmode == 1) {
graph = Flotr.draw(container, [ data, data2 ], properties);
} else if (fmode == 2) {
graph = Flotr.draw(container, [ data ], properties);
}
// main loop
setTimeout(function () {
animateSine((new Date).getTime());
}, 50);
}
animateSine(start);

 浙公网安备 33010602011771号