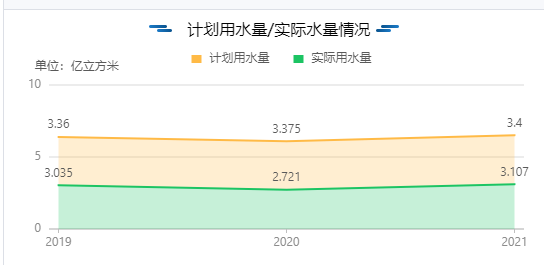
G2堆叠面积图
先上图

1 secondChartInit() { 2 const chart = new Chart({ 3 container: 'Statistics-chart2',//id值 4 autoFit: true, 5 padding: [70, 20, 20, 40] 6 // height: 500, 7 }) 8 const tooltipHtml = 9 `<div style='display:flex;justify-content:space-between;align-items:center;width: 170px;height: 21px;'> 10 <div style='background: url(${leftimg});width:23px;height:7px;'> 11 </div><div><span> 累计节水统计</span></div><div style='background: url(${rightimg});width:23px;height:7px;'> 12 </div></div>` 13 chart.annotation().html({ 14 html: tooltipHtml, 15 alignY: 'middle', 16 offsetX: 150, 17 offsetY: -170, 18 top: true 19 })//自定义文字 20 chart.annotation().text({ 21 content: "单位:亿立方米", 22 isVertical: true, 23 position: ['-4%', '-12%'] 24 }) 25 chart.data(this.secondChartData) 26 chart.scale({ 27 year: { 28 range: [0.02, 0.98],//面积横向范围 29 }, 30 value: { 31 nice: true, 32 }, 33 }) 34 chart.tooltip({ 35 showCrosshairs: true, 36 shared: true, 37 }) 38 chart.legend(false) 39 chart 40 .line() 41 .position('year*value').label('value') 42 .color('item') 43 .shape('smooth'); 44 chart 45 .point() 46 .position('year*value') 47 .color('item') 48 .shape('smooth'); 49 chart.theme({ "styleSheet": { "brandColor": "#8052F3", "paletteQualitative10": ["#8052F3"] }}); 50 chart.render(); 51 }
1 补充:
2     secondChartData: [
3         { item: '累计节水用水量', year: '2019', value: 0.325 },
4         { item: '累计节水用水量', year: '2020', value: 0.979 },
5         { item: '累计节水用水量', year: '2021', value: 1.272 }
6       ]


 浙公网安备 33010602011771号