记录使用echarts的graph类型绘制流程图全过程(二)- 多层关系和圆形图片的设置
本文主要记录在使用echarts的graph类型绘制流程图时候遇到的2个问题:对于圆形图片的剪切和多层关系的设置
图片的设置
如果用echarts默认的symbol参数来显示图片,会显示图片的原始状态,即圆形就显示圆形的,矩形就显示矩形的,而案例中的图片是矩形的(如上图所示)。但是尼,我们在流程图的绘制过程中,一般用到的又是圆形,所以这时候就需要我们自己进行剪切了。主要运用cavans的clip功能,以下是具体的代码实现:
       let picList = [];
        let tempNodes = [];

        for (let i in this.nodesObj) {
          let item = this.nodesObj[i];
          // 设置已知的信息
          let obj = {
            x: item.x,
            y: item.y,
            name: item.name,
            id: item.id,
            symbolSize: this.size,
            category:
              item.id === this.startNode || item.id === this.endNode ? 0 : 1
          };

          // 如果有图标信息,进行图片处理,没有的直接放到节点信息中
          if (item.icon) {
            let p = this.getImgData(item.icon);
            picList.push(p);
            tempNodes.push(obj);
          } else {
            this.nodes.push(obj);
          }
        }

        // 将图片处理放在promise中,然后使用promise.all,当所有的图片都剪切完毕后,赋值
        if (picList.length > 0) {
          let that = this;
          Promise.all(picList).then(images => {
            for (let i = 0, len = tempNodes.length; i < len; i++) {
              tempNodes[i].symbol = 'image://' + images[i];
              that.nodes.push(tempNodes[i]);
            }
            // console.log(this.nodes);

            // 再设置节点
            that.setLinks();

            // 把数据设置到Echart中data
            if (this.graphChart) {
              var option = this.graphChart.getOption();
              option.series[0].nodes = this.nodes;
              option.series[0].links = this.links;

              this.graphChart.setOption(option);
            }
          });
        } else {
          // 设置节点
          this.setLinks();
        }
// 获取icon的图片信息
    getImgData (imgSrc) {
      var fun = function (resolve) {
        const canvas = document.createElement('canvas');
        const contex = canvas.getContext('2d');
        const img = new Image();

        img.crossOrigin = '';
        img.onload = function () {
          // 设置图形宽高比例
          let center = {
            x: img.width / 2,
            y: img.height / 2
          };
          let diameter = img.width;
          let radius = diameter / 2; // 半径

          canvas.width = diameter;
          canvas.height = diameter;
          contex.clearRect(0, 0, diameter, diameter);
          contex.save();

          contex.beginPath();
          contex.arc(radius, radius, radius, 0, 2 * Math.PI); // 画出圆
          contex.clip();

          contex.drawImage(
            img,
            center.x - radius,
            center.y - radius,
            diameter,
            diameter,
            0,
            0,
            diameter,
            diameter
          ); // 在刚刚裁剪的园上画图
          contex.restore(); // 还原状态

          resolve(canvas.toDataURL('image/png', 1));
        };
        img.src = imgSrc;
      };
      var promise = new Promise(fun);
      return promise;
    }
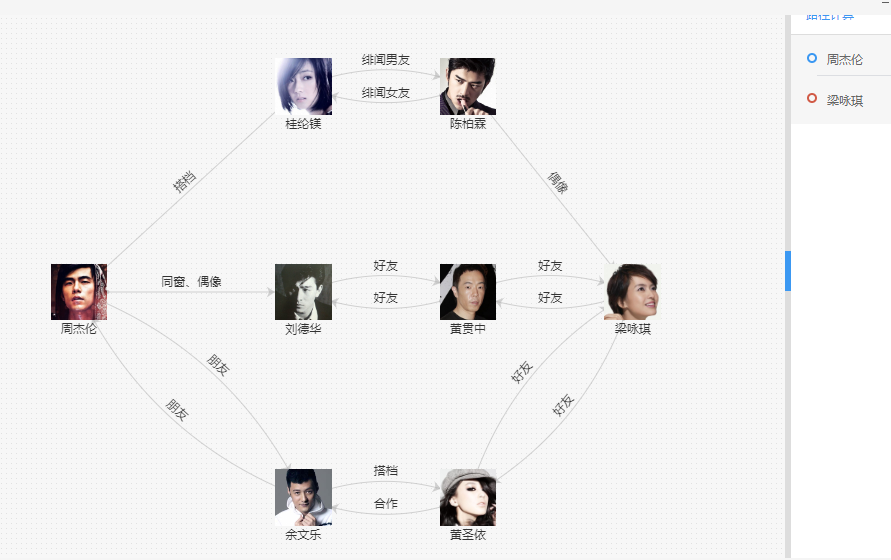
实现效果:

多关系合并
echarts的关系最多支持2条显示,所以当2个节点之间存在多个关系的时候,可以把同一个指向的关系合并到一起如下图,周杰伦与刘德华的关系是偶像和同窗,刘德华和周杰伦的关系是好友

也就是获取两个节点之间同方向的线条的关系,然后进行合并,再显示在一条关系线上即可。
// 设置线条
    setLinks () {
      this.links = [];
      this.relationList.forEach(item => {
        let obj = {
          source: item.source,
          target: item.target,
          value: item.relName,
          label: {
            show: true,
            formatter: '{c}'
          }
        };

        if (item.sameTotal >= 2) {
          let hasLink = this.links.find(link => {
            if (link.source === item.source && link.target === item.target) {
              return true;
            }
          });

          if (!hasLink) {
            let res = this.findSameLinkRelation(
              item.source,
              item.target,
              item.sameTotal
            );
            obj.value = res.value;
            if (res.setLineStyle) {
              obj.lineStyle = {
                normal: {
                  curveness: 0.2
                }
              };
            }
            this.links.push(obj);
          }
        } else {
          this.links.push(obj);
        }
      });
}
findSameLinkRelation (sid, tid, total) {
      let value = [];
      let setLineStyle = true;

      this.relationList.forEach(item => {
        if (item.source === sid && item.target === tid) {
          value.push(item.relName);
        }
      });

      if (total === value.length) {
        setLineStyle = false;
      }

      value = value.join('、');
      return {
        value,
        setLineStyle
      };
}

 浙公网安备 33010602011771号