在Web前端基于CAD图实现等值线在线分析
等值线是GIS制图中常见的功能。在实际中经常需要基于CAD图纸对数据进行等值线分析。等值线的类型主要有:等高线、等深线、等温线(等气温线、等水温线)、等压线(水平面等压线、垂直面等压线)、等降水量线、等太阳辐射量线、等盐度线、等PH值线、等太阳高度线、等潜水位线、等承压水位线等。
通过分析等值线,我们可以判读等高线来判断地形的坡度的陡与缓,确定山脉的走向;通过判读等深线来判断海洋地形的种类如大陆架、海沟、海盆、海岭、海底火山等;通过判读大气等压线来判断气压中心的名称:如气旋、反气旋、高压脊、低压糟、轮廓;判断不同部位的天气特点,风向与风力大小;通过判读大气等温线来判断所在地的南北半球、季节与天气;通过判读等降水量线结合具体的地形轮廓判定山地的迎风坡与背风坡等;通过判读人口密度等值线分析某地区人口分布的规律及其影响的自然、历史、社会、经济诸因素。
实现原理
等值线的原理
-
-
低高低和高低高原理 低值凸向高值,凸处的值变低 高值凸向低值,凸处的值变高
-
疏差小和密差大原理 等值线越稀疏,单位距离的差值越小 等值线越 密集,单位距离的差值越大
用程序绘制等值线的方法一般有:
-
-
-
-
在著名的开源GIS算法库
实现
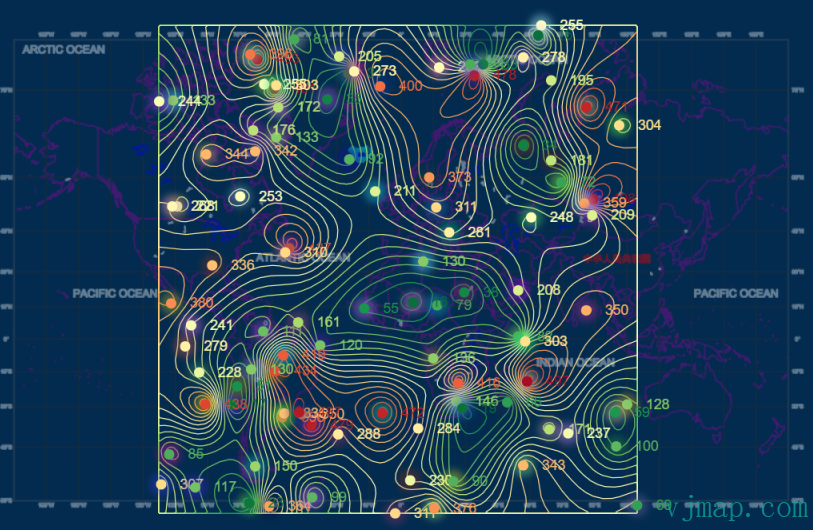
先上效果图
以下的实现代码已开源至github。 地址: https://github.com/vjmap/vjmap-playground/blob/main/src/11geo_%E5%87%A0%E4%BD%95%E8%AE%A1%E7%AE%97/geoVectorContour.js
实现步骤:
(1) Web端在线打开CAD图
如何在Web网页端展示CAD图形(
(2) 利用数据生成等值线
为了防止生成等值线的过程造成页面卡顿,这里把算法放到了webworker中来进行计算
//生成测试数据
let dataMinValue = 10; // 数据最小值
let dataMaxValue = 500; // 数据最大值
let dataset = {
"type" : "FeatureCollection",
"features" : []
};
// 区间颜色值
let colors = ["#006837", "#1a9850", "#66bd63", "#a6d96a", "#d9ef8b", "#ffffbf","#fee08b",
"#fdae61", "#f46d43", "#d73027", "#a50026"];
for (let i = 0; i < 100; i++) {
let feature={
"type" : "Feature",
"properties" : {
"value" : vjmap.randInt(dataMinValue, dataMaxValue) // 在最大值最小值范围内随机生成一个测试数据
},
"geometry" : {
"type" : "Point",
"coordinates" : map.toLngLat(mapBounds.randomPoint())
}
};
dataset.features.push(feature);
}
let contoursSize = 20; // 等值面分级区间数,这里设置为20,可以自行设置
const createContour = async (dataset, contoursSize, propField, colors, dataMinValue, dataMaxValue, maxHeight, model) => {
let contours = [];
for(let i = 0; i < contoursSize; i++) {
contours.push(dataMinValue + (dataMaxValue - dataMinValue) * i / (contoursSize - 1));
}
let interpolateInput = [], interpolateOutput = [];
for(let i = 0; i < colors.length; i++) {
interpolateInput.push(i / (colors.length - 1)); // 插值输入值,这里输入0-1之间的比例
interpolateOutput.push(colors[i]) // 插值输出值,这里输入0-1之间的比例对应的颜色值
}
// 启动webworker计算函数
let createContourWorker = vjmap.WorkerProxy(vjmap.vectorContour);
let { grid, contour } = await createContourWorker(dataset, propField, contours, {
model: model || 'exponential',
sigma2:0,
alpha:100
});
// 根据比例插值颜色
const mapProgressToValues = value => vjmap.interpolate(
interpolateInput,
interpolateOutput,
{ ease: vjmap.linear }
)(value)
// 把原数据的颜色也设置下,绘制marker需要
dataset.features.forEach(f => f.properties.color = mapProgressToValues((f.properties.value - dataMinValue) / (dataMaxValue - dataMinValue)))
let h = maxHeight; // 设置最大值要拉伸的高度
for(let i = 0; i < contour.features.length; i++) {
let prop = contour.features[i].properties;
let r = (prop.value - dataMinValue) / (dataMaxValue - dataMinValue);
prop.color = mapProgressToValues(r); // 插值出颜色值
prop.height = h * r; // 插值出要拉伸的高度值
}
return contour;
}
let maxHeight = map.pixelToHeight(100, map.getZoom()); // 设置最大值要拉伸的高度
let contour = await createContour(dataset, contoursSize, "value" /*geojson的哪个属性值用于计算*/, colors, dataMinValue, dataMaxValue, maxHeight);
(3)绘制原始数据和生成好的等值线
let markers = null;
const addMarkers = ()=> {
if (markers) return;
markers = dataset.features.map(f => {
// 再随机生成不同样式的
let _marker = new vjmap.DiffusedApertureMarker({
lngLat: f.geometry.coordinates,
text: f.properties.value.toFixed(0)
}, {
// 可以给不同的属性,如宽度,颜色,字体
width: 10,
colors: [f.properties.color, vjmap.randomColor()],
textFontSize: 14,
textColor: f.properties.color
}).createMarker();
_marker.addTo(map)
return _marker
})
}
const removeMarkers = ()=> {
if (!markers) return;
for(let i = markers.length - 1; i >= 0; i--) {
markers[i].remove();
}
markers = null;
}
let polyline = null;
const addPolyline = ()=> {
if (polyline) return;
polyline = new vjmap.Polyline({
data: contour,
lineColor: ['case', ['to-boolean', ['feature-state', 'hover']], '#00ffff', ['get', 'color']],
isHoverPointer: true,
isHoverFeatureState: true
});
polyline.addTo(map);
polyline.clickPopup(f => `<h3>值: ${f.properties.value.toFixed(2)}</h3>Color: ${f.properties.color}`, { anchor: 'bottom' });
}
const removePolyline = ()=> {
if (!polyline) return;
polyline.remove();
polyline = null;
}
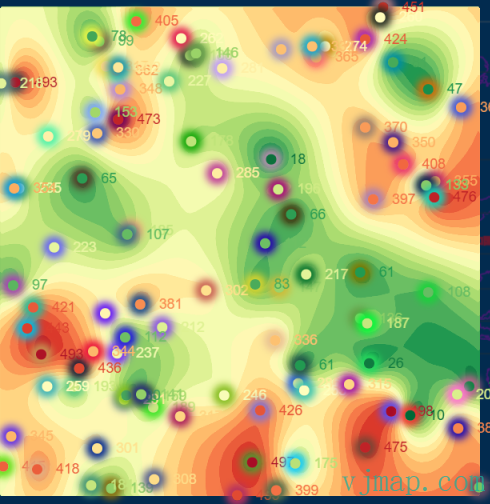
(4)生成等值面
let polygon = null;
        const addPolygon = ()=> {
            if (polygon) return;
            polygon = new vjmap.Polygon({
                data: contour,
                fillColor: ['case', ['to-boolean', ['feature-state', 'hover']], '#00ffff', ['get', 'color']],
                fillOpacity: 0.9,
                isHoverPointer: true,
                isHoverFeatureState: true
            });
            polygon.addTo(map);
            polygon.clickPopup(f => `<h3>值: ${f.properties.value.toFixed(2)}</h3>Color: ${f.properties.color}`, { anchor: 'bottom' });
        }
        const removePolygon = ()=> {
            if (!polygon) return;
            polygon.remove();
            polygon = null;
        }
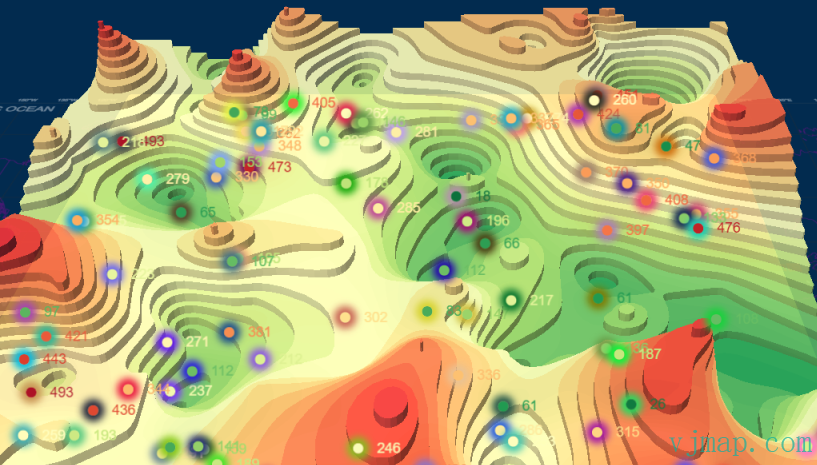
(4)生成等值面拉伸
let fillExtrusions = null;
        const addFillExtrusion = ()=> {
            if (fillExtrusions) return;
            fillExtrusions = new vjmap.FillExtrusion({
                data: contour,
                fillExtrusionColor: ['case', ['to-boolean', ['feature-state', 'hover']], '#00ffff', ['get', 'color']],
                fillExtrusionOpacity: 0.9,
                fillExtrusionHeight: ['get', 'height'],
                fillExtrusionBase:0,
                isHoverPointer: true,
                isHoverFeatureState: true
            });
            fillExtrusions.addTo(map);
            fillExtrusions.clickPopup(f => `<h3>值: ${f.properties.value.toFixed(2)}</h3>Color: ${f.properties.color}`, { anchor: 'bottom' });
        }
        const removeFillExtrusion = ()=> {
            if (!fillExtrusions) return;
            fillExtrusions.remove();
            fillExtrusions = null;
        }
以上的实现代码已开源至github。 地址: https://github.com/vjmap/vjmap-playground/blob/main/src/11geo_%E5%87%A0%E4%BD%95%E8%AE%A1%E7%AE%97/geoVectorContour.js
在线体验地址为:

 浙公网安备 33010602011771号