在线CAD图纸批注功能方案比较与实现
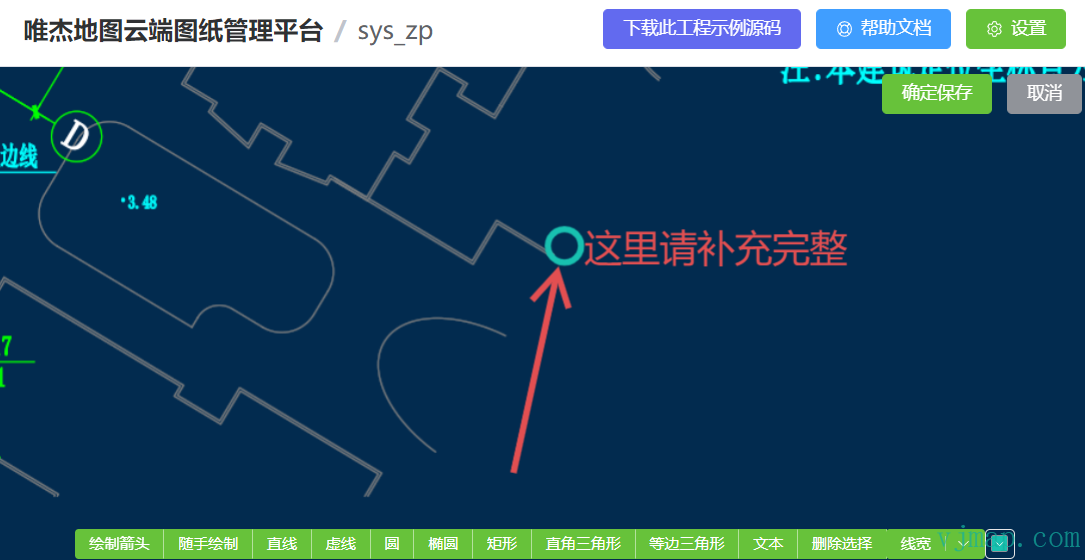
实现效果图
如果在Web网页端展示CAD图形(
图纸批注方案比较
图纸批注功能做为web端图纸显示的一个图层,一般的技术思路可分为通过矢量图形绘制和svg图形这两种方式把图纸要批注的内容叠加到地图图层上。两个方案的优缺点如下:
矢量图形绘制:
优点:性能高,叠加效果好,支持无级放大不失真;
缺点:编辑功能较弱,表达内容有限
SVG图形:
优点:编辑功能强,表达内容丰富
缺点:大量svg图形会导致性能低下,放大到一定级别后会失真
总结: 鉴于图纸批注的需求,是一个要求表达内容丰富, 同时不会存在很大数据量的需求,所以用 svg图形方案叠加是不错的选择。
图纸批注实现
SVG图形编辑库选型
svg图形编辑库采用的是github上star多达22k的开源库Fabric.js。
Fabric.js 是一个功能强大且简洁的 canvas 库。它提供了一系列可操作 canvas 的 API。让你轻松的操作 canvas。并且还提供了 SVG 转 canvas 和 canvas 转 SVG 的解析器供使用。
Fabric.js官网地址为http://fabricjs.com/ ,github仓库地址为https://github.com/fabricjs/fabric.js
图纸批注绘图相关代码
//绘画方法
    function drawing() {
        if (drawingObject) {
            canvas.remove(drawingObject);
        }
        var canvasObject = null;
        switch (drawType) {
            case "arrow": //箭头
                canvasObject = new fabric.Path(drawArrow(mouseFrom.x, mouseFrom.y, mouseTo.x, mouseTo.y, 30, 30), {
                    stroke: strokeColor.value,
                    fill: "rgba(255,255,255,0)",
                    strokeWidth: strokeWidth.value
                });
                break;
            case "line": //直线
                canvasObject = new fabric.Line([mouseFrom.x, mouseFrom.y, mouseTo.x, mouseTo.y], {
                    stroke: strokeColor.value,
                    strokeWidth: strokeWidth.value
                });
                break;
            case "dottedline": //虚线
                canvasObject = new fabric.Line([mouseFrom.x, mouseFrom.y, mouseTo.x, mouseTo.y], {
                    strokeDashArray: [3, 1],
                    stroke: strokeColor.value,
                    strokeWidth: strokeWidth.value
                });
                break;
            case "circle": //正圆
                var left = mouseFrom.x,
                    top = mouseFrom.y;
                var radius = Math.sqrt((mouseTo.x - left) * (mouseTo.x - left) + (mouseTo.y - top) * (mouseTo.y - top)) / 2;
                canvasObject = new fabric.Circle({
                    left: left,
                    top: top,
                    stroke: strokeColor.value,
                    fill: "rgba(255, 255, 255, 0)",
                    radius: radius,
                    strokeWidth: strokeWidth.value
                });
                break;
            case "ellipse": //椭圆
                var left = mouseFrom.x,
                    top = mouseFrom.y;
                var radius = Math.sqrt((mouseTo.x - left) * (mouseTo.x - left) + (mouseTo.y - top) * (mouseTo.y - top)) / 2;
                canvasObject = new fabric.Ellipse({
                    left: left,
                    top: top,
                    stroke: strokeColor.value,
                    fill: "rgba(255, 255, 255, 0)",
                    originX: "center",
                    originY: "center",
                    rx: Math.abs(left - mouseTo.x),
                    ry: Math.abs(top - mouseTo.y),
                    strokeWidth: strokeWidth.value
                });
                break;
            case "rectangle": //长方形
                var path =
                    "M " +
                    mouseFrom.x +
                    " " +
                    mouseFrom.y +
                    " L " +
                    mouseTo.x +
                    " " +
                    mouseFrom.y +
                    " L " +
                    mouseTo.x +
                    " " +
                    mouseTo.y +
                    " L " +
                    mouseFrom.x +
                    " " +
                    mouseTo.y +
                    " L " +
                    mouseFrom.x +
                    " " +
                    mouseFrom.y +
                    " z";
                canvasObject = new fabric.Path(path, {
                    left: left,
                    top: top,
                    stroke: strokeColor.value,
                    strokeWidth: strokeWidth.value,
                    fill: "rgba(255, 255, 255, 0)"
                });
                //也可以使用fabric.Rect
                break;
            case "rightangle": //直角三角形
                var path = "M " + mouseFrom.x + " " + mouseFrom.y + " L " + mouseFrom.x + " " + mouseTo.y + " L " + mouseTo.x + " " + mouseTo.y + " z";
                canvasObject = new fabric.Path(path, {
                    left: left,
                    top: top,
                    stroke: strokeColor.value,
                    strokeWidth: strokeWidth.value,
                    fill: "rgba(255, 255, 255, 0)"
                });
                break;
            case "equilateral": //等边三角形
                var height = mouseTo.y - mouseFrom.y;
                canvasObject = new fabric.Triangle({
                    top: mouseFrom.y,
                    left: mouseFrom.x,
                    width: Math.sqrt(Math.pow(height, 2) + Math.pow(height / 2.0, 2)),
                    height: height,
                    stroke: strokeColor.value,
                    strokeWidth: strokeWidth.value,
                    fill: "rgba(255,255,255,0)"
                });
                break;
            case "text":
                textbox = new fabric.Textbox("", {
                    left: mouseFrom.x - 60,
                    top: mouseFrom.y - 20,
                    width: 150,
                    fontSize: 30,
                    borderColor: "yellow",
                    fill: strokeColor.value,
                    hasControls: true
                });
                canvas.add(textbox);
                textbox.enterEditing();
                textbox.hiddenTextarea.focus();
                break;
            case "remove":
                break;
            default:
                break;
        }
        if (canvasObject) {
            canvas.add(canvasObject);
            drawingObject = canvasObject;
        }
    }
SVG图形与地图叠加显示
唯杰地图 vjmap提供的sdk中有在一个地理范围内创建一个随缩放而缩放的div的覆盖物类DivOverlay,其类型定义如下
/**
* 在一个地理范围内创建一个随缩放而缩放的div的覆盖物
* 注:如果是svg,则需设置为 viewBox="0 0 width height" preserveAspectRatio="xMinYMin meet", updateDivSize选项设置为true
**/
export class DivOverlay {
options: DivOverlayOptions;
_map?: Map;
isShow: boolean;
minZoom: number;
maxZoom: number;
isRemoved: boolean;
parentContainer?: HTMLElement;
constructor(options: DivOverlayOptions);
addTo(map: Map, insertId?: string | HTMLElement): void;
private _isShow;
private _add;
private _remove;
/**
* 设置是否显示隐藏
* @param visible 是否显示
* @param isDisplay true的话,表示用style的display去控制隐藏显示,dom还在文档中。false的话,会从文档动态清空增加
*/
setVisible(visible?: boolean, isDisplay?: boolean): void;
remove(): void;
updateBounds(bounds: [GeoPointLike, GeoPointLike, GeoPointLike, GeoPointLike] | GeoBounds): void;
updateSize(width: number, height: number): void;
private _updateZoom;
private _updateDivSize;
private _adjustCoord;
private _update;
}
export interface DivOverlayOptions {
/** 范围,四个点坐标 */
bounds: [GeoPointLike, GeoPointLike, GeoPointLike, GeoPointLike] | GeoBounds;
/** html元素 */
element: HTMLElement;
/** 元素宽 */
width: number;
/** 元素高 */
height: number;
/** 显示最大级别 */
minZoom?: number;
/** 显示最小级别 */
maxZoom?: number;
/** 自动更新div大小,(如果需要svg放大,需要设置为true) */
updateDivSize?: boolean;
/** 放大div时,最大的div大小,超过了就像素放大了 */
maxDivSize?: number;
}
我们把fabricjs中绘制的图形导出为svg,然后通过DivOverlay叠加至地图上,就可以了。相关代码如下
export const createDivSvg = (map: Map, eleId: string, pt1: GeoPoint, pt2: GeoPoint, width: number, height: number, svg: string) => {
svg = svg.substring(svg.indexOf("<desc>"));
const div = document.createElement( "div" );
div.id = eleId;
div.innerHTML = `
<svg viewBox="0 0 ${width} ${height}" preserveAspectRatio="xMinYMin meet" version="1.1" xmlns="http://www.w3.org/2000/svg">
${svg}
</svg>
`;
div.style.position = 'absolute';
div.style.pointerEvents = "none"
div.style.width = width + "px";
div.style.height = height + "px";
//div.style.opacity = '0.8';
const divOverlay = new DivOverlay({
bounds: [[pt1.x, pt2.y], [pt1.x, pt1.y], [pt2.x, pt1.y], [pt2.x, pt2.y]],
element: div,
width: width,
height: height,
updateDivSize: true // 如果svg需要放大,需要加此参数
})
divOverlay.addTo(map);
return divOverlay;
}
let center = map.getCenter();
let anno = {
mapId: app.curMapId,
version: app.curVersion,
name: name,
darkTheme: svc.currentMapParam()?.darkMode === true ? true : false,
imgSrc: img,
zoom: map.getZoom(),
centerX: center.lng,
centerY: center.lat,
bearing: map.getBearing(),
pitch: map.getPitch(),
id: id,
pt1: canvasCoord1,
pt2: canvasCoord2,
width: canvasWidth,
height: canvasHeight,
svg: fabricCanvas.toSVG(),
json: fabricCanvas.toJSON(),
}
// 增加divSvg
let divOverlay = createDivSvg(map, id, canvasCoord1, canvasCoord2, canvasWidth, canvasHeight, anno.svg);
有需要的朋友可以在线上传图形创建属于自己的图纸批注。上面的案例代码已开源。访问 (

 浙公网安备 33010602011771号