Android Profile 工具
使用Profile工具可以监控应用程序的CPU、内存、网络的实时使用情况。可用于分析卡顿、内存泄漏等等
一、使用Profile和Debug API 分析App冷启动
1、开始记录
Application处启动debug.trace
    @Override
    protected void attachBaseContext(Context base) {
        super.attachBaseContext(base);
        File file = getExternalFilesDir(null);
        Debug.startMethodTracing(file + "/dmtrace.trace");
        Log.e("====", "attachBaseContext");
    }
2、结束记录
在需要的地方结束记录,这里以activity.onwindowfocus为例
    override fun onWindowFocusChanged(hasFocus: Boolean) {
        super.onWindowFocusChanged(hasFocus)
        Debug.stopMethodTracing()
        Log.e("====", " onWindowFocusChanged:")
    }
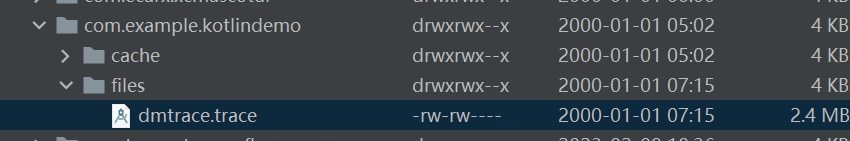
3、运行程序,导出trace文件
Android/data/包名/files/dmtrace.trace
4、Profile工具导入文件
分析耗时方法:
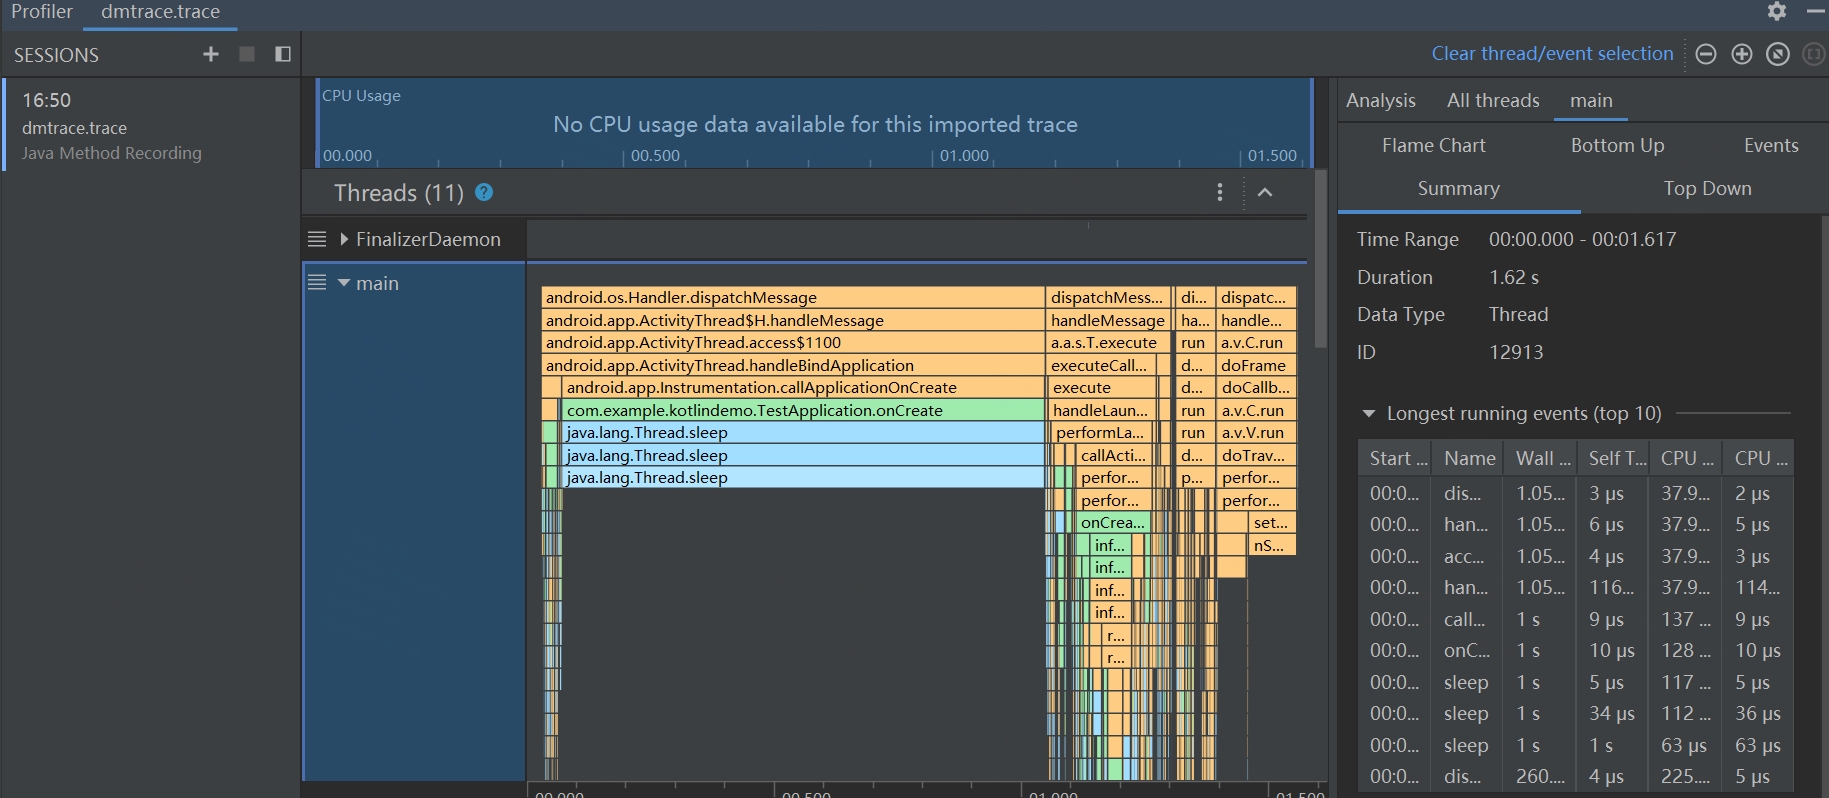
绿色部分表示自己应用内的方法,主要关注。
黄色及蓝色是系统的方法,无需特别关注。
二、分析某个时刻应用卡顿
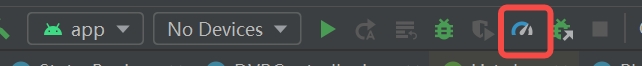
1、启动profile,运行app
2、打开cpu,进行分析
运行成功后,提供了,CPU、MEMORY(内存)、NETWORK(网络)三方面的分析
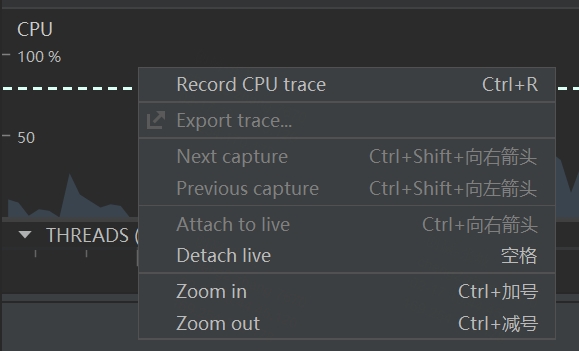
3、分析耗时时刻、方法
cpu分析页面右键鼠标,选择Record CPU trace
4、操作app,然后Stop Record
生成如1-4的CPU使用图,分析自有方法消耗时间
参考:Android性能优化使用自带的Profiler功能分析traceView文件
内存:
https://blog.csdn.net/weixin_35510761/article/details/117315249

 浙公网安备 33010602011771号