

vue-cli项目使用echarts系列
项目源码地址: https://github.com/shengbid/echarts-series,如果有帮助记得给个star哈,码字不易,谢谢各位大佬
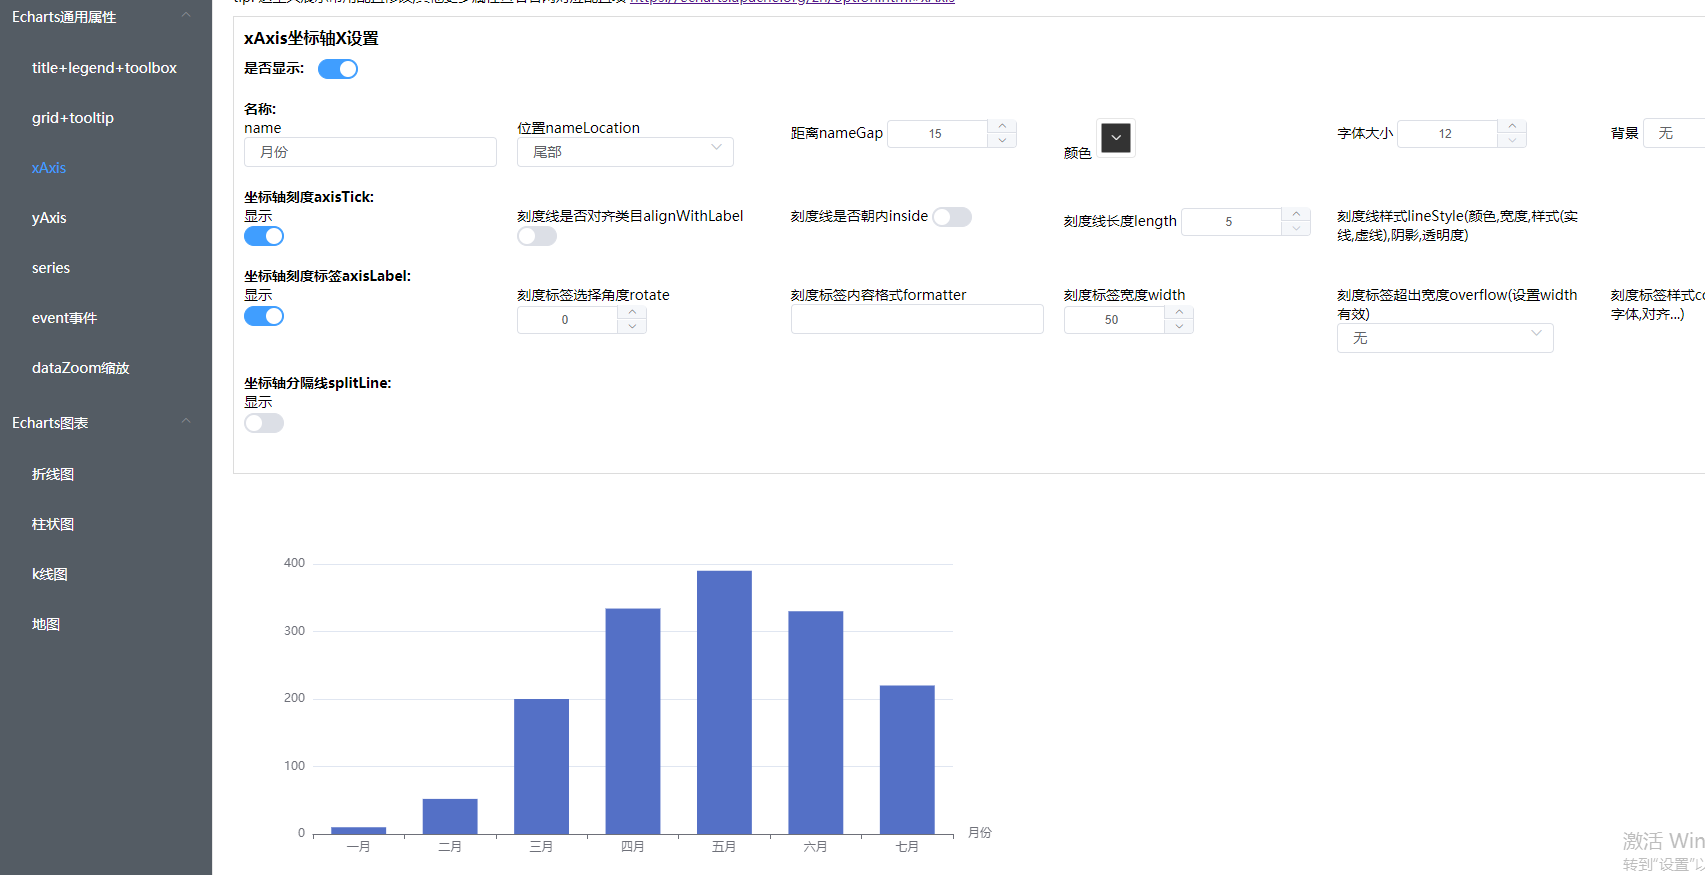
这个项目主要是对echarts中一些常用属性进行修改,用页面操作的方式,能更加直观的对echarts进行配置
主要分为两部分:1. echarts常用属性操作; 2.echarts常见图表展示
项目截图:

对于一些相对复杂的图表,例如地图,k线图,我也有单独写博客注明,地址可以看文末的推荐链接
项目是vue-cli + echarts + elementUI
在vue-cli中使用echarts步骤
1. 安装echarts npm i echarts -S
2. 在main.js中引入,注意,要用require方式引入,引入后绑定在vue原型上,方便在项目中使用
var echarts = require('echarts')
Vue.prototype.$echart = echarts
3. 页面中使用
<template>
  <div class="line-container">
    <div>
      <!-- 需要一个元素展示echarts,设置好width,height -->
      <div id="mapChart" style="width: 900px;height:500px;"></div>
    </div>
  </div>
</template>

<script>
import chinaJson from '@/utils/map/china.json' // 地图json数据引入

export default {
  name: 'mapChart',
  data() {
    return {
      option: {
        title: {
          text: '中国地图',
          subtext: '鼠标缩放比例大于2.5展示名称'
         },
        tooltip: {
          trigger: 'item'
        },
        series: [{
          type: 'map',
          map: 'china',
          zoom: 1.2,
          roam: true
        }]
      },
      mapChart: null
    }
  },
  mounted() {
    // 在mounted中初始化echarts
    this.getMapChart()
  },
  methods: {
    // 设置折线图
    getMapChart() {
      this.mapChart = this.$echart.init(document.getElementById('mapChart'))

      this.$echart.registerMap('china', chinaJson);
      this.mapChart.setOption(this.option)
</script>

 浙公网安备 33010602011771号