
使用.Net Memory Profiler 分析.Net程序内存泄露
.Net 内存泄露无外乎那几类:
引用未消除,事件未删除
如果是WPF应用程序,常见的有Image 对象释放问题,绑定到非依赖属性或未实现INotifyPropertyChanged 接口的对象属性.这里不细述.
本文介绍如何使用强大的.Net Memory Profiler 分析.Net 应用程序内存泄露. 使用的Demo 是 使用Mdbg.exe 调试.net 程序 中的Demo.
Sample Code:
namespace MemLeakProfileDemo
{

    public partial class Form1 : Form
    {
        private Fool fool;
        private FoolBrother brother;

        public Form1()
        {
            InitializeComponent();
            fool = new Fool();
            brother = new FoolBrother();
            //引用fool
            brother.YoungFool = fool;
        }

        private void btnAlloc_Click(object sender, EventArgs e)
        {
            var i = 10;
            //AllocalHugeMem 会申请10M的内存
            fool.AllocalHugeMem();
        }

        private void btnWrongRelease_Click(object sender, EventArgs e)
        {
            //虽然fool 指向null,但 brother保留了对fool的引用,GC无效果.内存泄露
            fool = null;
            GCRelease();
        }

        private void btnRightRelease_Click(object sender, EventArgs e)
        {
            //消除 brother 对fool的引用,GC效果明显
            fool = null;
            brother = null;
            GCRelease();
        }

        private void GCRelease()
        {
            GC.Collect();
            GC.WaitForPendingFinalizers();
            GC.Collect();
        }
    }

    public class Fool
    {
        private IList<byte[]> list = new List<byte[]>();

        public void AllocalHugeMem()
        {
            var buffer = new byte[10 * 1024 * 1024];
            for (int i = 0; i < buffer.Length; i++)
            {
                buffer[i] = 1;
            }
            list.Add(buffer);
        }
    }

    public class FoolBrother
    {
        public Fool YoungFool
        {
            get;
            set;
        }
    }
}
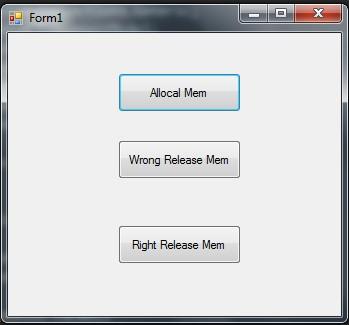
- 使用.Net Memory Profiler 启动 Demo.exe,
- 先抓个快照(Collect Snapshot)
- 多点击几次 Allocal Mem 按钮,申请内存,再点击 Wrong Release Mem 按钮.再抓个快照.
此时:
            //虽然fool 指向null,但 brother保留了对fool的引用,GC无效果.内存泄露
            fool = null;
            GCRelease();
由于有个 FoolBrother 对象强引用了fool对象,fool对象无法被GC掉. 通过强大的工具,我们可以直观的看到:
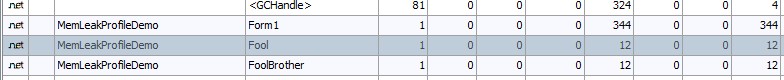
有一个Fool 对象instance 未被释放.双击该行查看:

可以看到该对象引用的计数是1,GC 的Age,右边是创建该对象的堆栈.
双击Instances 行.出现清晰的引用关系图:
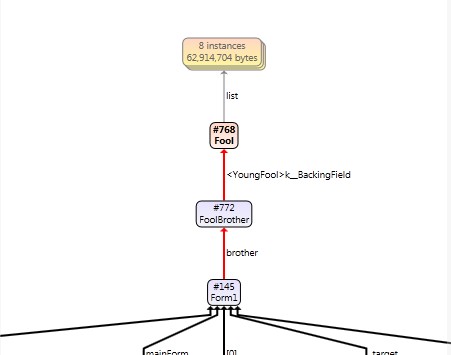
一切尽在眼前!
反之,可以点击 Right Release Mem 按钮,将FoolBrother 对象清除,再抓快照,对比效果.
回头有时间再用此Demo 介绍如何使用Windbg SOS扩展找出内存泄露.

 浙公网安备 33010602011771号