elasticsearch+logstash+redis+kibana 实时分析nginx日志
目录
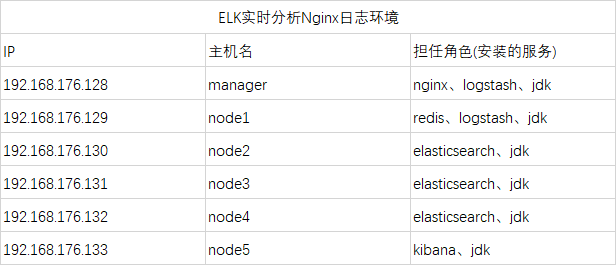
1. 部署环境
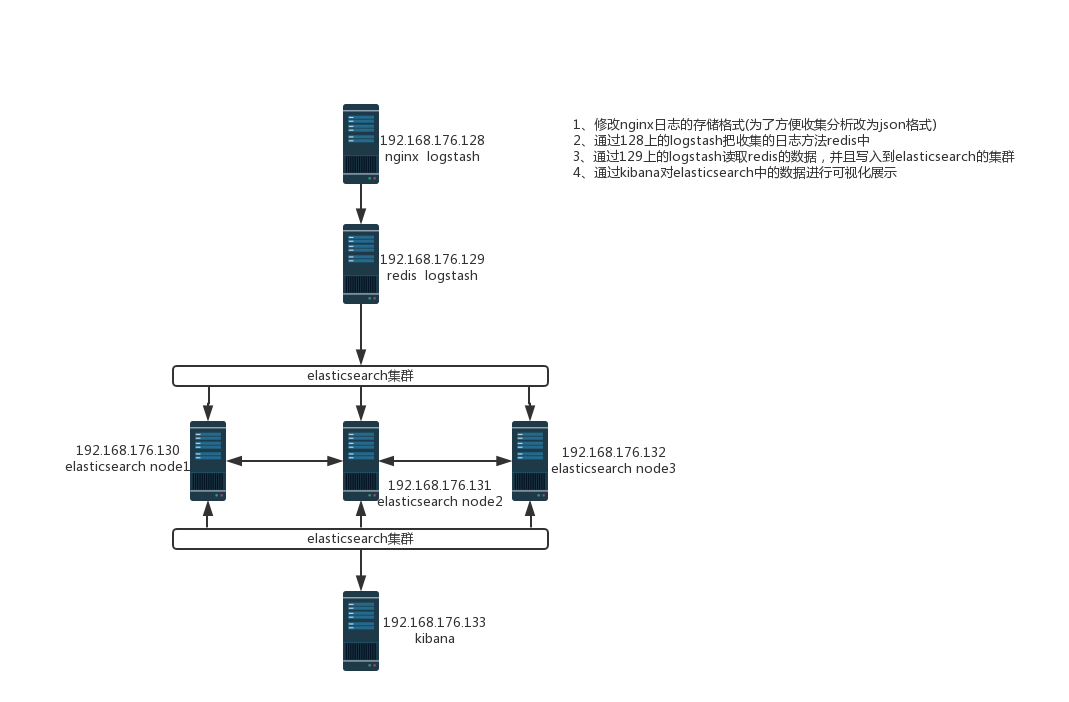
2. 架构拓扑
3. nginx安装
安装在192.168.176.128服务器上
这里安装就简单粗暴了直接yum安装nginx
|
1
2
3
4
5
6
7
8
9
|
[root@manager ~]# yum -y install epel-release[root@manager ~]# yum -y install nginx检查是否安装成功(这里选择了查看版本号)[root@manager ~]# nginx -Vnginx version: nginx/1.12.2built by gcc 4.8.5 20150623 (Red Hat 4.8.5-16) (GCC)built with OpenSSL 1.0.2k-fips 26 Jan 2017TLS SNI support enabledconfigure arguments: --prefix=/usr/share/nginx --sbin-path=/usr/sbin/nginx --modules-path=/usr/lib64/nginx/modules --conf-path=/etc/nginx/nginx.conf --error-log-path=/var/log/nginx/error.log --http-log-path=/var/log/nginx/access.log --http-client-body-temp-path=/var/lib/nginx/tmp/client_body --http-proxy-temp-path=/var/lib/nginx/tmp/proxy --http-fastcgi-temp-path=/var/lib/nginx/tmp/fastcgi --http-uwsgi-temp-path=/var/lib/nginx/tmp/uwsgi --http-scgi-temp-path=/var/lib/nginx/tmp/scgi --pid-path=/run/nginx.pid --lock-path=/run/lock/subsys/nginx --user=nginx --group=nginx --with-file-aio --with-ipv6 --with-http_auth_request_module --with-http_ssl_module --with-http_v2_module --with-http_realip_module --with-http_addition_module --with-http_xslt_module=dynamic --with-http_image_filter_module=dynamic --with-http_geoip_module=dynamic --with-http_sub_module --with-http_dav_module --with-http_flv_module --with-http_mp4_module --with-http_gunzip_module --with-http_gzip_static_module --with-http_random_index_module --with-http_secure_link_module --with-http_degradation_module --with-http_slice_module --with-http_stub_status_module --with-http_perl_module=dynamic --with-mail=dynamic --with-mail_ssl_module --with-pcre --with-pcre-jit --with-stream=dynamic --with-stream_ssl_module --with-google_perftools_module --with-debug --with-cc-opt='-O2 -g -pipe -Wall -Wp,-D_FORTIFY_SOURCE=2 -fexceptions -fstack-protector-strong --param=ssp-buffer-size=4 -grecord-gcc-switches -specs=/usr/lib/rpm/redhat/redhat-hardened-cc1 -m64 -mtune=generic' --with-ld-opt='-Wl,-z,relro -specs=/usr/lib/rpm/redhat/redhat-hardened-ld -Wl,-E' |
设置日志的格式(改为json格式)并测试查看日志
|
1
2
3
4
5
6
7
8
9
10
11
12
13
14
15
16
17
18
19
20
|
[root@manager ~]# cat /etc/nginx/nginx.conf修改成下面的部分(运维的一看就能明白是什么意思)http { #log_format main '$remote_addr - $remote_user [$time_local] "$request" ' # '$status $body_bytes_sent "$http_referer" ' # '"$http_user_agent" "$http_x_forwarded_for"'; log_format json '{ "@timestamp": "$time_iso8601", ' '"remote_addr": "$remote_addr", ' '"remote_user": "$remote_user", ' '"body_bytes_sent": "$body_bytes_sent", ' '"request_time": "$request_time", ' '"status": "$status", ' '"request_uri": "$request_uri", ' '"request_method": "$request_method", ' '"http_referrer": "$http_referer", ' '"http_x_forwarded_for": "$http_x_forwarded_for", ' '"http_user_agent": "$http_user_agent"}'; access_log /var/log/nginx/access.log json; |
 nginx.conf
检查并启动 nginx 服务
|
1
2
3
4
5
6
7
|
[root@manager ~]# nginx -tnginx: the configuration file /etc/nginx/nginx.conf syntax is oknginx: configuration file /etc/nginx/nginx.conf test is successful[root@manager ~]# systemctl start nginx[root@manager ~]# netstat -lntup | grep nginxtcp 0 0 0.0.0.0:80 0.0.0.0:* LISTEN 1888/nginx: master tcp6 0 0 :::80 :::* LISTEN 1888/nginx: master |
测试访问nginx并查看日志记录
|
1
2
3
4
5
6
|
# 测试[root@manager ~]# curl 192.168.176.128查看日志(这里可以看到我们自定义的日志格式输出)[root@manager ~]# cat /var/log/nginx/access.log { "@timestamp": "2018-11-18T01:28:49-05:00", "remote_addr": "192.168.176.128", "remote_user": "-", "body_bytes_sent": "3700", "request_time": "0.000", "status": "200", "request_uri": "/", "request_method": "GET", "http_referrer": "-", "http_x_forwarded_for": "-", "http_user_agent": "curl/7.29.0"} |
安装JDK
|
1
|
[root@manager ELK]# yum -y install java-1.8.0-openjdk |
Nginx 就先到这里,对我们的整个环境这样就足够了
4. redis安装
安装在192.168.176.129服务器上
redis 也是直接yum简单粗暴的安装了
|
1
2
3
4
5
|
[root@node1 ~]# yum -y install epel-release[root@node1 ~]# yum -y install redis检查是否安装成功(查看版本)[root@node1 ~]# redis-server -vRedis server v=3.2.12 sha=00000000:0 malloc=jemalloc-3.6.0 bits=64 build=7897e7d0e13773f |
修改redis配置文件(监听地址和密码)
|
1
2
3
4
|
[root@node1 ~]# vim /etc/redis.conf 修改两个地方bind 127.0.0.1 改为 bind 0.0.0.0# requirepass foot 去掉注释 foot改为自己的密码 |
查看修改后的配置文件
|
1
2
3
4
5
6
7
8
9
10
11
12
13
14
15
16
17
|
监听地址[root@node1 ~]# cat /etc/redis.conf | grep bind# By default, if no "bind" configuration directive is specified, Redis listens# the "bind" configuration directive, followed by one or more IP addresses.# bind 192.168.1.100 10.0.0.1# bind 127.0.0.1 ::1# internet, binding to all the interfaces is dangerous and will expose the# following bind directive, that will force Redis to listen only intobind 0.0.0.0# 1) The server is not binding explicitly to a set of addresses using the# "bind" directive.# are explicitly listed using the "bind" directive.密码[root@node1 ~]# cat /etc/redis.conf | grep requirepass# If the master is password protected (using the "requirepass" configurationrequirepass 123456 |
启动服务并登录测试redis
|
1
2
3
4
5
6
7
8
9
10
11
12
13
14
15
|
[root@node1 ~]# systemctl start redis[root@node1 ~]# netstat -lntup | grep redistcp 0 0 0.0.0.0:6379 0.0.0.0:* LISTEN 2139/redis-server 0# 不加密码登录(没有权限执行指令)[root@node1 ~]# redis-cli127.0.0.1:6379> KEYS *(error) NOAUTH Authentication required.127.0.0.1:6379># 添加密码登录[root@node1 ~]# redis-cli -a 123456127.0.0.1:6379> KEYS *(empty list or set)127.0.0.1:6379> |
安装JDK
|
1
|
[root@node1 ELK]# yum -y install java-1.8.0-openjdk |
redis也是可以了 结束redis部署
5. elasticsearch集群部署
下面的设置安装源在整个环境的所有环境都要执行
|
1
2
3
4
5
6
7
8
9
10
11
12
13
14
|
# 添加ELK的yum源[root@node2 ~]# rpm --import https://artifacts.elastic.co/GPG-KEY-elasticsearch[root@node2 ~]# vim /etc/yum.repos.d/elasticsearch.repo[elasticsearch-6.x]name=Elasticsearch repository for 6.x packagesbaseurl=https://artifacts.elastic.co/packages/6.x/yumgpgcheck=1gpgkey=https://artifacts.elastic.co/GPG-KEY-elasticsearchenabled=1autorefresh=1type=rpm-md# 安装jdk和elasticsearch(这里需要注意的是jdk一定是1.8.0以上的版本)[root@node2 ~]# yum -y install java-1.8.0-openjdk |
在192.168.176.130、131、132 机器上执行
|
1
2
3
|
[root@node1 ~]# yum -y install elasticsearch[root@node2 ~]# yum -y install elasticsearch[root@node3 ~]# yum -y install elasticsearch |
温馨提示:以上安装要在三台机器上都要执行
配置文件修改
温馨提示:三台机器上都要修改配置文件
三台机器配置文件的不同之处
|
1
2
3
|
node.name: 这里的名称每台机器都不能一样network.host: 这里是本服务器的地址 |
每台机器的配置文件
elasticsearch.yml(130配置文件) elasticsearch.yml(131配置文件) elasticsearch.yml(132配置文件)启动elasticsearch服务
温馨提示:三台机器都要启动(elasticsearch监听的端口是9200和9300)
|
1
2
3
|
[root@node2 ELK]# systemctl start elasticsearch[root@node3 ELK]# systemctl start elasticsearch[root@node4 ELK]# systemctl start elasticsearch |
检查elasticsearch集群
elasticsearch 采用的是接口的方式去查看数据和状态信息
|
1
2
3
4
5
6
7
8
9
10
11
|
# 查看集群状态[root@node2 ELK]# curl -X GET "192.168.176.130:9200/_cat/health?v"epoch timestamp cluster status node.total node.data shards pri relo init unassign pending_tasks max_task_wait_time active_shards_percent1542525784 07:23:04 elk-cluster green 3 3 0 0 0 0 0 0 - 100.0%# 查看集群性能[root@node2 ELK]# curl -X GET "192.168.176.130:9200/_cat/nodes?v"ip heap.percent ram.percent cpu load_1m load_5m load_15m node.role master name192.168.176.131 26 96 2 0.05 0.07 0.05 mdi * node-2192.168.176.132 26 96 3 0.06 0.06 0.05 mdi - node-3192.168.176.130 25 95 0 0.00 0.02 0.05 mdi - node-1 |
安装elasticsearch的可视化web工具
温馨提示:只在一台机器上安装即可
|
1
2
3
4
5
6
7
|
[root@node2 ELK]# yum -y install epel-release[root@node2 ELK]# yum -y install git[root@node2 ELK]# yum -y install nodejs git clone git://github.com/mobz/elasticsearch-head.git cd elasticsearch-head npm install npm run start |
6. logstash安装
这个环境中我们有两台服务器需要安装logstash 一个收集数据放到redis一个在redis中读放大elasticsearch中
192.168.176.128 这台机器负责收集并写到redis
192.168.176.129 这台机器负责读redis数据写的elasticsearch中
在两台机器上安装logstash
|
1
2
3
4
5
6
7
8
9
|
[root@manager ~]# yum -y install logstash[root@node1 ~]# yum -y install logstash检查安装是否成功(检查版本)[root@manager ELK]# /usr/share/logstash/bin/logstash --versionlogstash 6.5.0[root@node1 ELK]# /usr/share/logstash/bin/logstash --versionlogstash 6.5.0 |
在192.168.176.128服务器编写配置logstash收集并存入redis的配置文件
|
1
2
3
4
5
6
7
8
9
10
11
12
13
14
15
16
17
18
19
20
21
22
|
# 这个文件不存在,需要自己编辑[root@manager ELK]# cat /etc/logstash/conf.d/logstash-to-redis.confinput { file { path => ["/var/log/nginx/access.log"] type => "nginx-access" tags => ["nginxlog","test"] start_position => "beginning" }}filter {}output { redis { host => ["192.168.176.129"] password => "123456" db => "0" data_type => "list" key => "nginxlog" }} |
这里的配置文件就不解释了,elasticsearch的具体参数介绍请看:elasticsearch详解
检查配置文件
|
1
2
3
4
5
6
7
8
|
[root@manager ELK]# /usr/share/logstash/bin/logstash -t -f /etc/logstash/conf.d/logstash-to-redis.confWARNING: Could not find logstash.yml which is typically located in $LS_HOME/config or /etc/logstash. You can specify the path using --path.settings. Continuing using the defaultsCould not find log4j2 configuration at path /usr/share/logstash/config/log4j2.properties. Using default config which logs errors to the console[INFO ] 2018-11-18 03:01:37.282 [main] writabledirectory - Creating directory {:setting=>"path.queue", :path=>"/usr/share/logstash/data/queue"}[INFO ] 2018-11-18 03:01:37.288 [main] writabledirectory - Creating directory {:setting=>"path.dead_letter_queue", :path=>"/usr/share/logstash/data/dead_letter_queue"}[WARN ] 2018-11-18 03:01:37.534 [LogStash::Runner] multilocal - Ignoring the 'pipelines.yml' file because modules or command line options are specifiedConfiguration OK[INFO ] 2018-11-18 03:01:38.918 [LogStash::Runner] runner - Using config.test_and_exit mode. Config Validation Result: OK. Exiting Logstash |
启动logstash
|
1
2
3
4
5
6
7
8
9
10
11
12
|
[root@manager ELK]# /usr/share/logstash/bin/logstash -r -f /etc/logstash/conf.d/logstash-to-redis.confWARNING: Could not find logstash.yml which is typically located in $LS_HOME/config or /etc/logstash. You can specify the path using --path.settings. Continuing using the defaultsCould not find log4j2 configuration at path /usr/share/logstash/config/log4j2.properties. Using default config which logs errors to the console[WARN ] 2018-11-18 03:04:02.794 [LogStash::Runner] multilocal - Ignoring the 'pipelines.yml' file because modules or command line options are specified[INFO ] 2018-11-18 03:04:02.805 [LogStash::Runner] runner - Starting Logstash {"logstash.version"=>"6.5.0"}[INFO ] 2018-11-18 03:04:02.826 [LogStash::Runner] agent - No persistent UUID file found. Generating new UUID {:uuid=>"14eb7761-ca71-41f7-b67d-f640c80d46ba", :path=>"/usr/share/logstash/data/uuid"}[INFO ] 2018-11-18 03:04:04.441 [Converge PipelineAction::Create<main>] pipeline - Starting pipeline {:pipeline_id=>"main", "pipeline.workers"=>4, "pipeline.batch.size"=>125, "pipeline.batch.delay"=>50}[INFO ] 2018-11-18 03:04:19.710 [[main]>worker3] file - No sincedb_path set, generating one based on the "path" setting {:sincedb_path=>"/usr/share/logstash/data/plugins/inputs/file/.sincedb_d883144359d3b4f516b37dba51fab2a2", :path=>["/var/log/nginx/access.log"]}[INFO ] 2018-11-18 03:04:19.737 [Converge PipelineAction::Create<main>] pipeline - Pipeline started successfully {:pipeline_id=>"main", :thread=>"#<Thread:0x3e9da1b7 run>"}[INFO ] 2018-11-18 03:04:19.789 [Ruby-0-Thread-1: /usr/share/logstash/lib/bootstrap/environment.rb:6] agent - Pipelines running {:count=>1, :running_pipelines=>[:main], :non_running_pipelines=>[]}[INFO ] 2018-11-18 03:04:19.832 [[main]<file] observingtail - START, creating Discoverer, Watch with file and sincedb collections[INFO ] 2018-11-18 03:04:20.058 [Api Webserver] agent - Successfully started Logstash API endpoint {:port=>9600} |
这里表示启动成功,去192.168.176.129的redis上查看是否有数据
|
1
2
3
4
5
6
7
8
|
[root@node1 ELK]# redis-cli -a 123456127.0.0.1:6379> KEYS *1) "nginxlog"127.0.0.1:6379> LLEN nginxlog(integer) 1127.0.0.1:6379> LRANGE nginxlog 0 11) "{\"message\":\"{ \\\"@timestamp\\\": \\\"2018-11-18T01:28:49-05:00\\\", \\\"remote_addr\\\": \\\"192.168.176.128\\\", \\\"remote_user\\\": \\\"-\\\", \\\"body_bytes_sent\\\": \\\"3700\\\", \\\"request_time\\\": \\\"0.000\\\", \\\"status\\\": \\\"200\\\", \\\"request_uri\\\": \\\"/\\\", \\\"request_method\\\": \\\"GET\\\", \\\"http_referrer\\\": \\\"-\\\", \\\"http_x_forwarded_for\\\": \\\"-\\\", \\\"http_user_agent\\\": \\\"curl/7.29.0\\\"}\",\"@timestamp\":\"2018-11-18T08:04:20.185Z\",\"host\":\"manager\",\"tags\":[\"nginxlog\",\"test\"],\"path\":\"/var/log/nginx/access.log\",\"@version\":\"1\",\"type\":\"nginx-access\"}"127.0.0.1:6379> |
在192.168.176.129上编写读取redis数据写到elasticsearch中的配置文件
|
1
2
3
4
5
6
7
8
9
10
11
12
13
14
15
16
17
18
19
20
21
22
23
|
[root@node1 ELK]# cat /etc/logstash/conf.d/logstash-from-redis.confinput { redis { host => "192.168.176.129" port => 6379 password => "123456" db => "0" data_type => "list" key => "nginxlog" }}filter {}output { elasticsearch { hosts => ["http://192.168.176.130:9200","http://192.168.176.131:9200","http://192.168.176.132:9200"] index => "nginxlogs-%{+YYYY.MM.dd}" } stdout { codec => rubydebug }} |
检查配置文件
|
1
2
3
4
5
6
|
[root@node1 ELK]# /usr/share/logstash/bin/logstash -t -f /etc/logstash/conf.d/logstash-from-redis.confWARNING: Could not find logstash.yml which is typically located in $LS_HOME/config or /etc/logstash. You can specify the path using --path.settings. Continuing using the defaultsCould not find log4j2 configuration at path /usr/share/logstash/config/log4j2.properties. Using default config which logs errors to the console[WARN ] 2018-11-18 03:12:45.966 [LogStash::Runner] multilocal - Ignoring the 'pipelines.yml' file because modules or command line options are specifiedConfiguration OK[INFO ] 2018-11-18 03:12:47.990 [LogStash::Runner] runner - Using config.test_and_exit mode. Config Validation Result: OK. Exiting Logstash |
启动logstash
|
1
2
3
4
5
6
7
8
9
10
11
12
13
14
15
16
17
18
19
20
21
22
23
24
|
[root@node1 ELK]# /usr/share/logstash/bin/logstash -r -f /etc/logstash/conf.d/logstash-from-redis.conf WARNING: Could not find logstash.yml which is typically located in $LS_HOME/config or /etc/logstash. You can specify the path using --path.settings. Continuing using the defaultsCould not find log4j2 configuration at path /usr/share/logstash/config/log4j2.properties. Using default config which logs errors to the console[WARN ] 2018-11-18 03:14:53.077 [LogStash::Runner] multilocal - Ignoring the 'pipelines.yml' file because modules or command line options are specified[INFO ] 2018-11-18 03:14:53.090 [LogStash::Runner] runner - Starting Logstash {"logstash.version"=>"6.5.0"}[INFO ] 2018-11-18 03:14:53.110 [LogStash::Runner] agent - No persistent UUID file found. Generating new UUID {:uuid=>"f50b6c39-c81a-4a9d-b329-82aea82ddb2d", :path=>"/usr/share/logstash/data/uuid"}[INFO ] 2018-11-18 03:14:55.989 [Converge PipelineAction::Create<main>] pipeline - Starting pipeline {:pipeline_id=>"main", "pipeline.workers"=>4, "pipeline.batch.size"=>125, "pipeline.batch.delay"=>50}[INFO ] 2018-11-18 03:14:56.334 [[main]-pipeline-manager] elasticsearch - Elasticsearch pool URLs updated {:changes=>{:removed=>[], :added=>[http://192.168.176.130:9200/, http://192.168.176.131:9200/, http://192.168.176.132:9200/]}}[INFO ] 2018-11-18 03:14:56.340 [[main]-pipeline-manager] elasticsearch - Running health check to see if an Elasticsearch connection is working {:healthcheck_url=>http://192.168.176.130:9200/, :path=>"/"}[WARN ] 2018-11-18 03:14:56.481 [[main]-pipeline-manager] elasticsearch - Restored connection to ES instance {:url=>"http://192.168.176.130:9200/"}[INFO ] 2018-11-18 03:14:56.642 [[main]-pipeline-manager] elasticsearch - ES Output version determined {:es_version=>6}[WARN ] 2018-11-18 03:14:56.646 [[main]-pipeline-manager] elasticsearch - Detected a 6.x and above cluster: the `type` event field won't be used to determine the document _type {:es_version=>6}[INFO ] 2018-11-18 03:14:56.647 [[main]-pipeline-manager] elasticsearch - Running health check to see if an Elasticsearch connection is working {:healthcheck_url=>http://192.168.176.131:9200/, :path=>"/"}[WARN ] 2018-11-18 03:14:56.720 [[main]-pipeline-manager] elasticsearch - Restored connection to ES instance {:url=>"http://192.168.176.131:9200/"}[INFO ] 2018-11-18 03:14:56.746 [[main]-pipeline-manager] elasticsearch - Running health check to see if an Elasticsearch connection is working {:healthcheck_url=>http://192.168.176.132:9200/, :path=>"/"}[WARN ] 2018-11-18 03:14:56.811 [[main]-pipeline-manager] elasticsearch - Restored connection to ES instance {:url=>"http://192.168.176.132:9200/"}[INFO ] 2018-11-18 03:14:56.854 [[main]-pipeline-manager] elasticsearch - New Elasticsearch output {:class=>"LogStash::Outputs::ElasticSearch", :hosts=>["http://192.168.176.130:9200", "http://192.168.176.131:9200", "http://192.168.176.132:9200"]}[INFO ] 2018-11-18 03:14:56.892 [Ruby-0-Thread-5: :1] elasticsearch - Using mapping template from {:path=>nil}[INFO ] 2018-11-18 03:14:56.908 [Ruby-0-Thread-5: :1] elasticsearch - Attempting to install template {:manage_template=>{"template"=>"logstash-*", "version"=>60001, "settings"=>{"index.refresh_interval"=>"5s"}, "mappings"=>{"_default_"=>{"dynamic_templates"=>[{"message_field"=>{"path_match"=>"message", "match_mapping_type"=>"string", "mapping"=>{"type"=>"text", "norms"=>false}}}, {"string_fields"=>{"match"=>"*", "match_mapping_type"=>"string", "mapping"=>{"type"=>"text", "norms"=>false, "fields"=>{"keyword"=>{"type"=>"keyword", "ignore_above"=>256}}}}}], "properties"=>{"@timestamp"=>{"type"=>"date"}, "@version"=>{"type"=>"keyword"}, "geoip"=>{"dynamic"=>true, "properties"=>{"ip"=>{"type"=>"ip"}, "location"=>{"type"=>"geo_point"}, "latitude"=>{"type"=>"half_float"}, "longitude"=>{"type"=>"half_float"}}}}}}}}[INFO ] 2018-11-18 03:14:56.913 [[main]>worker3] redis - Registering Redis {:identity=>"redis://<password>@192.168.176.129:6379/0 list:nginxlog"}[INFO ] 2018-11-18 03:14:56.945 [Converge PipelineAction::Create<main>] pipeline - Pipeline started successfully {:pipeline_id=>"main", :thread=>"#<Thread:0x300817f0 run>"}[INFO ] 2018-11-18 03:14:57.019 [Ruby-0-Thread-1: /usr/share/logstash/lib/bootstrap/environment.rb:6] agent - Pipelines running {:count=>1, :running_pipelines=>[:main], :non_running_pipelines=>[]}[INFO ] 2018-11-18 03:14:57.038 [Ruby-0-Thread-5: :1] elasticsearch - Installing elasticsearch template to _template/logstash[INFO ] 2018-11-18 03:14:57.373 [Api Webserver] agent - Successfully started Logstash API endpoint {:port=>9600} |
上的输出表示启动成功,下面还会输出一些数据

这些就是我们的日志数据,在redis里面读出来的一个debug信息
我们查看129中的redis是不是已经空了
|
1
2
3
4
5
6
|
[root@node1 ~]# redis-cli -a 123456127.0.0.1:6379> LLEN nginxlog(integer) 11127.0.0.1:6379> LLEN nginxlog(integer) 0127.0.0.1:6379> |
查看elasticsearch里面是不是多出来一个索引
|
1
2
3
4
|
[root@node2 elasticsearch-head-master]# curl "192.168.176.130:9200/_cat/indices?v" health status index uuid pri rep docs.count docs.deleted store.size pri.store.sizegreen open bank kk8k6Y8eRCWiLDR3fBCoHA 5 1 1000 0 958.1kb 475.1kbgreen open nginxlogs-2018.11.18 IocfOyAIT4-cxC-7O9kMtw 5 1 11 0 72.1kb 36kb |
这里的nginxlogs-2018.11.18索引nginx的日志数据
接下了就用kibana展示出啦
7. kibana安装
在192.168.176.133的服务器上安装kibana
|
1
2
3
4
|
[root@node5 ~]# yum -y install kibana# 查看是否安装成功(查看版本)[root@node5 ELK]# /usr/share/kibana/bin/kibana --version6.5.0 |
编辑kibana的配置文件
需要修改的地方:
|
1
2
3
4
5
6
7
8
|
# 监听端口server.port:5601 去掉注释即可# 监听地址server.host: "localhost" 去掉注释修改为 server.host: "0.0.0.0" # elasticsearch地址elasticsearch.url: "http://localhost:9200" 去掉注释修改为 elasticsearch.url: "http://192.168.176.130:9200" |
kibana.yml
在配置文件中还有很多的配置项,会有一篇专门的文章介绍
启动kibana
|
1
2
3
|
[root@node5 ELK]# systemctl start kibana[root@node5 ELK]# netstat -lntup | grep 5601tcp 0 0 0.0.0.0:5601 0.0.0.0:* LISTEN 2693/node |
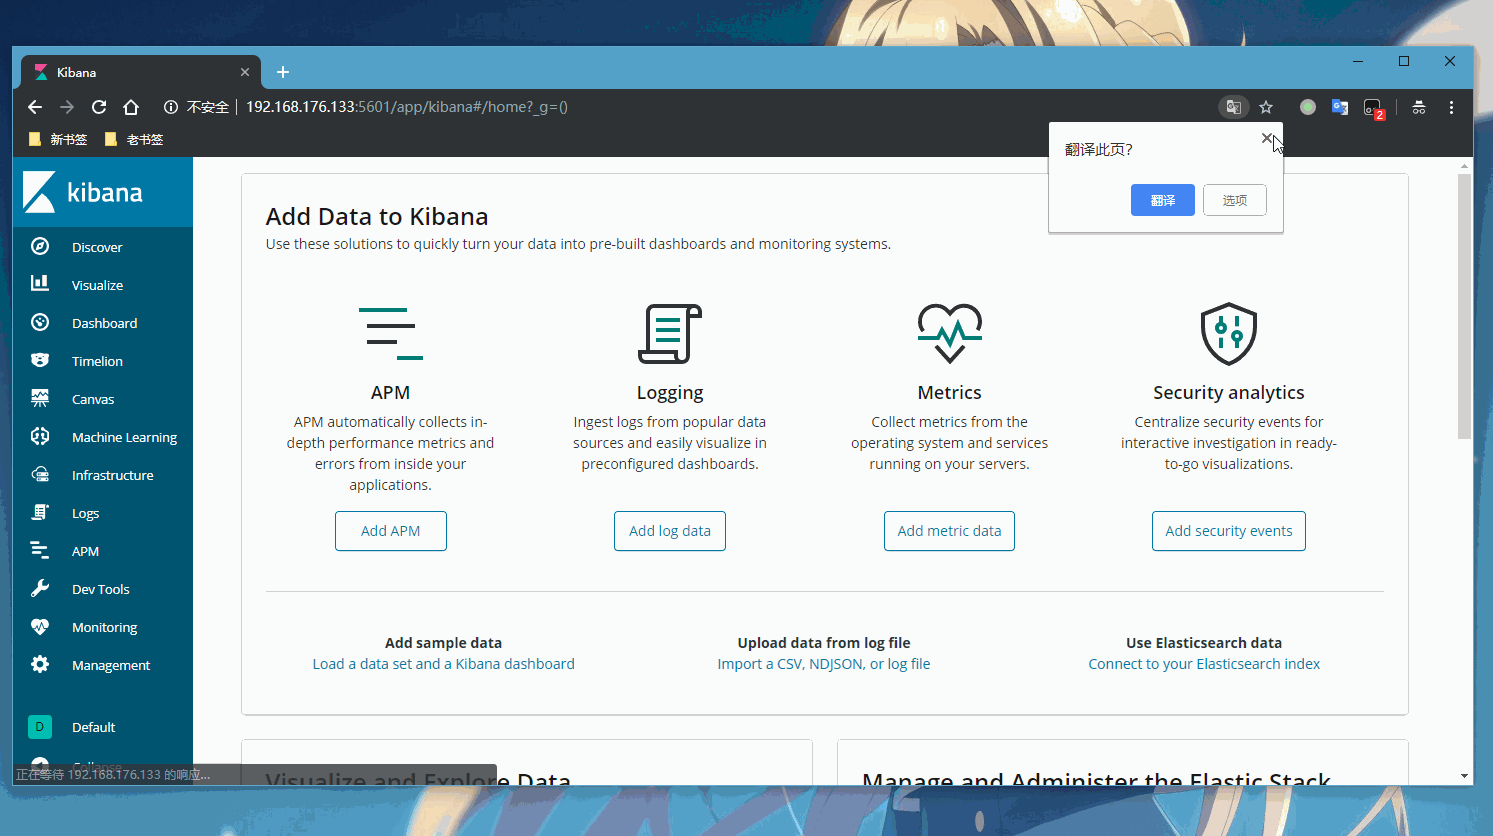
登录kibana的web页面查看我们nginx实时收集的日志

 浙公网安备 33010602011771号