
elasticsearch+logstash+redis+kibana 实时分析nginx日志
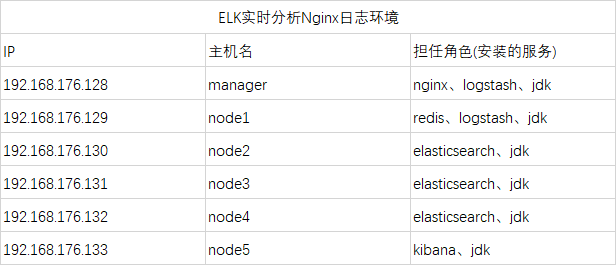
1. 部署环境
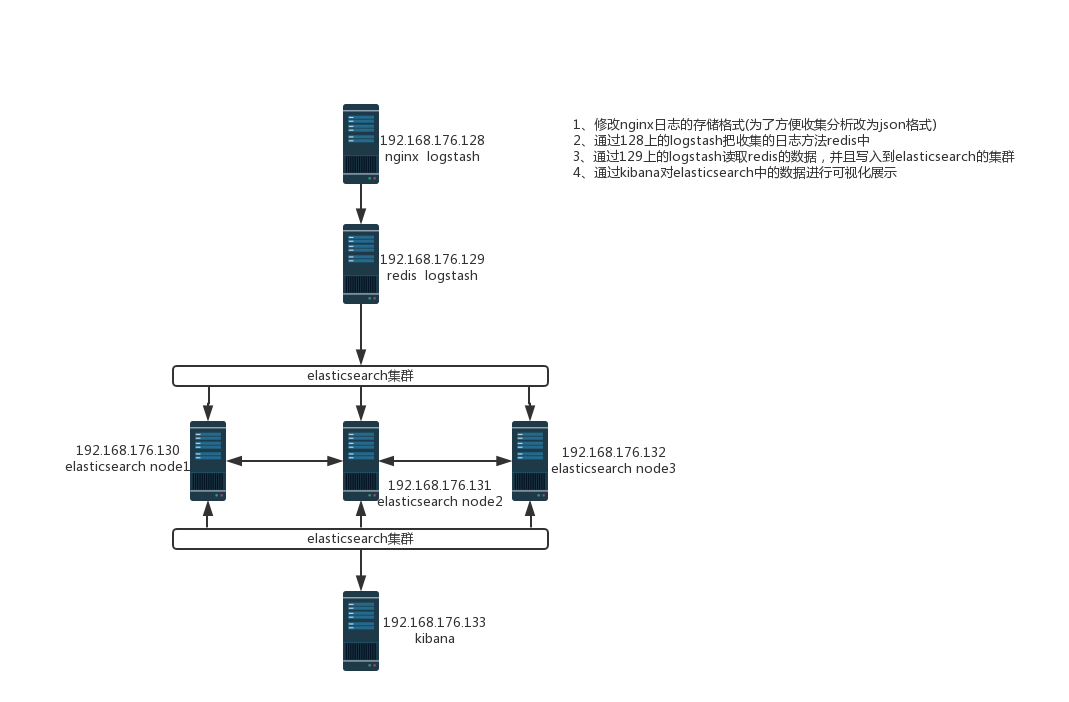
2. 架构拓扑
3. nginx安装
安装在192.168.176.128服务器上
这里安装就简单粗暴了直接yum安装nginx
[root@manager ~]# yum -y install epel-release
[root@manager ~]# yum -y install nginx
检查是否安装成功(这里选择了查看版本号)
[root@manager ~]# nginx -V
nginx version: nginx/1.12.2
built by gcc 4.8.5 20150623 (Red Hat 4.8.5-16) (GCC)
built with OpenSSL 1.0.2k-fips  26 Jan 2017
TLS SNI support enabled
configure arguments: --prefix=/usr/share/nginx --sbin-path=/usr/sbin/nginx --modules-path=/usr/lib64/nginx/modules --conf-path=/etc/nginx/nginx.conf --error-log-path=/var/log/nginx/error.log --http-log-path=/var/log/nginx/access.log --http-client-body-temp-path=/var/lib/nginx/tmp/client_body --http-proxy-temp-path=/var/lib/nginx/tmp/proxy --http-fastcgi-temp-path=/var/lib/nginx/tmp/fastcgi --http-uwsgi-temp-path=/var/lib/nginx/tmp/uwsgi --http-scgi-temp-path=/var/lib/nginx/tmp/scgi --pid-path=/run/nginx.pid --lock-path=/run/lock/subsys/nginx --user=nginx --group=nginx --with-file-aio --with-ipv6 --with-http_auth_request_module --with-http_ssl_module --with-http_v2_module --with-http_realip_module --with-http_addition_module --with-http_xslt_module=dynamic --with-http_image_filter_module=dynamic --with-http_geoip_module=dynamic --with-http_sub_module --with-http_dav_module --with-http_flv_module --with-http_mp4_module --with-http_gunzip_module --with-http_gzip_static_module --with-http_random_index_module --with-http_secure_link_module --with-http_degradation_module --with-http_slice_module --with-http_stub_status_module --with-http_perl_module=dynamic --with-mail=dynamic --with-mail_ssl_module --with-pcre --with-pcre-jit --with-stream=dynamic --with-stream_ssl_module --with-google_perftools_module --with-debug --with-cc-opt='-O2 -g -pipe -Wall -Wp,-D_FORTIFY_SOURCE=2 -fexceptions -fstack-protector-strong --param=ssp-buffer-size=4 -grecord-gcc-switches -specs=/usr/lib/rpm/redhat/redhat-hardened-cc1 -m64 -mtune=generic' --with-ld-opt='-Wl,-z,relro -specs=/usr/lib/rpm/redhat/redhat-hardened-ld -Wl,-E'
设置日志的格式(改为json格式)并测试查看日志
[root@manager ~]# cat /etc/nginx/nginx.conf
修改成下面的部分(运维的一看就能明白是什么意思)
http {
    #log_format  main  '$remote_addr - $remote_user [$time_local] "$request" '
    #                  '$status $body_bytes_sent "$http_referer" '
    #                  '"$http_user_agent" "$http_x_forwarded_for"';

    log_format json '{ "@timestamp": "$time_iso8601", '
         '"remote_addr": "$remote_addr", '
         '"remote_user": "$remote_user", '
         '"body_bytes_sent": "$body_bytes_sent", '
         '"request_time": "$request_time", '
         '"status": "$status", '
         '"request_uri": "$request_uri", '
         '"request_method": "$request_method", '
         '"http_referrer": "$http_referer", '
         '"http_x_forwarded_for": "$http_x_forwarded_for", '
         '"http_user_agent": "$http_user_agent"}';

    access_log  /var/log/nginx/access.log  json;


  1 # For more information on configuration, see:
  2 #   * Official English Documentation: http://nginx.org/en/docs/
  3 #   * Official Russian Documentation: http://nginx.org/ru/docs/
  4
  5 user nginx;
  6 worker_processes auto;
  7 error_log /var/log/nginx/error.log;
  8 pid /run/nginx.pid;
  9
 10 # Load dynamic modules. See /usr/share/nginx/README.dynamic.
 11 include /usr/share/nginx/modules/*.conf;
 12
 13 events {
 14     worker_connections 1024;
 15 }
 16
 17 http {
 18     #log_format  main  '$remote_addr - $remote_user [$time_local] "$request" '
 19     #                  '$status $body_bytes_sent "$http_referer" '
 20     #                  '"$http_user_agent" "$http_x_forwarded_for"';
 21
 22     log_format json '{ "@timestamp": "$time_iso8601", '
 23          '"remote_addr": "$remote_addr", '
 24          '"remote_user": "$remote_user", '
 25          '"body_bytes_sent": "$body_bytes_sent", '
 26          '"request_time": "$request_time", '
 27          '"status": "$status", '
 28          '"request_uri": "$request_uri", '
 29          '"request_method": "$request_method", '
 30          '"http_referrer": "$http_referer", '
 31          '"http_x_forwarded_for": "$http_x_forwarded_for", '
 32          '"http_user_agent": "$http_user_agent"}';
 33
 34     access_log  /var/log/nginx/access.log  json;
 35
 36     sendfile            on;
 37     tcp_nopush          on;
 38     tcp_nodelay         on;
 39     keepalive_timeout   65;
 40     types_hash_max_size 2048;
 41
 42     include             /etc/nginx/mime.types;
 43     default_type        application/octet-stream;
 44
 45     # Load modular configuration files from the /etc/nginx/conf.d directory.
 46     # See http://nginx.org/en/docs/ngx_core_module.html#include
 47     # for more information.
 48     include /etc/nginx/conf.d/*.conf;
 49
 50     server {
 51         listen       80 default_server;
 52         listen       [::]:80 default_server;
 53         server_name  _;
 54         root         /usr/share/nginx/html;
 55
 56         # Load configuration files for the default server block.
 57         include /etc/nginx/default.d/*.conf;
 58
 59         location / {
 60         }
 61
 62         error_page 404 /404.html;
 63             location = /40x.html {
 64         }
 65
 66         error_page 500 502 503 504 /50x.html;
 67             location = /50x.html {
 68         }
 69     }
 70
 71 # Settings for a TLS enabled server.
 72 #
 73 #    server {
 74 #        listen       443 ssl http2 default_server;
 75 #        listen       [::]:443 ssl http2 default_server;
 76 #        server_name  _;
 77 #        root         /usr/share/nginx/html;
 78 #
 79 #        ssl_certificate "/etc/pki/nginx/server.crt";
 80 #        ssl_certificate_key "/etc/pki/nginx/private/server.key";
 81 #        ssl_session_cache shared:SSL:1m;
 82 #        ssl_session_timeout  10m;
 83 #        ssl_ciphers HIGH:!aNULL:!MD5;
 84 #        ssl_prefer_server_ciphers on;
 85 #
 86 #        # Load configuration files for the default server block.
 87 #        include /etc/nginx/default.d/*.conf;
 88 #
 89 #        location / {
 90 #        }
 91 #
 92 #        error_page 404 /404.html;
 93 #            location = /40x.html {
 94 #        }
 95 #
 96 #        error_page 500 502 503 504 /50x.html;
 97 #            location = /50x.html {
 98 #        }
 99 #    }
100
101 }
检查并启动 nginx 服务
[root@manager ~]# nginx -t
nginx: the configuration file /etc/nginx/nginx.conf syntax is ok
nginx: configuration file /etc/nginx/nginx.conf test is successful
[root@manager ~]# systemctl start nginx
[root@manager ~]# netstat -lntup | grep nginx
tcp        0      0 0.0.0.0:80              0.0.0.0:*               LISTEN      1888/nginx: master
tcp6       0      0 :::80                   :::*                    LISTEN      1888/nginx: master
测试访问nginx并查看日志记录
# 测试
[root@manager ~]# curl 192.168.176.128

查看日志(这里可以看到我们自定义的日志格式输出)
[root@manager ~]# cat /var/log/nginx/access.log
{ "@timestamp": "2018-11-18T01:28:49-05:00", "remote_addr": "192.168.176.128", "remote_user": "-", "body_bytes_sent": "3700", "request_time": "0.000", "status": "200", "request_uri": "/", "request_method": "GET", "http_referrer": "-", "http_x_forwarded_for": "-", "http_user_agent": "curl/7.29.0"}
安装JDK
[root@manager ELK]# yum -y install java-1.8.0-openjdk
Nginx 就先到这里,对我们的整个环境这样就足够了
4. redis安装
安装在192.168.176.129服务器上
redis 也是直接yum简单粗暴的安装了
[root@node1 ~]# yum -y install epel-release
[root@node1 ~]# yum -y install redis
检查是否安装成功(查看版本)
[root@node1 ~]# redis-server -v
Redis server v=3.2.12 sha=00000000:0 malloc=jemalloc-3.6.0 bits=64 build=7897e7d0e13773f
修改redis配置文件(监听地址和密码)
[root@node1 ~]# vim /etc/redis.conf
修改两个地方
bind 127.0.0.1 改为 bind 0.0.0.0
# requirepass foot 去掉注释 foot改为自己的密码
查看修改后的配置文件
监听地址
[root@node1 ~]# cat  /etc/redis.conf  | grep bind
# By default, if no "bind" configuration directive is specified, Redis listens
# the "bind" configuration directive, followed by one or more IP addresses.
# bind 192.168.1.100 10.0.0.1
# bind 127.0.0.1 ::1
# internet, binding to all the interfaces is dangerous and will expose the
# following bind directive, that will force Redis to listen only into
bind 0.0.0.0
# 1) The server is not binding explicitly to a set of addresses using the
#    "bind" directive.
# are explicitly listed using the "bind" directive.

密码
[root@node1 ~]# cat /etc/redis.conf  | grep requirepass
# If the master is password protected (using the "requirepass" configuration
requirepass 123456
启动服务并登录测试redis
[root@node1 ~]# systemctl start redis
[root@node1 ~]# netstat -lntup | grep redis
tcp        0      0 0.0.0.0:6379            0.0.0.0:*               LISTEN      2139/redis-server 0

# 不加密码登录(没有权限执行指令)
[root@node1 ~]# redis-cli
127.0.0.1:6379> KEYS *
(error) NOAUTH Authentication required.
127.0.0.1:6379>

# 添加密码登录
[root@node1 ~]# redis-cli -a 123456
127.0.0.1:6379> KEYS *
(empty list or set)
127.0.0.1:6379>
安装JDK
[root@node1 ELK]# yum -y install java-1.8.0-openjdk
redis也是可以了 结束redis部署
5. elasticsearch集群部署
下面的设置安装源在整个环境的所有环境都要执行
# 添加ELK的yum源
[root@node2 ~]# rpm --import https://artifacts.elastic.co/GPG-KEY-elasticsearch
[root@node2 ~]# vim /etc/yum.repos.d/elasticsearch.repo
[elasticsearch-6.x]
name=Elasticsearch repository for 6.x packages
baseurl=https://artifacts.elastic.co/packages/6.x/yum
gpgcheck=1
gpgkey=https://artifacts.elastic.co/GPG-KEY-elasticsearch
enabled=1
autorefresh=1
type=rpm-md

# 安装jdk和elasticsearch(这里需要注意的是jdk一定是1.8.0以上的版本)
[root@node2 ~]# yum -y install java-1.8.0-openjdk
在192.168.176.130、131、132 机器上执行
[root@node1 ~]# yum -y install elasticsearch
[root@node2 ~]# yum -y install elasticsearch
[root@node3 ~]# yum -y install elasticsearch
温馨提示:以上安装要在三台机器上都要执行
配置文件修改
温馨提示:三台机器上都要修改配置文件
三台机器配置文件的不同之处
node.name: 这里的名称每台机器都不能一样

network.host: 这里是本服务器的地址
每台机器的配置文件
 1 [root@node2 ELK]# cat /etc/elasticsearch/elasticsearch.yml
 2 # ======================== Elasticsearch Configuration =========================
 3 #
 4 # NOTE: Elasticsearch comes with reasonable defaults for most settings.
 5 #       Before you set out to tweak and tune the configuration, make sure you
 6 #       understand what are you trying to accomplish and the consequences.
 7 #
 8 # The primary way of configuring a node is via this file. This template lists
 9 # the most important settings you may want to configure for a production cluster.
10 #
11 # Please consult the documentation for further information on configuration options:
12 # https://www.elastic.co/guide/en/elasticsearch/reference/index.html
13 #
14 # ---------------------------------- Cluster -----------------------------------
15 #
16 # Use a descriptive name for your cluster:
17 #
18 cluster.name: elk-cluster
19 #
20 # ------------------------------------ Node ------------------------------------
21 #
22 # Use a descriptive name for the node:
23 #
24 node.name: node-1
25 #
26 # Add custom attributes to the node:
27 #
28 #node.attr.rack: r1
29 #
30 # ----------------------------------- Paths ------------------------------------
31 #
32 # Path to directory where to store the data (separate multiple locations by comma):
33 #
34 path.data: /var/lib/elasticsearch
35 #
36 # Path to log files:
37 #
38 path.logs: /var/log/elasticsearch
39 #
40 # ----------------------------------- Memory -----------------------------------
41 #
42 # Lock the memory on startup:
43 #
44 #bootstrap.memory_lock: true
45 #
46 # Make sure that the heap size is set to about half the memory available
47 # on the system and that the owner of the process is allowed to use this
48 # limit.
49 #
50 # Elasticsearch performs poorly when the system is swapping the memory.
51 #
52 # ---------------------------------- Network -----------------------------------
53 #
54 # Set the bind address to a specific IP (IPv4 or IPv6):
55 #
56 network.host: 192.168.176.130
57 #
58 # Set a custom port for HTTP:
59 #
60 http.port: 9200
61 #
62 # For more information, consult the network module documentation.
63 #
64 # --------------------------------- Discovery ----------------------------------
65 #
66 # Pass an initial list of hosts to perform discovery when new node is started:
67 # The default list of hosts is ["127.0.0.1", "[::1]"]
68 #
69 discovery.zen.ping.unicast.hosts: ["192.168.176.130","192.168.176.131","192.168.176.132"]
70 #
71 # Prevent the "split brain" by configuring the majority of nodes (total number of master-eligible nodes / 2 + 1):
72 #
73 discovery.zen.minimum_master_nodes: 2
74 #
75 # For more information, consult the zen discovery module documentation.
76 #
77 # ---------------------------------- Gateway -----------------------------------
78 #
79 # Block initial recovery after a full cluster restart until N nodes are started:
80 #
81 #gateway.recover_after_nodes: 3
82 #
83 # For more information, consult the gateway module documentation.
84 #
85 # ---------------------------------- Various -----------------------------------
86 #
87 # Require explicit names when deleting indices:
88 #
89 #action.destructive_requires_name: true
90
91 # 允许所有跨域连接 为了使用head的可视化工具的解决方法
92 http.cors.enabled: true
93 http.cors.allow-origin: "*"
 1 [root@node3 ELK]# cat /etc/elasticsearch/elasticsearch.yml
 2 # ======================== Elasticsearch Configuration =========================
 3 #
 4 # NOTE: Elasticsearch comes with reasonable defaults for most settings.
 5 #       Before you set out to tweak and tune the configuration, make sure you
 6 #       understand what are you trying to accomplish and the consequences.
 7 #
 8 # The primary way of configuring a node is via this file. This template lists
 9 # the most important settings you may want to configure for a production cluster.
10 #
11 # Please consult the documentation for further information on configuration options:
12 # https://www.elastic.co/guide/en/elasticsearch/reference/index.html
13 #
14 # ---------------------------------- Cluster -----------------------------------
15 #
16 # Use a descriptive name for your cluster:
17 #
18 cluster.name: elk-cluster
19 #
20 # ------------------------------------ Node ------------------------------------
21 #
22 # Use a descriptive name for the node:
23 #
24 node.name: node-2
25 #
26 # Add custom attributes to the node:
27 #
28 #node.attr.rack: r1
29 #
30 # ----------------------------------- Paths ------------------------------------
31 #
32 # Path to directory where to store the data (separate multiple locations by comma):
33 #
34 path.data: /var/lib/elasticsearch
35 #
36 # Path to log files:
37 #
38 path.logs: /var/log/elasticsearch
39 #
40 # ----------------------------------- Memory -----------------------------------
41 #
42 # Lock the memory on startup:
43 #
44 #bootstrap.memory_lock: true
45 #
46 # Make sure that the heap size is set to about half the memory available
47 # on the system and that the owner of the process is allowed to use this
48 # limit.
49 #
50 # Elasticsearch performs poorly when the system is swapping the memory.
51 #
52 # ---------------------------------- Network -----------------------------------
53 #
54 # Set the bind address to a specific IP (IPv4 or IPv6):
55 #
56 network.host: 192.168.176.131
57 #
58 # Set a custom port for HTTP:
59 #
60 http.port: 9200
61 #
62 # For more information, consult the network module documentation.
63 #
64 # --------------------------------- Discovery ----------------------------------
65 #
66 # Pass an initial list of hosts to perform discovery when new node is started:
67 # The default list of hosts is ["127.0.0.1", "[::1]"]
68 #
69 discovery.zen.ping.unicast.hosts: ["192.168.176.130","192.168.176.131","192.168.176.132"]
70 #
71 # Prevent the "split brain" by configuring the majority of nodes (total number of master-eligible nodes / 2 + 1):
72 #
73 discovery.zen.minimum_master_nodes: 2
74 #
75 # For more information, consult the zen discovery module documentation.
76 #
77 # ---------------------------------- Gateway -----------------------------------
78 #
79 # Block initial recovery after a full cluster restart until N nodes are started:
80 #
81 #gateway.recover_after_nodes: 3
82 #
83 # For more information, consult the gateway module documentation.
84 #
85 # ---------------------------------- Various -----------------------------------
86 #
87 # Require explicit names when deleting indices:
88 #
89 #action.destructive_requires_name: true
90
91 # 允许所有跨域连接 为了使用head的可视化工具的解决方法
92 http.cors.enabled: true
93 http.cors.allow-origin: "*"
 1 [root@node4 ELK]# cat /etc/elasticsearch/elasticsearch.yml
 2 # ======================== Elasticsearch Configuration =========================
 3 #
 4 # NOTE: Elasticsearch comes with reasonable defaults for most settings.
 5 #       Before you set out to tweak and tune the configuration, make sure you
 6 #       understand what are you trying to accomplish and the consequences.
 7 #
 8 # The primary way of configuring a node is via this file. This template lists
 9 # the most important settings you may want to configure for a production cluster.
10 #
11 # Please consult the documentation for further information on configuration options:
12 # https://www.elastic.co/guide/en/elasticsearch/reference/index.html
13 #
14 # ---------------------------------- Cluster -----------------------------------
15 #
16 # Use a descriptive name for your cluster:
17 #
18 cluster.name: elk-cluster
19 #
20 # ------------------------------------ Node ------------------------------------
21 #
22 # Use a descriptive name for the node:
23 #
24 node.name: node-3
25 #
26 # Add custom attributes to the node:
27 #
28 #node.attr.rack: r1
29 #
30 # ----------------------------------- Paths ------------------------------------
31 #
32 # Path to directory where to store the data (separate multiple locations by comma):
33 #
34 path.data: /var/lib/elasticsearch
35 #
36 # Path to log files:
37 #
38 path.logs: /var/log/elasticsearch
39 #
40 # ----------------------------------- Memory -----------------------------------
41 #
42 # Lock the memory on startup:
43 #
44 #bootstrap.memory_lock: true
45 #
46 # Make sure that the heap size is set to about half the memory available
47 # on the system and that the owner of the process is allowed to use this
48 # limit.
49 #
50 # Elasticsearch performs poorly when the system is swapping the memory.
51 #
52 # ---------------------------------- Network -----------------------------------
53 #
54 # Set the bind address to a specific IP (IPv4 or IPv6):
55 #
56 network.host: 192.168.176.132
57 #
58 # Set a custom port for HTTP:
59 #
60 http.port: 9200
61 #
62 # For more information, consult the network module documentation.
63 #
64 # --------------------------------- Discovery ----------------------------------
65 #
66 # Pass an initial list of hosts to perform discovery when new node is started:
67 # The default list of hosts is ["127.0.0.1", "[::1]"]
68 #
69 discovery.zen.ping.unicast.hosts: ["192.168.176.130","192.168.176.131","192.168.176.132"]
70 #
71 # Prevent the "split brain" by configuring the majority of nodes (total number of master-eligible nodes / 2 + 1):
72 #
73 discovery.zen.minimum_master_nodes: 2
74 #
75 # For more information, consult the zen discovery module documentation.
76 #
77 # ---------------------------------- Gateway -----------------------------------
78 #
79 # Block initial recovery after a full cluster restart until N nodes are started:
80 #
81 #gateway.recover_after_nodes: 3
82 #
83 # For more information, consult the gateway module documentation.
84 #
85 # ---------------------------------- Various -----------------------------------
86 #
87 # Require explicit names when deleting indices:
88 #
89 #action.destructive_requires_name: true
90
91 # 允许所有跨域连接 为了使用head的可视化工具的解决方法
92 http.cors.enabled: true
93 http.cors.allow-origin: "*"
启动elasticsearch服务
温馨提示:三台机器都要启动(elasticsearch监听的端口是9200和9300)
[root@node2 ELK]# systemctl start elasticsearch
[root@node3 ELK]# systemctl start elasticsearch
[root@node4 ELK]# systemctl start elasticsearch
检查elasticsearch集群
elasticsearch 采用的是接口的方式去查看数据和状态信息
# 查看集群状态
[root@node2 ELK]# curl -X GET "192.168.176.130:9200/_cat/health?v"
epoch      timestamp cluster     status node.total node.data shards pri relo init unassign pending_tasks max_task_wait_time active_shards_percent
1542525784 07:23:04  elk-cluster green           3         3      0   0    0    0        0             0                  -                100.0%

# 查看集群性能
[root@node2 ELK]# curl -X GET "192.168.176.130:9200/_cat/nodes?v"
ip              heap.percent ram.percent cpu load_1m load_5m load_15m node.role master name
192.168.176.131           26          96   2    0.05    0.07     0.05 mdi       *      node-2
192.168.176.132           26          96   3    0.06    0.06     0.05 mdi       -      node-3
192.168.176.130           25          95   0    0.00    0.02     0.05 mdi       -      node-1
安装elasticsearch的可视化web工具
温馨提示:只在一台机器上安装即可
[root@node2 ELK]# yum -y install epel-release
[root@node2 ELK]# yum -y install git
[root@node2 ELK]# yum -y install nodejs
    git clone git://github.com/mobz/elasticsearch-head.git
    cd elasticsearch-head
    npm install
    npm run start
6. logstash安装
这个环境中我们有两台服务器需要安装logstash 一个收集数据放到redis一个在redis中读放大elasticsearch中
192.168.176.128 这台机器负责收集并写到redis
192.168.176.129 这台机器负责读redis数据写的elasticsearch中
在两台机器上安装logstash
[root@manager ~]# yum -y install logstash
[root@node1 ~]# yum -y install logstash

检查安装是否成功(检查版本)
[root@manager ELK]# /usr/share/logstash/bin/logstash --version
logstash 6.5.0

[root@node1 ELK]# /usr/share/logstash/bin/logstash --version
logstash 6.5.0
在192.168.176.128服务器编写配置logstash收集并存入redis的配置文件
# 这个文件不存在,需要自己编辑
[root@manager ELK]# cat /etc/logstash/conf.d/logstash-to-redis.conf
input {
    file {
        path => ["/var/log/nginx/access.log"]
        type => "nginx-access"
        tags => ["nginxlog","test"]
        start_position => "beginning"
    }
}
filter {

}
output {
    redis {
        host => ["192.168.176.129"]
        password => "123456"
        db => "0"
        data_type => "list"
        key => "nginxlog"
    }
}
这里的配置文件就不解释了,elasticsearch的具体参数介绍请看:elasticsearch详解
检查配置文件
[root@manager ELK]# /usr/share/logstash/bin/logstash -t -f /etc/logstash/conf.d/logstash-to-redis.conf
WARNING: Could not find logstash.yml which is typically located in $LS_HOME/config or /etc/logstash. You can specify the path using --path.settings. Continuing using the defaults
Could not find log4j2 configuration at path /usr/share/logstash/config/log4j2.properties. Using default config which logs errors to the console
[INFO ] 2018-11-18 03:01:37.282 [main] writabledirectory - Creating directory {:setting=>"path.queue", :path=>"/usr/share/logstash/data/queue"}
[INFO ] 2018-11-18 03:01:37.288 [main] writabledirectory - Creating directory {:setting=>"path.dead_letter_queue", :path=>"/usr/share/logstash/data/dead_letter_queue"}
[WARN ] 2018-11-18 03:01:37.534 [LogStash::Runner] multilocal - Ignoring the 'pipelines.yml' file because modules or command line options are specified
Configuration OK
[INFO ] 2018-11-18 03:01:38.918 [LogStash::Runner] runner - Using config.test_and_exit mode. Config Validation Result: OK. Exiting Logstash
启动logstash
[root@manager ELK]# /usr/share/logstash/bin/logstash -r -f /etc/logstash/conf.d/logstash-to-redis.conf
WARNING: Could not find logstash.yml which is typically located in $LS_HOME/config or /etc/logstash. You can specify the path using --path.settings. Continuing using the defaults
Could not find log4j2 configuration at path /usr/share/logstash/config/log4j2.properties. Using default config which logs errors to the console
[WARN ] 2018-11-18 03:04:02.794 [LogStash::Runner] multilocal - Ignoring the 'pipelines.yml' file because modules or command line options are specified
[INFO ] 2018-11-18 03:04:02.805 [LogStash::Runner] runner - Starting Logstash {"logstash.version"=>"6.5.0"}
[INFO ] 2018-11-18 03:04:02.826 [LogStash::Runner] agent - No persistent UUID file found. Generating new UUID {:uuid=>"14eb7761-ca71-41f7-b67d-f640c80d46ba", :path=>"/usr/share/logstash/data/uuid"}
[INFO ] 2018-11-18 03:04:04.441 [Converge PipelineAction::Create<main>] pipeline - Starting pipeline {:pipeline_id=>"main", "pipeline.workers"=>4, "pipeline.batch.size"=>125, "pipeline.batch.delay"=>50}
[INFO ] 2018-11-18 03:04:19.710 [[main]>worker3] file - No sincedb_path set, generating one based on the "path" setting {:sincedb_path=>"/usr/share/logstash/data/plugins/inputs/file/.sincedb_d883144359d3b4f516b37dba51fab2a2", :path=>["/var/log/nginx/access.log"]}
[INFO ] 2018-11-18 03:04:19.737 [Converge PipelineAction::Create<main>] pipeline - Pipeline started successfully {:pipeline_id=>"main", :thread=>"#<Thread:0x3e9da1b7 run>"}
[INFO ] 2018-11-18 03:04:19.789 [Ruby-0-Thread-1: /usr/share/logstash/lib/bootstrap/environment.rb:6] agent - Pipelines running {:count=>1, :running_pipelines=>[:main], :non_running_pipelines=>[]}
[INFO ] 2018-11-18 03:04:19.832 [[main]<file] observingtail - START, creating Discoverer, Watch with file and sincedb collections
[INFO ] 2018-11-18 03:04:20.058 [Api Webserver] agent - Successfully started Logstash API endpoint {:port=>9600}
这里表示启动成功,去192.168.176.129的redis上查看是否有数据
[root@node1 ELK]# redis-cli -a 123456
127.0.0.1:6379> KEYS *
1) "nginxlog"
127.0.0.1:6379> LLEN nginxlog
(integer) 1
127.0.0.1:6379> LRANGE nginxlog 0 1
1) "{\"message\":\"{ \\\"@timestamp\\\": \\\"2018-11-18T01:28:49-05:00\\\", \\\"remote_addr\\\": \\\"192.168.176.128\\\", \\\"remote_user\\\": \\\"-\\\", \\\"body_bytes_sent\\\": \\\"3700\\\", \\\"request_time\\\": \\\"0.000\\\", \\\"status\\\": \\\"200\\\", \\\"request_uri\\\": \\\"/\\\", \\\"request_method\\\": \\\"GET\\\", \\\"http_referrer\\\": \\\"-\\\", \\\"http_x_forwarded_for\\\": \\\"-\\\", \\\"http_user_agent\\\": \\\"curl/7.29.0\\\"}\",\"@timestamp\":\"2018-11-18T08:04:20.185Z\",\"host\":\"manager\",\"tags\":[\"nginxlog\",\"test\"],\"path\":\"/var/log/nginx/access.log\",\"@version\":\"1\",\"type\":\"nginx-access\"}"
127.0.0.1:6379>
在192.168.176.129上编写读取redis数据写到elasticsearch中的配置文件
[root@node1 ELK]# cat /etc/logstash/conf.d/logstash-from-redis.conf
input {
    redis {
        host => "192.168.176.129"
        port => 6379
        password => "123456"
        db => "0"
        data_type => "list"
        key => "nginxlog"
    }
}
filter {

}
output {
    elasticsearch {
        hosts => ["http://192.168.176.130:9200","http://192.168.176.131:9200","http://192.168.176.132:9200"]
        index => "nginxlogs-%{+YYYY.MM.dd}"
    }
    stdout {
        codec => rubydebug
    }
}
检查配置文件
[root@node1 ELK]# /usr/share/logstash/bin/logstash -t -f /etc/logstash/conf.d/logstash-from-redis.conf
WARNING: Could not find logstash.yml which is typically located in $LS_HOME/config or /etc/logstash. You can specify the path using --path.settings. Continuing using the defaults
Could not find log4j2 configuration at path /usr/share/logstash/config/log4j2.properties. Using default config which logs errors to the console
[WARN ] 2018-11-18 03:12:45.966 [LogStash::Runner] multilocal - Ignoring the 'pipelines.yml' file because modules or command line options are specified
Configuration OK
[INFO ] 2018-11-18 03:12:47.990 [LogStash::Runner] runner - Using config.test_and_exit mode. Config Validation Result: OK. Exiting Logstash
启动logstash
[root@node1 ELK]# /usr/share/logstash/bin/logstash -r -f /etc/logstash/conf.d/logstash-from-redis.conf
WARNING: Could not find logstash.yml which is typically located in $LS_HOME/config or /etc/logstash. You can specify the path using --path.settings. Continuing using the defaults
Could not find log4j2 configuration at path /usr/share/logstash/config/log4j2.properties. Using default config which logs errors to the console
[WARN ] 2018-11-18 03:14:53.077 [LogStash::Runner] multilocal - Ignoring the 'pipelines.yml' file because modules or command line options are specified
[INFO ] 2018-11-18 03:14:53.090 [LogStash::Runner] runner - Starting Logstash {"logstash.version"=>"6.5.0"}
[INFO ] 2018-11-18 03:14:53.110 [LogStash::Runner] agent - No persistent UUID file found. Generating new UUID {:uuid=>"f50b6c39-c81a-4a9d-b329-82aea82ddb2d", :path=>"/usr/share/logstash/data/uuid"}
[INFO ] 2018-11-18 03:14:55.989 [Converge PipelineAction::Create<main>] pipeline - Starting pipeline {:pipeline_id=>"main", "pipeline.workers"=>4, "pipeline.batch.size"=>125, "pipeline.batch.delay"=>50}
[INFO ] 2018-11-18 03:14:56.334 [[main]-pipeline-manager] elasticsearch - Elasticsearch pool URLs updated {:changes=>{:removed=>[], :added=>[http://192.168.176.130:9200/, http://192.168.176.131:9200/, http://192.168.176.132:9200/]}}
[INFO ] 2018-11-18 03:14:56.340 [[main]-pipeline-manager] elasticsearch - Running health check to see if an Elasticsearch connection is working {:healthcheck_url=>http://192.168.176.130:9200/, :path=>"/"}
[WARN ] 2018-11-18 03:14:56.481 [[main]-pipeline-manager] elasticsearch - Restored connection to ES instance {:url=>"http://192.168.176.130:9200/"}
[INFO ] 2018-11-18 03:14:56.642 [[main]-pipeline-manager] elasticsearch - ES Output version determined {:es_version=>6}
[WARN ] 2018-11-18 03:14:56.646 [[main]-pipeline-manager] elasticsearch - Detected a 6.x and above cluster: the `type` event field won't be used to determine the document _type {:es_version=>6}
[INFO ] 2018-11-18 03:14:56.647 [[main]-pipeline-manager] elasticsearch - Running health check to see if an Elasticsearch connection is working {:healthcheck_url=>http://192.168.176.131:9200/, :path=>"/"}
[WARN ] 2018-11-18 03:14:56.720 [[main]-pipeline-manager] elasticsearch - Restored connection to ES instance {:url=>"http://192.168.176.131:9200/"}
[INFO ] 2018-11-18 03:14:56.746 [[main]-pipeline-manager] elasticsearch - Running health check to see if an Elasticsearch connection is working {:healthcheck_url=>http://192.168.176.132:9200/, :path=>"/"}
[WARN ] 2018-11-18 03:14:56.811 [[main]-pipeline-manager] elasticsearch - Restored connection to ES instance {:url=>"http://192.168.176.132:9200/"}
[INFO ] 2018-11-18 03:14:56.854 [[main]-pipeline-manager] elasticsearch - New Elasticsearch output {:class=>"LogStash::Outputs::ElasticSearch", :hosts=>["http://192.168.176.130:9200", "http://192.168.176.131:9200", "http://192.168.176.132:9200"]}
[INFO ] 2018-11-18 03:14:56.892 [Ruby-0-Thread-5: :1] elasticsearch - Using mapping template from {:path=>nil}
[INFO ] 2018-11-18 03:14:56.908 [Ruby-0-Thread-5: :1] elasticsearch - Attempting to install template {:manage_template=>{"template"=>"logstash-*", "version"=>60001, "settings"=>{"index.refresh_interval"=>"5s"}, "mappings"=>{"_default_"=>{"dynamic_templates"=>[{"message_field"=>{"path_match"=>"message", "match_mapping_type"=>"string", "mapping"=>{"type"=>"text", "norms"=>false}}}, {"string_fields"=>{"match"=>"*", "match_mapping_type"=>"string", "mapping"=>{"type"=>"text", "norms"=>false, "fields"=>{"keyword"=>{"type"=>"keyword", "ignore_above"=>256}}}}}], "properties"=>{"@timestamp"=>{"type"=>"date"}, "@version"=>{"type"=>"keyword"}, "geoip"=>{"dynamic"=>true, "properties"=>{"ip"=>{"type"=>"ip"}, "location"=>{"type"=>"geo_point"}, "latitude"=>{"type"=>"half_float"}, "longitude"=>{"type"=>"half_float"}}}}}}}}
[INFO ] 2018-11-18 03:14:56.913 [[main]>worker3] redis - Registering Redis {:identity=>"redis://<password>@192.168.176.129:6379/0 list:nginxlog"}
[INFO ] 2018-11-18 03:14:56.945 [Converge PipelineAction::Create<main>] pipeline - Pipeline started successfully {:pipeline_id=>"main", :thread=>"#<Thread:0x300817f0 run>"}
[INFO ] 2018-11-18 03:14:57.019 [Ruby-0-Thread-1: /usr/share/logstash/lib/bootstrap/environment.rb:6] agent - Pipelines running {:count=>1, :running_pipelines=>[:main], :non_running_pipelines=>[]}
[INFO ] 2018-11-18 03:14:57.038 [Ruby-0-Thread-5: :1] elasticsearch - Installing elasticsearch template to _template/logstash
[INFO ] 2018-11-18 03:14:57.373 [Api Webserver] agent - Successfully started Logstash API endpoint {:port=>9600}
上的输出表示启动成功,下面还会输出一些数据

这些就是我们的日志数据,在redis里面读出来的一个debug信息
我们查看129中的redis是不是已经空了
[root@node1 ~]# redis-cli -a 123456
127.0.0.1:6379> LLEN nginxlog
(integer) 11
127.0.0.1:6379> LLEN nginxlog
(integer) 0
127.0.0.1:6379>
查看elasticsearch里面是不是多出来一个索引
[root@node2 elasticsearch-head-master]# curl "192.168.176.130:9200/_cat/indices?v"
health status index                uuid                   pri rep docs.count docs.deleted store.size pri.store.size
green  open   bank                 kk8k6Y8eRCWiLDR3fBCoHA   5   1       1000            0    958.1kb        475.1kb
green  open   nginxlogs-2018.11.18 IocfOyAIT4-cxC-7O9kMtw   5   1         11            0     72.1kb           36kb
这里的nginxlogs-2018.11.18索引nginx的日志数据
接下了就用kibana展示出啦
7. kibana安装
在192.168.176.133的服务器上安装kibana
[root@node5 ~]# yum -y install kibana
# 查看是否安装成功(查看版本)
[root@node5 ELK]# /usr/share/kibana/bin/kibana --version
6.5.0
编辑kibana的配置文件
需要修改的地方:
# 监听端口
server.port:5601 去掉注释即可

# 监听地址
server.host: "localhost" 去掉注释修改为 server.host: "0.0.0.0"

# elasticsearch地址
elasticsearch.url: "http://localhost:9200" 去掉注释修改为 elasticsearch.url: "http://192.168.176.130:9200"
  1 [root@node5 ELK]# cat /etc/kibana/kibana.yml
  2 # Kibana is served by a back end server. This setting specifies the port to use.
  3 server.port: 5601
  4
  5 # Specifies the address to which the Kibana server will bind. IP addresses and host names are both valid values.
  6 # The default is 'localhost', which usually means remote machines will not be able to connect.
  7 # To allow connections from remote users, set this parameter to a non-loopback address.
  8 server.host: "0.0.0.0"
  9
 10 # Enables you to specify a path to mount Kibana at if you are running behind a proxy.
 11 # Use the `server.rewriteBasePath` setting to tell Kibana if it should remove the basePath
 12 # from requests it receives, and to prevent a deprecation warning at startup.
 13 # This setting cannot end in a slash.
 14 #server.basePath: ""
 15
 16 # Specifies whether Kibana should rewrite requests that are prefixed with
 17 # `server.basePath` or require that they are rewritten by your reverse proxy.
 18 # This setting was effectively always `false` before Kibana 6.3 and will
 19 # default to `true` starting in Kibana 7.0.
 20 #server.rewriteBasePath: false
 21
 22 # The maximum payload size in bytes for incoming server requests.
 23 #server.maxPayloadBytes: 1048576
 24
 25 # The Kibana server's name.  This is used for display purposes.
 26 #server.name: "your-hostname"
 27
 28 # The URL of the Elasticsearch instance to use for all your queries.
 29 elasticsearch.url: "http://192.168.176.130:9200"
 30
 31 # When this setting's value is true Kibana uses the hostname specified in the server.host
 32 # setting. When the value of this setting is false, Kibana uses the hostname of the host
 33 # that connects to this Kibana instance.
 34 #elasticsearch.preserveHost: true
 35
 36 # Kibana uses an index in Elasticsearch to store saved searches, visualizations and
 37 # dashboards. Kibana creates a new index if the index doesn't already exist.
 38 #kibana.index: ".kibana"
 39
 40 # The default application to load.
 41 #kibana.defaultAppId: "home"
 42
 43 # If your Elasticsearch is protected with basic authentication, these settings provide
 44 # the username and password that the Kibana server uses to perform maintenance on the Kibana
 45 # index at startup. Your Kibana users still need to authenticate with Elasticsearch, which
 46 # is proxied through the Kibana server.
 47 #elasticsearch.username: "user"
 48 #elasticsearch.password: "pass"
 49
 50 # Enables SSL and paths to the PEM-format SSL certificate and SSL key files, respectively.
 51 # These settings enable SSL for outgoing requests from the Kibana server to the browser.
 52 #server.ssl.enabled: false
 53 #server.ssl.certificate: /path/to/your/server.crt
 54 #server.ssl.key: /path/to/your/server.key
 55
 56 # Optional settings that provide the paths to the PEM-format SSL certificate and key files.
 57 # These files validate that your Elasticsearch backend uses the same key files.
 58 #elasticsearch.ssl.certificate: /path/to/your/client.crt
 59 #elasticsearch.ssl.key: /path/to/your/client.key
 60
 61 # Optional setting that enables you to specify a path to the PEM file for the certificate
 62 # authority for your Elasticsearch instance.
 63 #elasticsearch.ssl.certificateAuthorities: [ "/path/to/your/CA.pem" ]
 64
 65 # To disregard the validity of SSL certificates, change this setting's value to 'none'.
 66 #elasticsearch.ssl.verificationMode: full
 67
 68 # Time in milliseconds to wait for Elasticsearch to respond to pings. Defaults to the value of
 69 # the elasticsearch.requestTimeout setting.
 70 #elasticsearch.pingTimeout: 1500
 71
 72 # Time in milliseconds to wait for responses from the back end or Elasticsearch. This value
 73 # must be a positive integer.
 74 #elasticsearch.requestTimeout: 30000
 75
 76 # List of Kibana client-side headers to send to Elasticsearch. To send *no* client-side
 77 # headers, set this value to [] (an empty list).
 78 #elasticsearch.requestHeadersWhitelist: [ authorization ]
 79
 80 # Header names and values that are sent to Elasticsearch. Any custom headers cannot be overwritten
 81 # by client-side headers, regardless of the elasticsearch.requestHeadersWhitelist configuration.
 82 #elasticsearch.customHeaders: {}
 83
 84 # Time in milliseconds for Elasticsearch to wait for responses from shards. Set to 0 to disable.
 85 #elasticsearch.shardTimeout: 30000
 86
 87 # Time in milliseconds to wait for Elasticsearch at Kibana startup before retrying.
 88 #elasticsearch.startupTimeout: 5000
 89
 90 # Logs queries sent to Elasticsearch. Requires logging.verbose set to true.
 91 #elasticsearch.logQueries: false
 92
 93 # Specifies the path where Kibana creates the process ID file.
 94 #pid.file: /var/run/kibana.pid
 95
 96 # Enables you specify a file where Kibana stores log output.
 97 #logging.dest: stdout
 98
 99 # Set the value of this setting to true to suppress all logging output.
100 #logging.silent: false
101
102 # Set the value of this setting to true to suppress all logging output other than error messages.
103 #logging.quiet: false
104
105 # Set the value of this setting to true to log all events, including system usage information
106 # and all requests.
107 #logging.verbose: false
108
109 # Set the interval in milliseconds to sample system and process performance
110 # metrics. Minimum is 100ms. Defaults to 5000.
111 #ops.interval: 5000
112
113 # Specifies locale to be used for all localizable strings, dates and number formats.
114 #i18n.locale: "en"
在配置文件中还有很多的配置项,会有一篇专门的文章介绍
启动kibana
[root@node5 ELK]# systemctl start kibana
[root@node5 ELK]# netstat -lntup | grep 5601
tcp        0      0 0.0.0.0:5601            0.0.0.0:*               LISTEN      2693/node
登录kibana的web页面查看我们nginx实时收集的日志
-------------------------------------------
个性签名:在逆境中要看到生活的美,在希望中别忘记不断奋斗
如果觉得这篇文章对你有小小的帮助的话,记得在右下角点个“推荐”哦,博主在此感谢!
万水千山总是情,打赏一分行不行,所以如果你心情还比较高兴,也是可以扫码打赏博主,哈哈哈(っ•̀ω•́)っ✎⁾⁾!


也可以关注我的微信公众号,不定时更新技术文章(kubernetes,Devops,Python)等


 浙公网安备 33010602011771号