

探索 OpenStack 之(16):计量模块 Ceilometer 介绍及优化
0. 背景
0.1 为什么要有 Ceilometer?
通常云,特别是公有云在计费方面有三个层次:
- 计量 (Metering): 收集资源的使用数据,其数据信息主要包括:使用对象(what), 使用者(who), 使用时间(when)和 用量(how much)。
- 计费 (Rating):将资源使用数据按照商务规则转化为可计费项目并计算费用
- 结算 (Billing):收钱开票
Ceilometer 的目标是 计量 Metering 方面,为上层的计费、结算或者监控应用提供统一的资源使用数据收集功能。
"To provide an infrastructure to collect any information needed within all OpenStack projects so that rating engines could use this single point to transform events into bill items, which we tagged “metering“."
0.2 历史
- 项目开始于2012年四五月份,由 Julien Danjou, Dreamhost 和 Canonical等发起。
- 2012年的10月份(Folsom版本),Ceilometer发布了它的v1.0版本,在 第一个版本中,Ceilometer主要实现了对一些重要数据的计量,包括Compute, Network, Memory, CPU, Image, Volume等,并且提供了REST API。
- 2013年2月,Ceilometer完成了由Incubation到Integrated的转变,这意味着Ceilometer将作为OpenStack 发行版的一部分而发布。
- Grizzly 中,Ceilometer添加了对 Swift 的支持,增加了SQLAlchemy作为Storage Backend,开发了Multi Publisher, 并且发布了V2版本的API。
- Havana 中,Ceilometer主要增加了 HBase 作为Storage Backend,Alarm功能也基本完成, 并且增加了UDP Publisher 作为取代RPC发送消息的第二选择,更加高效。还增加了DB2作为Storage Backend.
- IceHouse 中,主要是分离collector,增加vmware vcenter server支持等。参考链接。
- Juno 中,主要是进行优化(还之前留下的技术债),以及添加Temptest。参考链接。
1. 概念
Ceilometer 的主要概念包括:
- Meter:计量项
- Sample:某Resource 某时刻某 Meter 的值
- Statistics:某区间 Samples 的聚合值
- Alarm:某区间 Statistics 满足给定条件后发出的告警
1.1 Meter
资源使用的某个计量项,它的属性包括:名称(name)、单位 (unit)、类型 (cumulative:累计值,delta:变化值、gauge:离散或者波动值)以及对应的资源属性等。
(1)在 这里 可以看到所有的 Ceilometer meter 列表和说明。
(2)使用CLI “ceilometer meter-list” 来获取所有的meters。例如:
+---------------------+------------+----------+--------------------------------------+----------------------------------+----------------------------------+
| Name | Type | Unit | Resource ID | User ID | Project ID |
+---------------------+------------+----------+--------------------------------------+----------------------------------+----------------------------------+
| cpu | cumulative | ns | 440e4e2c-f255-43b3-8150-c6bc6b061ef7 | 1dc0db32a936496ebfc50be54924a7cc | fa2046aaead44a698de8268f94759fc1 |
| cpu_util | gauge | % | 440e4e2c-f255-43b3-8150-c6bc6b061ef7 | 1dc0db32a936496ebfc50be54924a7cc | fa2046aaead44a698de8268f94759fc1 |
| cpu_util | gauge | % | 49618cae-dd28-41a0-ae97-e98899d717eb | 8f4f734443674afcbbb57b9909d5a07f | d6feddb5279a42f4854b93a729470448 |
| image | gauge | image | 1e7b0a5a-7b78-4673-8d56-3abff7b491ae | None | fa2046aaead44a698de8268f94759fc1 |
1.2 Sample
s1@controller:~$ ceilometer sample-list -m cpu_util
+--------------------------------------+----------+-------+---------------+------+---------------------+
| Resource ID | Name | Type | Volume | Unit | Timestamp |
+--------------------------------------+----------+-------+---------------+------+---------------------+
| 631507ed-598c-4e6d-8582-9fd7490e7805 | cpu_util | gauge | 22.5263157895 | % | 2015-03-29T13:22:10 |
| 49618cae-dd28-41a0-ae97-e98899d717eb | cpu_util | gauge | 0.0 | % | 2015-03-29T13:22:10 |
| 631507ed-598c-4e6d-8582-9fd7490e7805 | cpu_util | gauge | 21.85 | % | 2015-03-29T13:21:51 |
1.3 Statistics
+------------+---------------------+---------------------+-----+-----+-----+-----+-------+----------+---------------------+---------------------+
| Period | Period Start | Period End | Max | Min | Avg | Sum | Count | Duration | Duration Start | Duration End |
+------------+---------------------+---------------------+-----+-----+-----+-----+-------+----------+---------------------+---------------------+
| 10000000 | 2015-03-29T05:56:38 | 2046-12-05T07:43:18 | 0.0 | 0.0 | 0.0 | 0.0 | 17 | 11273.0 | 2015-03-29T05:56:38 | 2015-03-29T09:04:31 |
+------------+---------------------+---------------------+-----+-----+-----+-----+-------+----------+---------------------+---------------------+
1.4 Alarm:告警
在 Havana 版本中引入。参考文档
1.4.1 类型
Alarm 包括 threshold alarm (阈值告警)和 combination (组合告警)两种类型。
- Threshold alarm 根据监控指标的阈值去判断alarm的状态,它只是针对某一个监控指标建立alarm。它包括几个要素:
- 一个静态阈值和比较方法 (a static threshold value & comparison operator)
- 指定的 meter statistic (against which a selected meter statistic is compared)
- 比较的时间窗 (over an evaluation window of configurable length into the recent past.)
- Combination alarm 根据多个alarm的状态来判断自己的状态的,多个alarm之间是or/and的关系,这相当于是对多个监控指标建立了一个alarm。比如:
$ ceilometer alarm-combination-create --name meta \ --alarm_idsALARM_ID1\ --alarm_idsALARM_ID2\ --operator or \ --alarm-action 'http://example.org/notify'
1.4.2 CLI
Ceilometer Alarm CLI 支持一下Alarm的操作:
- create:[POST ] /alarms
- list: [GET ] /alarms
- get:[GET ] /alarms/<alarm>
- update:[PUT ] /alarms/<alarm>
- delete:[DELETE] /alarms/<alarm>
- histroy:GET /v2/alarms/{alarm_id}/history
使用 CLI 创建一个名为 "cpu_high" 的 Threshold Alarm “当连续 3 个 10 分钟内 某 instance 的 cpu_util 值超过70 的时候产告警,并其内容被写入日志文件”:
- name: 告警名称
- meter-name:meter 名称
- threshold: 阈值
- comparison_operator: 这个参数确定了怎么和阈值进行比较,有6个可选:lt, le, eq, ne, ge, gt,默认是eq
- statistic: 这个参数确定了使用什么数据去和 threshold 比较,有5种可选:max, min, avg, sum, count,默认是avg
- period: 这个参数其实有两个作用,一个是确定了获取该监控指标的监控数据的时间范围,和下面的 evaluation_periods 配合使用,另外一个作用就是它确定了两个点之间的时间间隔,默认是60s
- evaluation_periods: 表示连续的监控间隔数目。和 period 参数相乘,可以确定获取监控数据的时间范围,默认是1。
- alarm-action:告警产生后的反应。
- query: 该参数一般用于过滤到监控指标下的某个资源,默认是[]
1.4.3 Alarm 的状态
- ALARM (告警状态):
{"current": "alarm", "alarm_id": "742873f0-97f0-4d99-87da-b5f7c7829b7f", "reason": "Remaining as alarm due to 1 samples outside threshold, most recent: 0.138333333333", "previous": "alarm"}
- OK (数据充足,未告警):
{"current": "ok", "alarm_id": "742873f0-97f0-4d99-87da-b5f7c7829b7f", "reason": "Remaining as ok due to 1 samples inside threshold, most recent: 0.138333333333", "previous": "ok"}
- Insufficient Data (默认状态 - 数据不足):
{"current": "insufficient data", "alarm_id": "742873f0-97f0-4d99-87da-b5f7c7829b7f", "reason": "1 datapoints are unknown", "previous": "ok"}
1.4.4 Alarm Action
使用Ceilometer alarm-threshold/combination-create CLI 的如下属性来为不同状态的下的 Alarm 定义不同的 Action:
- --ok-action
- --alarm-action
- --insufficient-data-action
Ceilometer 支持两种Action:
- 'log://':Alarm 被写入 Log 文件
- Webhook URL: 这是一个 HTTP(S) endpoint 的URL,例如 'http://130.56.250.199:8080/alarm/instances_TOO_MANY'。Alarm 的内容会以 JSON 的格式被 POST 到该URL 中。
参考:http://blog.csdn.net/hackerain/article/details/38172941
2. Ceilometer 的数据处理
Ceilometer 的功能就是对上面各种概念的对象的处理:

| 功能名称 | 功能描述 | 提供功能Ceilometer 模块 |
| Collect | Meters 数据收集 |
ceilometer-agent-compute ceilometer-agent-central ceilometer-agent-notification ceilometer-collector |
| Transform | Meters 数据转换 | |
| Publish | Meters 数据发布 | |
| Store | Meters 数据保存 | |
| Read | Meters 数据访问 | ceilometer-api |
| Alarm | 告警 |
ceilometer-alarm-notifier
ceilometer-alarm-evaluator
|
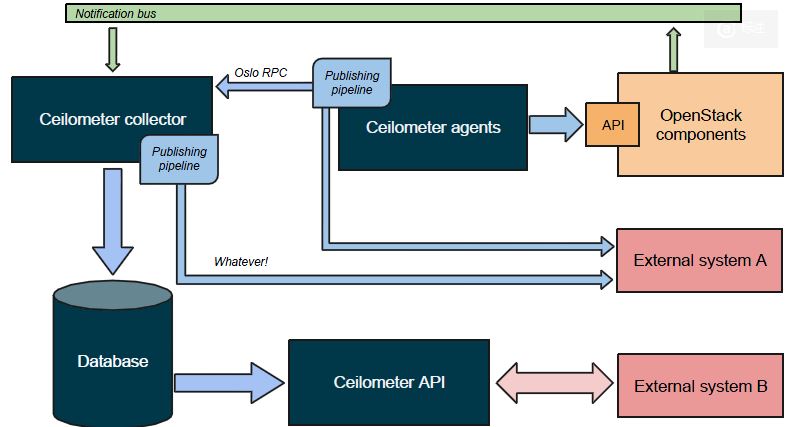
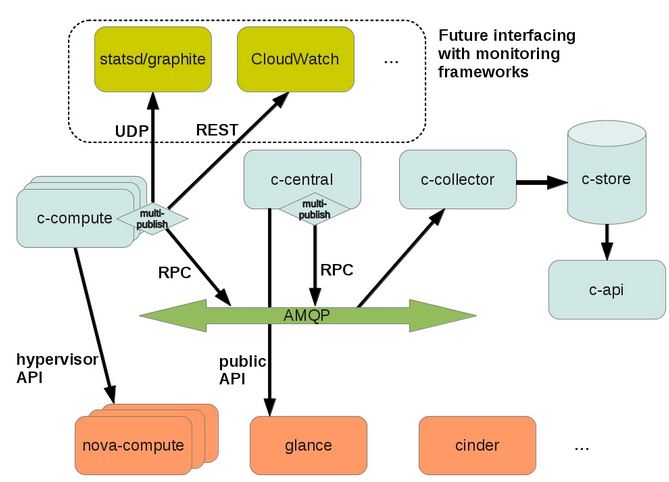
总体架构如下:
2.1 Meters数据的收集
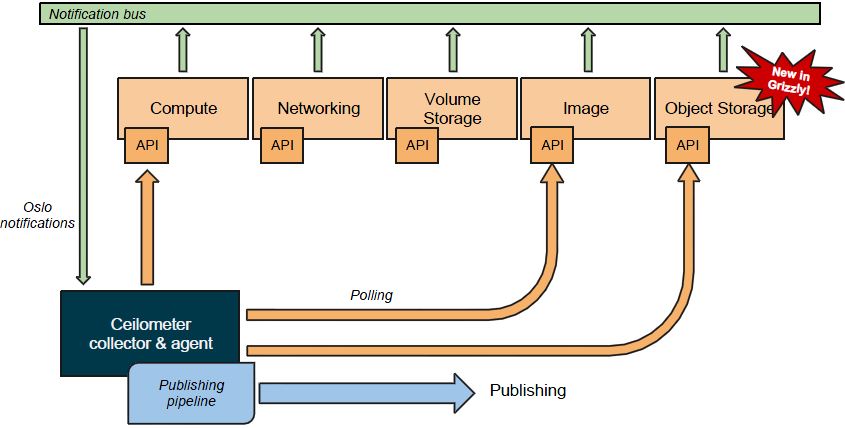
Ceilometer 有两种数据收集方式:
- Poller:
- Compute agent (ceilometer-agent-compute)运行在每个 compute 节点上,以轮询的方式通过调用 Image 的 driver 来获取资源使用统计数据。
- Central agent (ceilometer-agent-central)运行在 management server 上,以轮询的方式通过调用 OpenStack 各个组件(包括 Nova、Cinder、Glance、Neutron、Swift 等)的 API 收集资源使用统计数据。
- Notificaiton:Collector (ceilometer-collector)是一个运行在一个或者多个management server上的数据收集程序,它会监控 OpenStack 各组件的消息队列。队列中的 notification 消息会被它处理并转化为计量消息,再发回到消息系统中。计费消息会被直接保存到存储系统中。
除了监控这些对象以外,Ceilometer 还可以监控 Neutron 的 Bandwidth, 以及 hardware。关于数据收集的细节,会有另一篇文章来阐述。
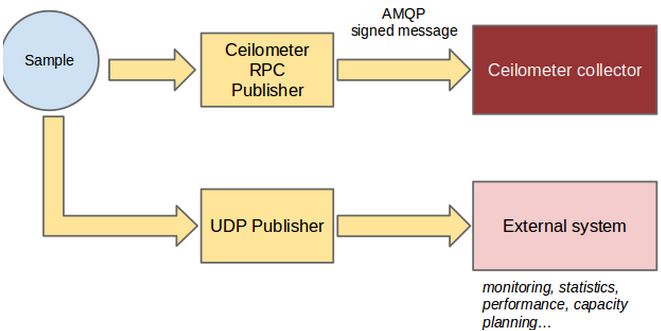
2.2 Meters 数据处理
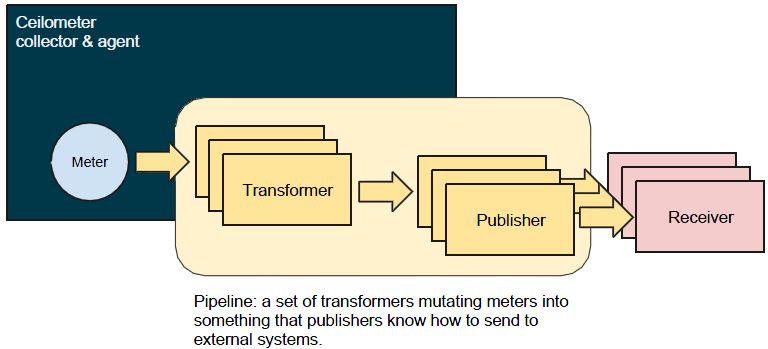
Meters 数据的处理使用 Pipeline 的方式,即Metes 数据依次经过(零个或者多个) Transformer 和 (一个或者多个)Publisher 处理,最后达到(一个或者多个)Receiver。其中Recivers 包括 Ceilometer Collector 和 外部系统。
2.2.1 Pipeline
Ceilometer 根据配置文件 /etc/ceilometer/pipeline.yaml 来配置 meters 所使用的 transformers 和 publishers。以 cpu meter 为例:
sources: A source is a producer of samples
......
  - name: cpu_source
    interval: 600
    meters:
        - "cpu"
    sinks:
        - cpu_sink

......
sinks: A sink on the other hand is a chain of handlers of samples
......
  - name: cpu_sink
    transformers:
      - name: "rate_of_change"
        parameters:
                target:
                    name: "cpu_util"
                    unit: "%"
                    type: "gauge"
                    scale: "100.0 / (10**9 * (resource_metadata.cpu_number or1))"
     publishers:
         - notifier://
这段代码定义了 cpu meter 的 :
- interval: 600:Poller 获取 cpu samples 的间隔为 10 分钟
- cpu meter 的 transformer 为 "rate_of_change"
- cpu meter 的 publisher 为 notifier://,它使用默认的配置经过 AMQP 使用 oslo.messaging 发出数据
该配置文件的详细信息可参考 http://docs.openstack.org/developer/ceilometer/configuration.html
2.2.1 Transformer 转换器
Transformer 即 Sample 的转换器。常见的 transformer 包括:
- unit_conversion: 单位转换器,比如温度从°F 转换成°C
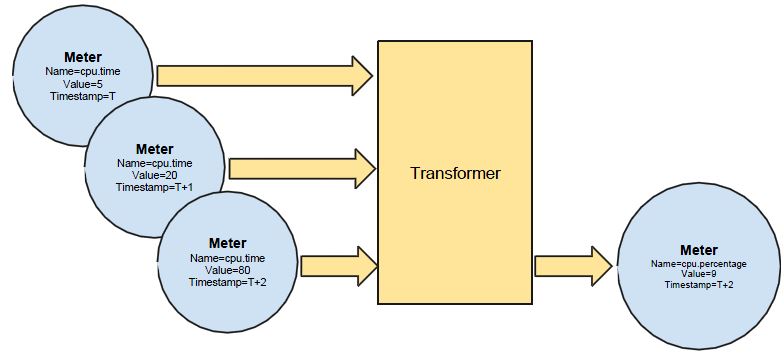
- rate_of_change: 计算方式转换器,比如根据一定的计算规则来转换一个sample。例如:
name: "rate_of_change"
parameters:
target:
name: "cpu_util"
unit: "%"
type: "gauge"
scale: "100.0 / (10**9 * (resource_metadata.cpu_number or 1))"
- accumulator: 累计器。如下图示例:
2.2.2 Publisher 分发器
参考文档: http://docs.openstack.org/admin-guide-cloud/content/section_telemetry-publishers.html
Ceilometer 支持如下几种 Publishers:
| Publisher | 格式 | 说明 | 配置项 | 示例 |
| Notifier | notifier://?option1=value1&option2=value2 | samples 数据被发到 AMQP 系统,然后被 Ceilometer collecter 接收。默认的 AMQP Queue 是 metering_topic=metering。这默认的方式。 |
[publisher_notifier] |
notifier://?policy=drop&max_queue_length=512 |
| RPC | rpc://?option1=value1&option2=value2 | 与 notifier类似,同样经过 AMQP, 不过是同步操作,因此可能有性能问题。 |
[publisher_rpc] |
rpc://?per_meter_topic=1 |
| UDP | udp://<host>:<port>/ | 经过 UDP port 发出。默认的 UDP 端口是 4952 | udp_port=4952 |
udp://10.0.0.2:1234 |
| File | file://path?option1=value1&option2=value2 | 发送到文件保存 |
可以在 /etc/ceilometer/pipeline.yaml 中为某个 meter 配置多个 publisher。比如增加一个file publisher:
sinks:
    - name: meter_sink
      transformers:
      publishers:
          - notifier://
          - file:///var/log/ceilometer/ceilometer-file-publisher #新增的file publisher
那么在该文件中你会看到如下的 sample:
{'user_id': None, 'name': 'image', 'resource_id': u'bb8838d5-06b5-4f7e-b6ef-87c908f04cc7', 'timestamp': '2015-03-29T15:39:05Z', 'resource_metadata': {'status': u'active', 'name': u'cinderimg', 'deleted': False, 'container_format': u'bare', 'created_at': u'2015-01-21T17:15:56', 'disk_format': u'qcow2', 'updated_at': u'2015-01-21T17:15:56', 'protected': True, 'min_ram': 0, 'checksum': u'64d7c1cd2b6f60c92c14662941cb7913', 'min_disk': 0, 'is_public': False, 'deleted_at': None, 'properties': {}, 'size': 13167616}, 'volume': 1, 'source': 'openstack', 'project_id': u'fa2046aaead44a698de8268f94759fc1', 'type': 'gauge', 'id': 'bb2b4142-d629-11e4-925a-080027ff4b45', 'unit': 'image'}
2.3 数据保存
参考文档:http://docs.openstack.org/admin-guide-cloud/content/section_telemetry-storing-data.html
Ceilometer Collector 从 AMQP 接收到数据后,会原封不动地通过一个或者多个分发器(dispatchers)将它保存到指定位置。目前它支持的分发器:
- 文件分发器:保存到文件 - 添加配置项dispatcher = file 和 [dispatcher_file] 部分的配置项
- HTTP 分发器:保存到外部的 HTTP target - 添加配置项 dispatcher = http
- 数据库分发器:保存到数据库 - 添加配置项 dispatcher = database。参考文档
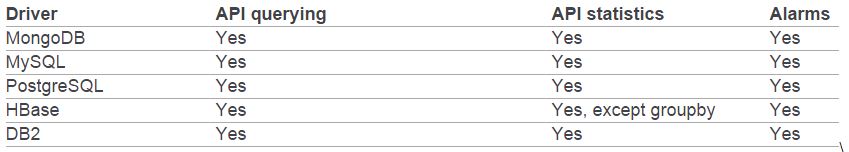
- MongoDB:默认DB。
- SQL DB:支持 mysql、postgreSQL 和 IBM DB2等。
- HBase DB

Ceilometer 支持同时配置多个分发器,将数据保存到多个目的位置。比如在 ceilometer.conf 中做如下配置使得同时使用 file 和 database dispatcher:
[DEFAULT]
dispatcher = database
dispatcher = file

[dispatcher_file]
backup_count = 5
file_path = /var/log/ceilometer/ceilometer-samples
max_bytes = 100000
在 /var/log/ceilometer/ceilometer-samples 文件中将收到如下类似的 samples 数据:
[{u'counter_name': u'cpu_util', u'user_id': u'8f4f734443674afcbbb57b9909d5a07f', u'message_signature': u'21fdc2cbf50b4da39746eba47ac0a1b742c759a1bb42e17c00e293413c356a38', u'timestamp': u'2015-03-29T14:47:10Z', u'resource_id': u'49618cae-dd28-41a0-ae97-e98899d717eb', u'message_id': u'7ad714f6-d622-11e4-8f83-080027df9b16', u'source': u'openstack', u'counter_unit': u'%', u'counter_volume': 0.0, u'project_id': u'd6feddb5279a42f4854b93a729470448', u'resource_metadata': {u'status': u'shutoff', u'cpu_number': 1, u'ramdisk_id': None, u'display_name': u'vm-1-for-user-one', u'name': u'instance-0000000e', u'disk_gb': 1, u'kernel_id': None, u'image': None, u'ephemeral_gb': 0, u'host': u'5d9f88849c5458f5b903fbc7a7d19bb90c3a4b0c492c5180434d216d', u'memory_mb': 100, u'instance_type': u'7124c366-3e56-4923-b32a-124ee31abaf7', u'vcpus': 1, u'root_gb': 1, u'image_ref': None, u'flavor': {u'name': u'tiny', u'links': [{u'href': u'http://controller:8774/e5defbf994694519b1261fa855a058ae/flavors/7124c366-3e56-4923-b32a-124ee31abaf7', u'rel': u'bookmark'}], u'ram': 100, u'ephemeral': 0, u'vcpus': 1, u'disk': 1, u'id': u'7124c366-3e56-4923-b32a-124ee31abaf7'}, u'OS-EXT-AZ:availability_zone': u'nova', u'image_ref_url': None}, u'counter_type': u'gauge'}]
2.4 数据访问
外部系统通过 ceilometer-api 模块提供的 Ceilometer REST API 来访问保存在数据库中的数据。API 有 V1 和 V2 两个版本,现在使用的是 V2.
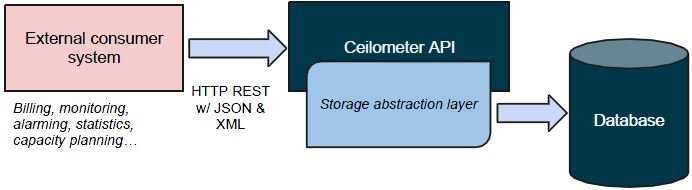
API Service 默认在 8777 端口监听 (#port=8777)。V2 API 列表在这里。
2.5 告警
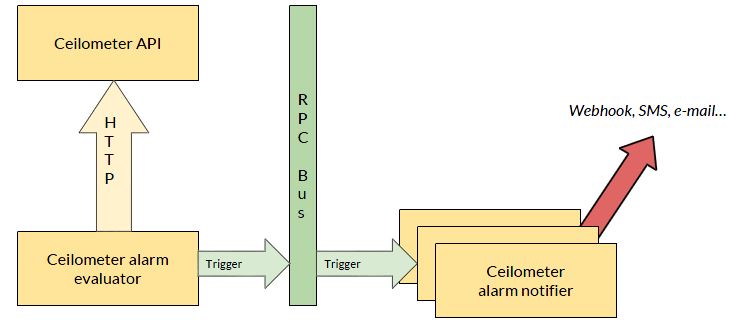
2.5.1 架构
(1)ceilometer-alarm-evaluator 使用 Ceilometer REST API 获取 statistics 数据
(2)ceilometer-alarm-evaluator 生成 alarm 数据, 并通过 AMQP 发给 ceilometer-alarm-notifer
(3)ceilometer-alarm-notifer 会通过指定方式把 alarm 发出去。
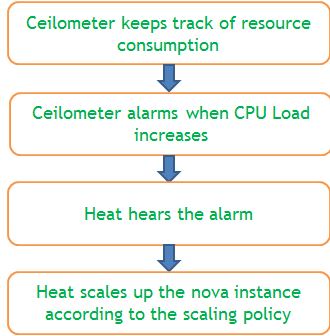
2.5.2 Heat 和 Ceilometer 通过 Ceilometer Alarm 进行交互来实现 Instance auto-scaling
参考文档:http://superuser.openstack.org/articles/simple-auto-scaling-environment-with-heat
示意图:
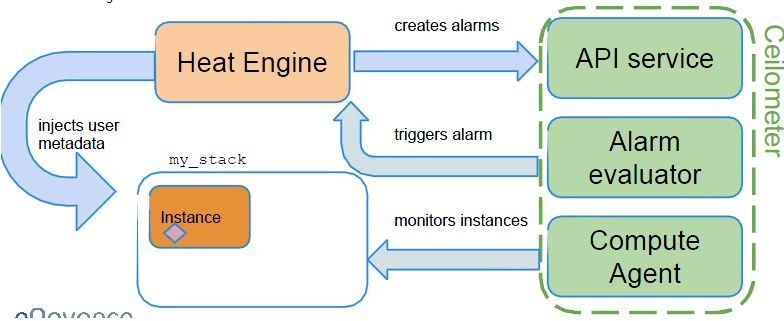
步骤:
3. 总体架构
3.1 总体架构

3.2 特点
(1)Ceilometer 的架构的开放性应该说非常好,处处都留有和外部系统交互的接口。
(2)其性能可能是个问题,特别是大的生产系统中计量数据量非常大的情况下。据说京东对该模块有很大的修改后才用到其生产系统中。
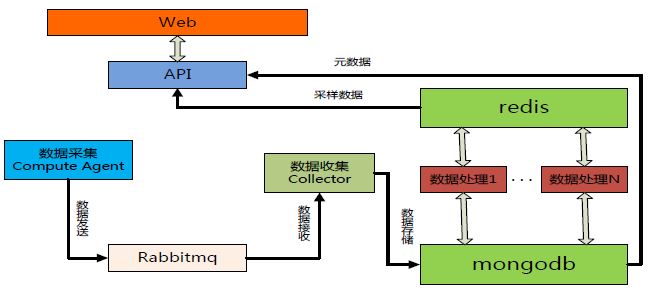
3.3 京东对 Ceilometer 的优化 (摘自京东架构师在2015年初OpenStack meetup 上的材料)
- 消息跟踪:集成 Stacktach 到 Ceilometer,跟踪message
- 性能优化:
- 增加数据处理服务 + cache,提升ceilometer-api 和 alarm 性能
- 自研 filter 功能,直接 hook 在 collector 进程上面,做到及时告警
- 去 MQ,使用自研 RPC 传输监控 sample,并采用 gzip 压缩
- 功能增强:增加邮件告警功能,做到告警及时通知
参考文档:

 浙公网安备 33010602011771号