
python 出图中文显示问题
增加一句
import matplotlib
# 设置字体为系统中的中文字体(这里以SimHei为例,适用于Windows)
matplotlib.rcParams['font.sans-serif'] = ['SimHei']
import matplotlib.pyplot as plt
import matplotlib
# 设置字体为系统中的中文字体(这里以SimHei为例,适用于Windows)
matplotlib.rcParams['font.sans-serif'] = ['SimHei']
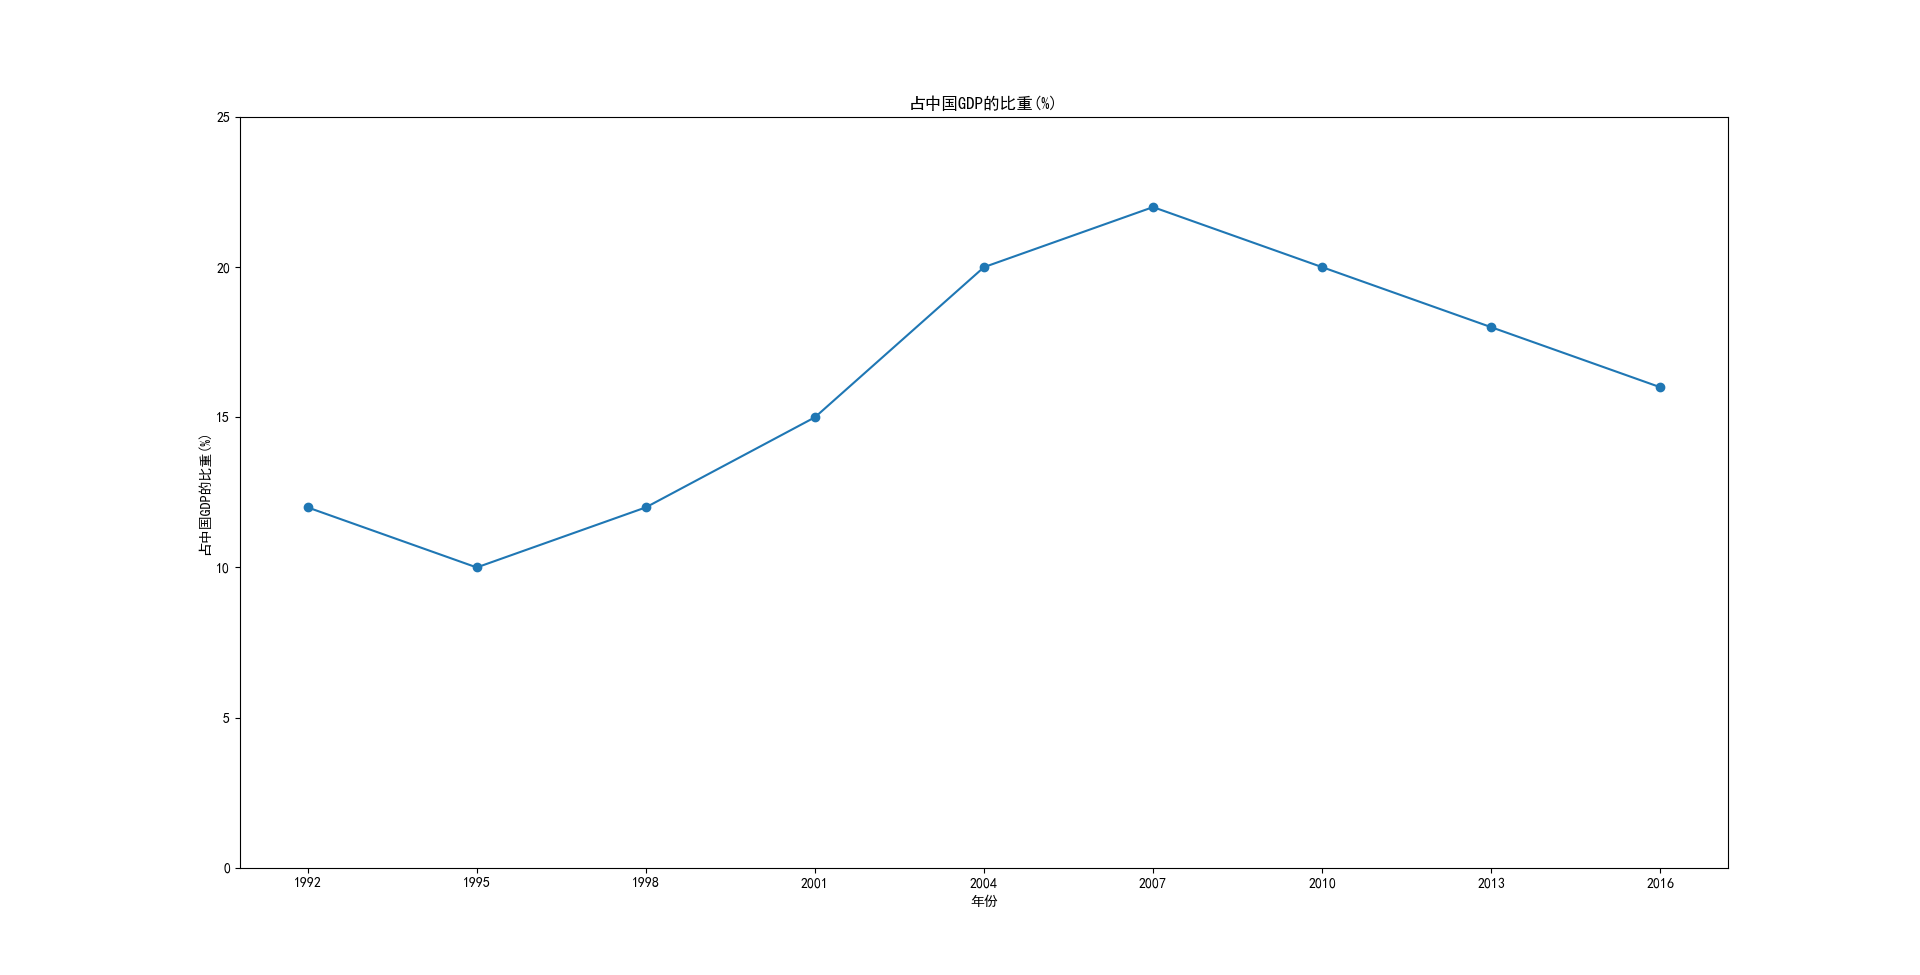
# 年份数据
years = [1992, 1995, 1998, 2001, 2004, 2007, 2010, 2013, 2016]
# 占中国GDP比重数据
gdp_percentage = [12, 10, 12, 15, 20, 22, 20, 18, 16]
# 绘制折线图
plt.plot(years, gdp_percentage, marker='o')
# 设置标题和坐标轴标签
plt.title("占中国GDP的比重(%)")
plt.xlabel("年份")
plt.ylabel("占中国GDP的比重(%)")
# 设置刻度
plt.xticks(years)
plt.yticks([0, 5, 10, 15, 20, 25])
# 显示图形
plt.show()
 浙公网安备 33010602011771号