![image]()
import numpy as np
import matplotlib.pyplot as plt
from matplotlib.patches import Circle, FancyArrowPatch
from matplotlib.animation import FuncAnimation
# 创建一个新图和两个坐标轴
fig, (ax1, ax2) = plt.subplots(1, 2, figsize=(12, 6))
# 设置坐标轴的等比例,确保圆圈是正圆
ax1.set_aspect('equal')
ax2.set_aspect('auto')
# 限制坐标轴的范围
ax1.set_xlim(-1.5, 1.5)
ax1.set_ylim(-1.5, 1.5)
ax2.set_xlim(0, 2 * np.pi)
ax2.set_ylim(-1.5, 1.5)
# 设置坐标轴标签
ax1.set_xlabel('X axis')
ax1.set_ylabel('Y axis')
ax2.set_xlabel('Angle (radians)')
ax2.set_ylabel('Amplitude')
# 设置标题
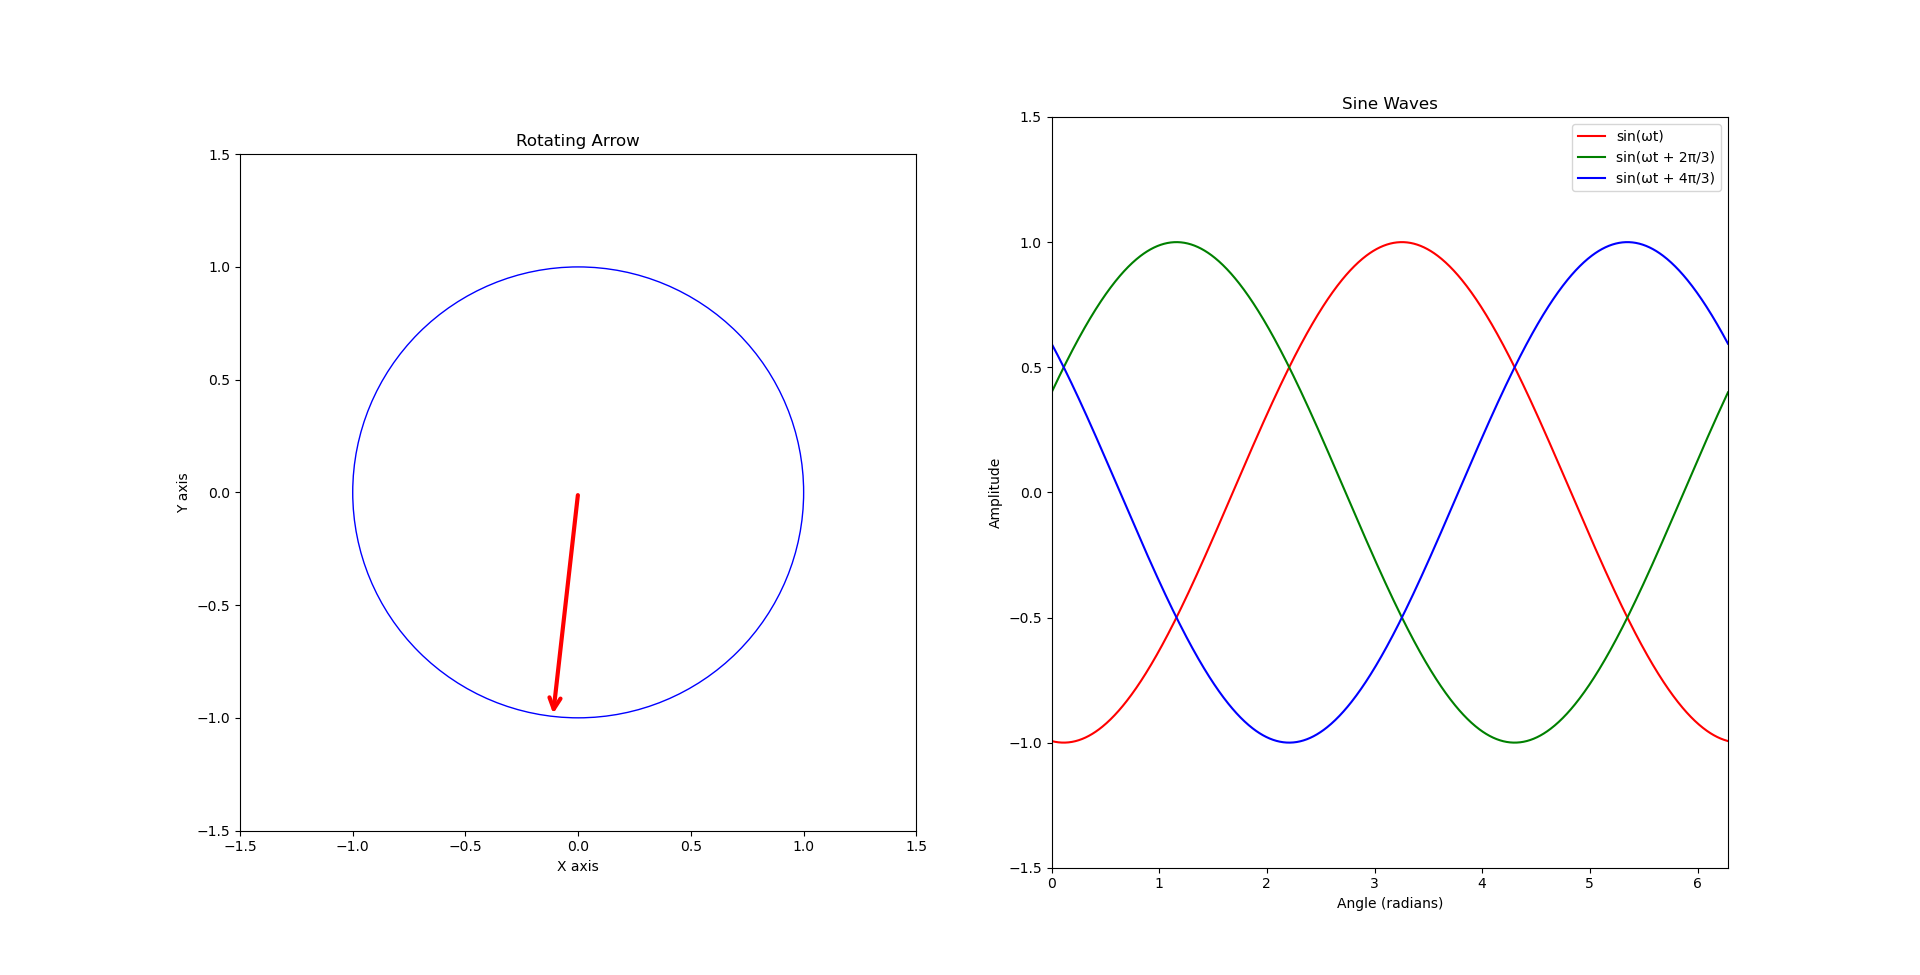
ax1.set_title('Rotating Arrow')
ax2.set_title('Sine Waves')
# 绘制一个圆圈
circle = Circle((0, 0), 1, color='blue', fill=False)
ax1.add_patch(circle)
# 初始化箭头的参数
arrow = FancyArrowPatch((0, 0), (1, 0), color='red', mutation_scale=20, arrowstyle='->', lw=3)
ax1.add_patch(arrow)
# 初始化正弦波的线
x_data = np.linspace(0, 2 * np.pi, 1000)
line1, = ax2.plot(x_data, np.sin(x_data), 'r-', label='sin(ωt)')
line2, = ax2.plot(x_data, np.sin(x_data + 2 * np.pi / 3), 'g-', label='sin(ωt + 2π/3)')
line3, = ax2.plot(x_data, np.sin(x_data + 4 * np.pi / 3), 'b-', label='sin(ωt + 4π/3)')
# 添加图例
ax2.legend()
# 初始化角度
angle = 0
# 更新函数,用于动画
def update(frame):
global angle
angle += 0.05 # 每次旋转0.05弧度
if angle > 2 * np.pi: # 如果角度超过2π,则重置角度
angle = 0
# 更新箭头的位置
arrow.set_positions((0, 0), (np.cos(angle), np.sin(angle)))
# 更新正弦波的数据
line1.set_ydata(np.sin(x_data + angle))
line2.set_ydata(np.sin(x_data + angle + 2 * np.pi / 3))
line3.set_ydata(np.sin(x_data + angle + 4 * np.pi / 3))
return arrow, line1, line2, line3
# 创建动画
ani = FuncAnimation(fig, update, frames=np.arange(0, 360), interval=50, blit=True, repeat=True)
# 显示图形
plt.show()

 浙公网安备 33010602011771号