docker-compose部署prometheus+grafana进行服务器监控
1、创建prometheus【prometheus.yml】配置
global:
  scrape_interval:     15s
  evaluation_interval: 15s

scrape_configs:
  - job_name: 'prometheus'
    static_configs:
      - targets: ['192.168.2.216:9090']
  - job_name: 'nodes'
    static_configs:
      - targets: ['192.168.25.250:19000'] #需要监控的节点node_exporte地址
2、创建【docker-compose.yml】
version: '3'

services:
  prometheus:
    image: prom/prometheus
    container_name: prometheus
    ports:
      - "9090:9090"
    volumes:
      - ./config/prometheus.yml:/etc/prometheus/prometheus.yml
      - ./data:/prometheus
3、启动prometheus
docker-compose up -d
4、访问服务
http://192.168.2.216:9090/graph
5、需要检测的服务器部署检测端node_exporte
version: '3'

services:
  node_exporter:
    image: prom/node-exporter:v1.3.1
    container_name: node_exporter
    ports:
      - "19000:9100"
    volumes:
      - /proc:/host/proc:ro
      - /sys:/host/sys:ro
      - /:/rootfs:ro
    restart: always
启动后,添加到prometheus.yml配置中
6、创建Grafana.yml
version: '3'

services:
  grafana:
    image: grafana/grafana
    container_name: "grafana"
    ports:
      - "3000:3000"
    restart: always
    volumes:
      - "./grafana_data:/var/lib/grafana"
访问地址:http://192.168.2.216:3000/ 账号密码:admin/admin
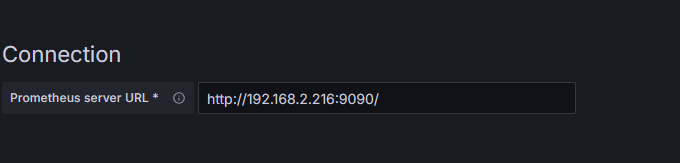
7、添加Prometheus

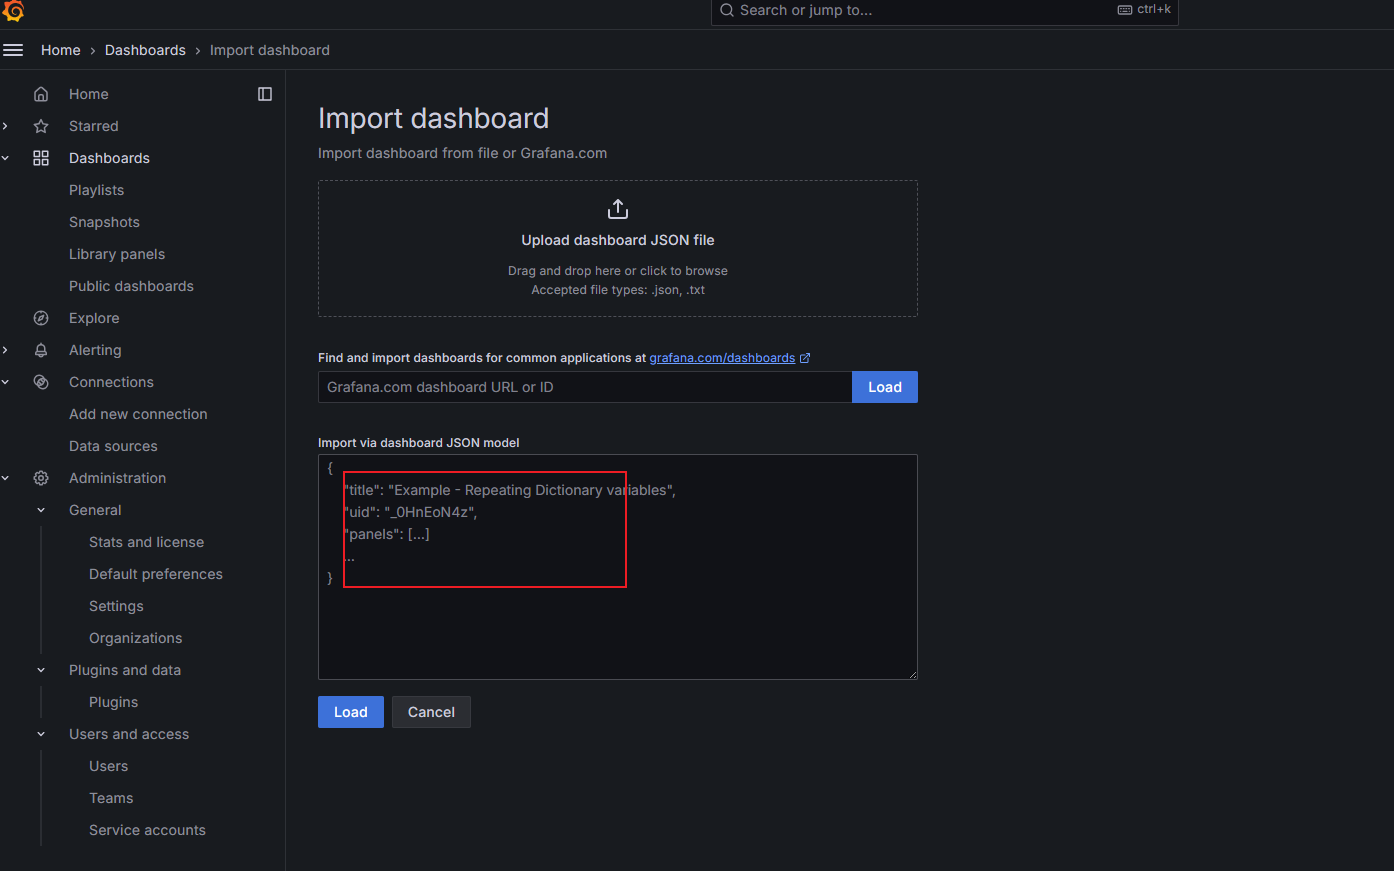
8、添加dashboards
进入官网下载dashboards
下载文件:Node Exporter Full | Grafana Labs


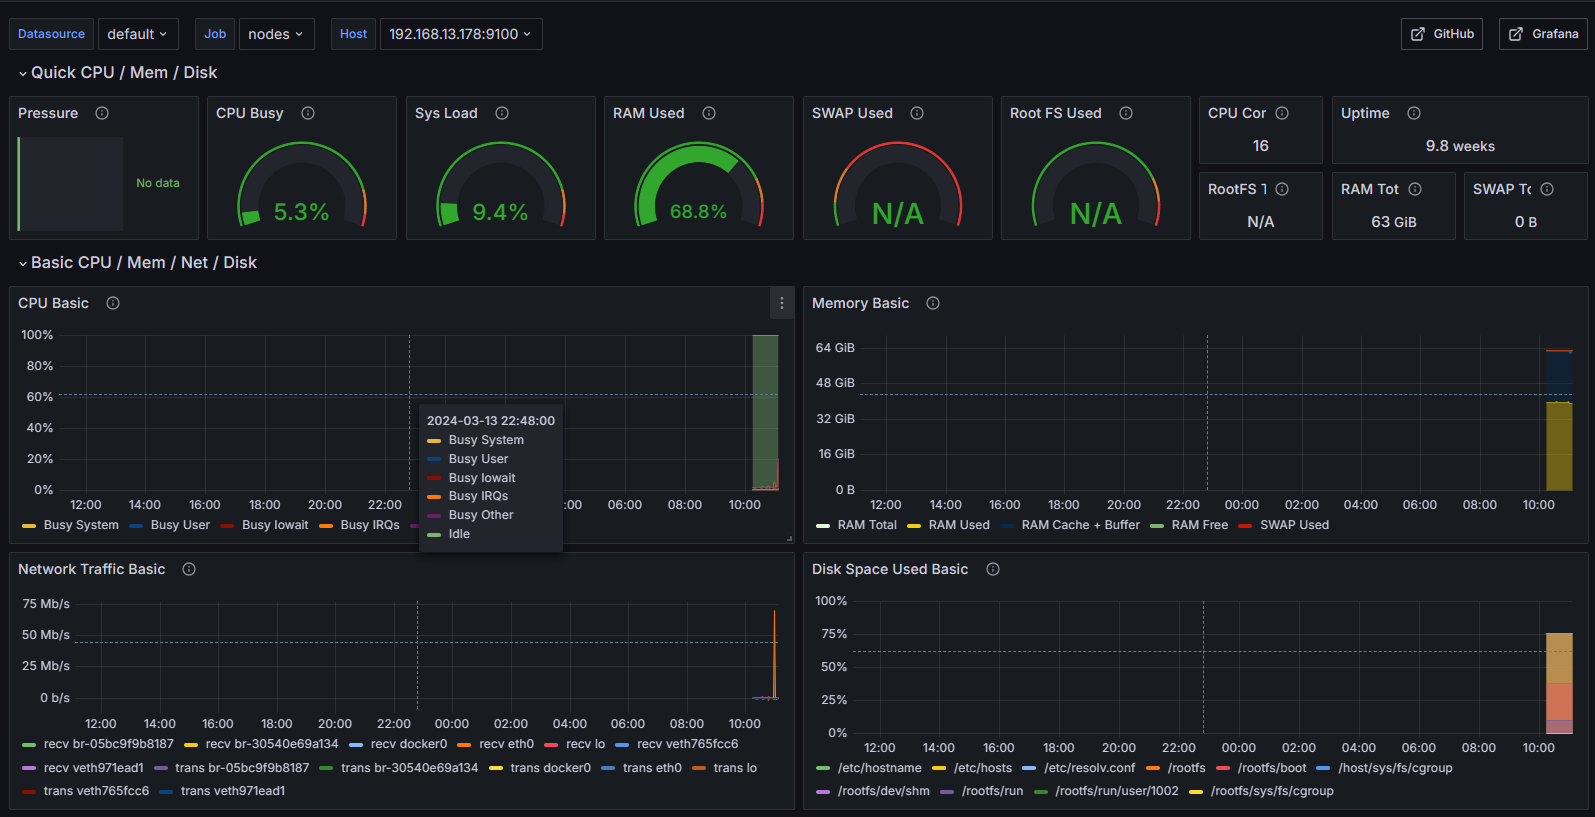
9、效果

 浙公网安备 33010602011771号