TIKZ——LaTeX基本绘图
TIKZ是LaTeX的一个绘图包,可以绘制其他软件很难画出来的图像。
基本用法
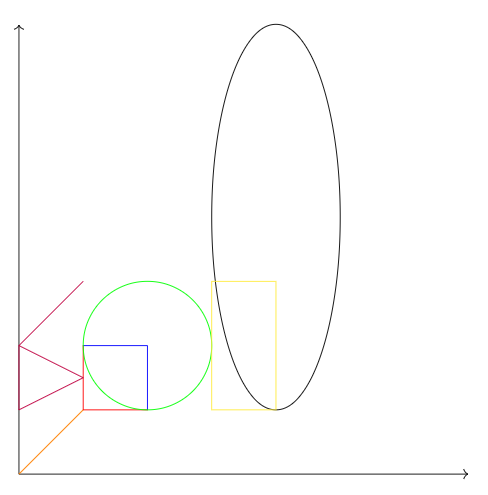
直线、垂足、矩形、椭圆
代码:
\documentclass{article}
\usepackage{tikz}
\usetikzlibrary{arrows.meta}%画箭头用的包
\begin{document}

\begin{tikzpicture}

    \draw[->] (0,0)--(7,0);
    \draw[->] (0,0)--(0,7); %箭头线

    \draw[red] (2,1) -| (1,2);%直角1
    \draw[blue] (2,1)|-(1,2);%直角2
    \draw[green] (2,2) circle (1);%圆:圆心、半径
    \draw[black] (4,4) ellipse (1 and 3);%椭圆:短、长半轴
    \draw[yellow] (3,3) rectangle (4,1);%矩形
    \draw[orange] (0,0) -- (2,1-|1,2);%找到垂点并与(0,0)连线
    \draw[purple] (0,1)--(1,1.5)--(0,2)--cycle  %封闭的线段
                  (0,2)--(1,3);%不加分号的连写
\end{tikzpicture}

\end{document}
效果图:
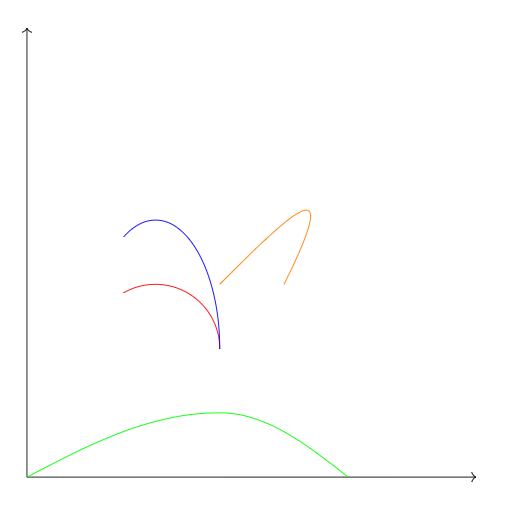
圆弧、椭圆弧、三角函数曲线、贝塞尔曲线
代码:
\documentclass{article}
\usepackage{tikz}
\usetikzlibrary{arrows.meta}%画箭头用的包
\begin{document}

\begin{tikzpicture}
    \draw[->] (0,0)--(7,0);
    \draw[->] (0,0)--(0,7); %箭头线

    \draw[red] (3,2) arc (0:120:1);%圆弧:起始点,开始角度:结束角度:半径
    \draw[blue] (3,2) arc (0:120:1 and 2);%椭圆弧
    \draw[green] (0,0) sin (3,1) cos (5,0);%画pi/2的正弦、余弦
    \draw[orange] (3,3)..controls (4,4)and(5,5) .. (4,3); %贝塞尔曲线:起点..controls 控制点 and 控制点..终点
\end{tikzpicture}
\end{document}
效果图:
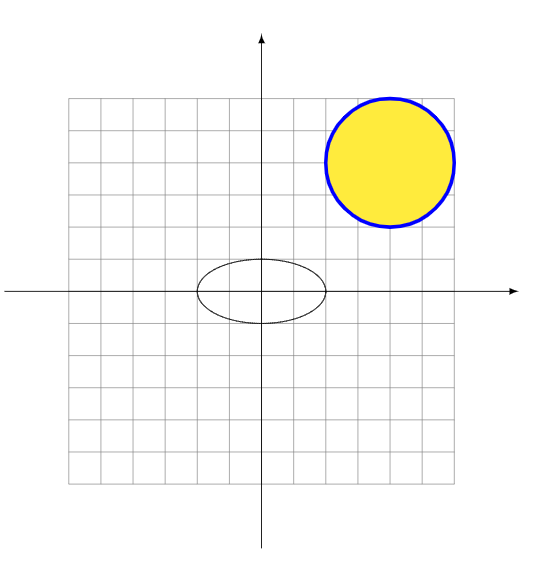
辅助线、网格、填充、自定义函数
代码:
\documentclass{article}
\usepackage{tikz}
\usetikzlibrary{arrows.meta}%画箭头用的包
\begin{document}

\begin{tikzpicture}
    \draw[help lines,step = 0.5] (-3,-3) grid (3,3); %辅助线格子
    \draw[-latex] (-4,0) -- (4,0);
    \draw[-latex] (0,-4) -- (0,4);%实心箭头
    \draw[domain = -2:360][samples = 200] plot({cos(\x)}, {0.5*sin(\x)});%函数图像,参数方程,内有小括号,外面必须用花括号括起来,samples是画函数图时列出的点
    \filldraw[fill = yellow,draw = blue][ultra thick] (2,2) circle (1);%填色,还可以设置线宽
\end{tikzpicture}
\end{document}
效果图:
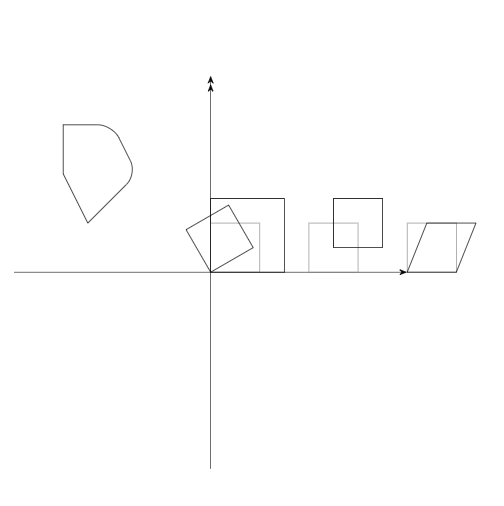
图形旋转、平移、缩放、变形、圆角多边形、箭头设置
代码:
\documentclass{article}
\usepackage{tikz}
\usetikzlibrary{arrows.meta}%画箭头用的包
\begin{document}

\begin{tikzpicture}[>=Stealth]%设置箭头,环境中所有箭头都用这个库
    \draw[->] (-4,0) -- (4,0);
    \draw[->>] (0,-4) -- (0,4);
    \draw(-3,2)--(-3,3)[rounded corners = 0.3cm]
    -- (-2,3)--(-1.5,2)[sharp corners]--(-2.5,1)--cycle;%圆角多边形

    \draw[help lines](0,0) rectangle (1,1);%辅助线
    \draw[scale=1.5] (0,0) rectangle (1,1);%缩放
    \draw[rotate=30] (0,0) rectangle (1,1);%扰起点旋转

    \draw[help lines](2,0) rectangle (3,1);
    \draw[shift={(0.5,0.5)}](2,0) rectangle (3,1);%平移

    \draw[help lines](4,0) rectangle (5,1);
    \draw[xslant=0.4](4,0) rectangle (5,1);%倾斜

\end{tikzpicture}

\end{document}
效果图:
锚点、自定义属性
代码:
\documentclass{article}
\usepackage{tikz}
\usetikzlibrary{arrows.meta}%画箭头用的包
\begin{document}

\begin{tikzpicture}
    \draw[->] (-4,0) -- (4,0);
    \draw[->>] (0,-4) -- (0,4);

    \node (A) at (2,2) {$A_1$};
    \node[draw] (B) at (3,2) {B};%draw属性添加自适应大小的方框
    \node[draw] (C) at (2.5,3) {};
    \draw (A) -- (B.center) -- (C.north) -- (A);%连线可以连到字母方框的某个位置:center/north/south/east/west
    \node[draw,anchor=east] (a) at (A) {$a_0$};%定义A的锚点在A位置的东部,然后定义a,并将其位置定义为A位置的中心
    \node[draw,below right=4pt] (b) at (B) {b};%在相对于B的位置右下方4pt的地方定义b

    \node[circle,fill=blue,text=white,font={\bfseries}]
        (A) at (0,0) {A node};%填充、各种可自定义的参数
    \node[rectangle,rounded corners,draw=gray,font={\sffamily\slshape}]
        (B) at (2,0) {B node};

    \node[draw] (P) at (-3,3){center};
    \draw[dotted] (0,0)--(P.south);%画某点到某点的南边的线
\end{tikzpicture}

\end{document}
效果图:

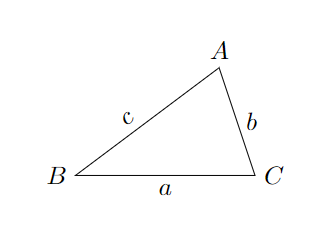
线段与点的标注
代码:
\documentclass{article}
\usepackage{tikz}
\usetikzlibrary{arrows.meta}%画箭头用的包
\begin{document}

\begin{tikzpicture}
    \draw (2,1.5)coordinate (A)node[above] {$A$}%定义点A并标注A
        --node[above left,sloped] {$c$}%给线标注c
          (0,0)coordinate (B)node[left] {$B$}
        --node[below]{$a$}
          (2.5,0)coordinate (C)node[right]{$C$}
        --node[right]{$b$}
          cycle;
\end{tikzpicture}

\end{document}
效果图:
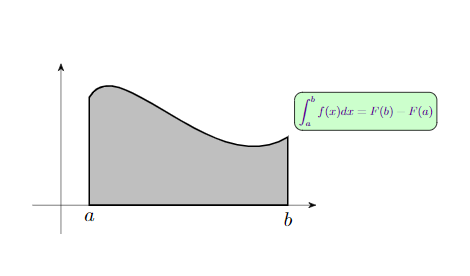
例子
代码:
\documentclass{article}
\usepackage{tikz}
\usetikzlibrary{arrows.meta}%画箭头用的包
\begin{document}

\begin{tikzpicture}[>=Stealth]
    \draw[->,line width=0.2pt](-0.5,0)--(4.5,0);
    \draw[->,line width=0.2pt](0,-0.5)--(0,2.5);
    \coordinate (a) at (0.5,1.9);
    \coordinate (b) at (4,1.2);
    \coordinate (a0) at (a |- 0,0);
    \coordinate (b0) at (b |- 0,0);
    \node[below] at (a0) {$a$};
    \node[below] at (b0) {$b$};
    \filldraw[fill=gray!50,draw,thick]
        (a0)--(a)..controls(1,2.8)and(2.7,0.4)..(b)--(b0)--cycle;
    \node[above right,outer sep=0.2cm,rounded corners,fill = green!20,draw = black,text = blue!60!red,scale = 0.6] %blue60,red40
        at (b) {$\displaystyle\int_a^bf(x)dx = F(b)-F(a)$};%写标注,draw边框,fill填充,scale字体大小
\end{tikzpicture}

\end{document}
效果图:
用循环、判断语句绘图
代码:
\documentclass{article}
\usepackage{tikz}
\usepackage{pgffor}%可以使用foreach的包
\usepackage{ifthen}%可以使用ifthenelse的包,还能使用whiledo

\begin{document}
\begin{tikzpicture}
    \foreach \i in {0,...,5}{
        \foreach \j in {0,...,\i}{
            \ifthenelse{\i > 3}{%if成立
                \node[fill = green!20,rounded corners]at (\i,\j) {(\i,\j)};
            }{%if不成立
                \node[fill = red!20,rounded corners]at (\i,\j) {(\i,\j)};
            }
        }
    }
\end{tikzpicture}
\end{document}
效果图:

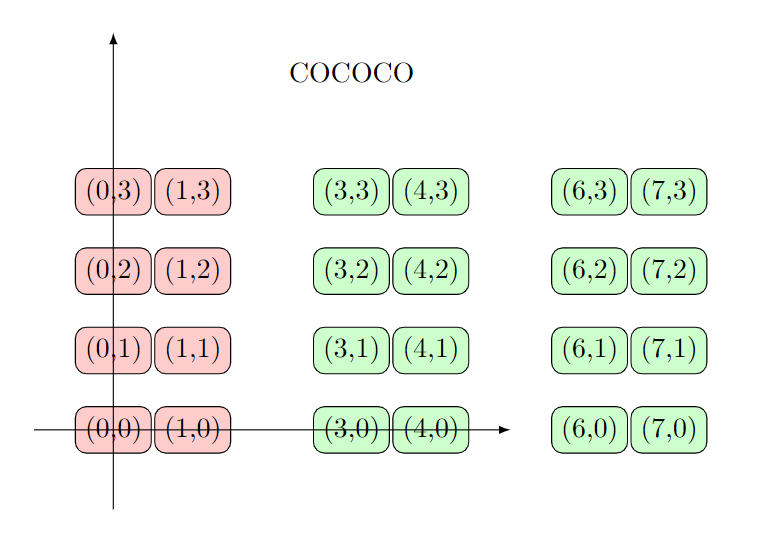
定义变量、使用函数
这个库可以让你使用过程语言结合LaTeX的画图脚本的来画图,十分方便。主要就是导入math库:
\usetikzlibrary{math}%使用数学程序
\usetikzlibrary{fpu}%修理不能使用ifthenelse的错误
代码:
\documentclass{article}
\usepackage{tikz}
\usetikzlibrary{fpu}%修理不能使用ifthenelse的错误!!!!!!!!!!!!!!!!!!!!!!!!!!!!!
\usetikzlibrary{math}%使用数学程序
\begin{document}
\begin{tikzpicture}
    \tikzmath{ %数学程序编写,定义的变量可以在其外部使用,里面所有语句都要加分号; 并且不能有多余的回车
        function paint_loop(\x,\y){ %函数中只能使用局部变量,外部变量不能用
            for \i in {0,1,...,\x}{
                for \j in {0,...,\y}{
                    int \ii,\jj;
                    \ii = \i*1.5;
                    \jj = \j;
                    if \ii > 2 then {%条件分支语句
                        {%绘图代码在数学程序内部使用,要用画括号括起来!!!!
                            \node[draw,fill = green!20,rounded corners] at (\ii,\jj) {(\ii,\jj)};
                        };
                    }else{
                        {
                            \node[draw,fill = red!20,rounded corners] at (\ii,\jj) {(\ii,\jj)};
                        };
                    };
                };
            };
        };
        \a = 5; %和python一样,加个.就是实数,不加点就是小数
        \b = 3;
        paint_loop(\a,\b);
        coordinate \co;%能自定义的变量有int、real、coordinate(坐标),不能在定义的时候赋值
        \co = (3,4.5);
    }
    \draw[-latex] (-1,0) -- (5,0);
    \draw[-latex] (0,-1) -- (0,5);
    \node at (\co) {COCOCO}; %在tikzmath中定义的变量在能外部使用

\end{tikzpicture}
\end{document}
效果图:
绘制神经网络图
代码:
\documentclass{article}
\usepackage{tikz}
\usetikzlibrary{fpu}%修理不能使用ifthenelse的错误!!!!!!!!!!!!!!!!!!!!!!!!!!!!!
\usetikzlibrary{math}%使用数学程序
\begin{document}
\begin{tikzpicture}
    \tikzmath{
        function paint_nodes(\radius,\gapy,\posx,\num){
            \gapy = \gapy+\radius*2;
            \starty = \gapy*(\num-1)/2;
            for \i in {0,...,\num-1}{
                \drawy = \starty - \i*\gapy;
                {
                    \filldraw[line width = 0.5pt,fill = white] (\posx,\drawy) circle (\radius);
                };
            };
        };
        function paint_lines(\radius,\gapy,\posx,\num,\nextposx,\nextnum){
            \gapy = \gapy+\radius*2;
            \starty = \gapy*(\num-1)/2;
            \startyy = \gapy*(\nextnum-1)/2;
            for \i in {0,...,\num-1}{
                \drawy = \starty - \i*\gapy;
                for \j in {0,...,\nextnum-1}{
                    \drawyy = \startyy - \j*\gapy;
                    {
                        \draw (\posx,\drawy) -- (\nextposx,\drawyy);
                    };
                };
            };
        };
        function paint_x_lines(\radius,\gapy,\posx,\num,\ifright,\len){
            \gapy = \gapy+\radius*2;
            \starty = \gapy*(\num-1)/2;
            for \i in {0,...,\num-1}{
                \drawy = \starty - \i*\gapy;
                if \ifright == 1 then{
                    {
                        \draw[-latex] (\posx,\drawy) -- (\posx+\len,\drawy);
                    };
                }else{
                    {
                        \draw[-latex] (\posx,\drawy)--(\posx-\len,\drawy);
                    };
                };
            };
        };
        function paint_net(\x0,\x1,\x2,\x3){
            \gapx = 2;
            \radius = 0.3;
            \gapy = 0.2;
            paint_lines(\radius,\gapy,0*\gapx,\x0,1*\gapx,\x1);
            paint_lines(\radius,\gapy,1*\gapx,\x1,2*\gapx,\x2);
            paint_lines(\radius,\gapy,2*\gapx,\x2,3*\gapx,\x3);
            paint_x_lines(\radius,\gapy,3*\gapx,\x3,1,1.8);
            paint_x_lines(\radius,\gapy,0*\gapx-1,\x0,1,1);
            paint_nodes(\radius,\gapy,1*\gapx,\x1);
            paint_nodes(\radius,\gapy,2*\gapx,\x2);
            paint_nodes(\radius,\gapy,3*\gapx,\x3);
        };
        paint_net(7,9,10,5);
    }
    \node[scale = 0.9] at (0,-4.2) {Feature};
    \node[scale = 0.9] at (2,-4.2) {Input layer};
    \node[scale = 0.9] at (4,-4.2) {Hide layer};
    \node[scale = 0.9] at (6,-4.2) {Output layer};

\end{tikzpicture}
\end{document}
效果图:


 浙公网安备 33010602011771号