

代码练习
代码练习
PyTorch
介绍:PyTorch的前身是Torch,其底层和Torch框架一样,但是使用Python重新写了很多内容,不仅更加灵活,支持动态图,而且提供了Python接口。它是由Torch7团队开发,是一个以Python优先的深度学习框架,不仅能够实现强大的GPU加速,同时还支持动态神经网络。
PyTorch既可以看作加入了GPU支持的numpy,同时也可以看成一个拥有自动求导功能的强大的深度神经网络。除了Facebook外,它已经被Twitter、CMU和Salesforce等机构采用 。
优点:入门简单
PyTorch是相当简洁且高效快速的框架
设计符合人类思维,它让用户尽可能地专注于实现自己的想法
设计追求最少的封装
练习:
# 创建一个空张量
x = torch.empty(1,2)
print(x)
# 创建一个随机初始化的张量
x = torch.rand(1,2)
print(x)
x = torch.zeros(1,2,dtype=torch.long)
print(x)
y = x.new_ones(1,2)
print(y)
z = torch.randn_like(x, dtype=torch.float)
print(z)
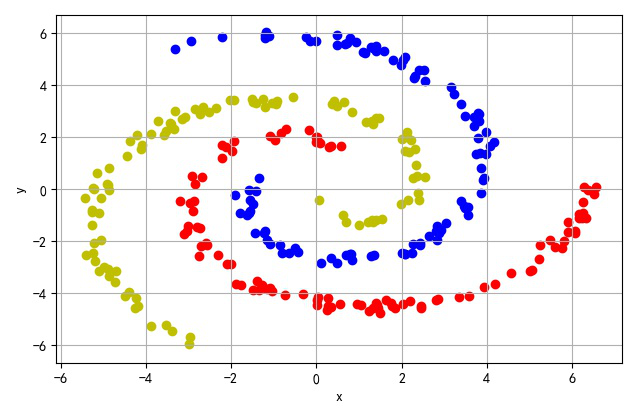
螺旋数据分类
代码:
from headm import *
import argparse
import math
import numpy as np
def rotate_point(point, angle):
"""Rotate two point by an angle.
Parameters
----------
point: 2d numpy array
The coordinate to rotate.
angle: float
The angle of rotation of the point, in degrees.
Returns
-------
2d numpy array
Rotated point.
"""
rotation_matrix = np.array([[np.cos(angle), -np.sin(angle)], [np.sin(angle), np.cos(angle)]])
rotated_point = rotation_matrix.dot(point)
return rotated_point
def generate_spiral(samples, start, end, angle, noise):
"""Generate a spiral of points.
Given a starting end, an end angle and a noise factor, generate a spiral of points along
an arc.
Parameters
----------
samples: int
Number of points to generate.
start: float
The starting angle of the spiral in degrees.
end: float
The end angle at which to rotate the points, in degrees.
angle: float
Angle of rotation in degrees.
noise: float
The noisyness of the points inside the spirals. Needs to be less than 1.
"""
# Generate points from the square root of random data inside an uniform distribution on [0, 1).
points = math.radians(start) + np.sqrt(np.random.rand(samples, 1)) * math.radians(end)
Apply a rotation to the points.
rotated_x_axis = np.cos(points) * points + np.random.rand(samples, 1) * noise
rotated_y_axis = np.sin(points) * points + np.random.rand(samples, 1) * noise
Stack the vectors inside a samples x 2 matrix.
rotated_points = np.column_stack((rotated_x_axis, rotated_y_axis))
return np.apply_along_axis(rotate_point, 1, rotated_points, math.radians(angle))
def main():
parser = argparse.ArgumentParser(description='Generate n-arm spiral')
parser.add_argument('count', type=int, help='Number of samples to generate per arm', default=2)
parser.add_argument('--arms', type=int, help='Number of args to generate', default=2)
parser.add_argument('--angle', type=float, help='Angle between each arm.', default=180)
parser.add_argument('--auto-angle', type=bool, default=True,
help='Automatically choose the angle for the arms')
parser.add_argument('--start', type=float, help='Start angle of the arms', default=0)
parser.add_argument('--end', type=float, default=360,
help='End angle of the arms. A value of 360 corresponds \
to a full circle.')
parser.add_argument('--noise', type=float, help='Noise for the arms', default=0.5)
parser.add_argument('--filename', type=str, help='Name of the file to save the dataset',
default='n_arm_spiral')
args = parser.parse_args()
Create a list of the angles at which to rotate the arms.
Either we find the angles automatically by dividing by the number of arms
Or we just use the angle given by the user.
classes = np.empty((0, 3))
angles = [((360 / args.arms) if args.auto_angle else args.angle) * i for i in range(args.arms)]
for i, angle in enumerate(angles):
points = generate_spiral(args.count, args.start, args.end, angle, args.noise)
classified_points = np.hstack((points, np.full((args.count, 1), i)))
classes = np.concatenate((classes, classified_points))
if i == 0: cstr = 'r'
elif i == 1: cstr = 'b'
else: cstr = 'y'
plt.scatter(points[:,0], points[:, 1], color=cstr)
printf(classes.shape)
tspsave('spiral', data=classes)
plt.xlabel("x")
plt.ylabel("y")
plt.grid(True)
plt.tight_layout()
plt.show()
图像:


 浙公网安备 33010602011771号