numpy之random学习
在机器学习中参数初始化需要进行随机生成,同时样本也需要随机生成,或者遵从一定规则随机生成,所以对随机生成的使用显得格外重要。
有的是生成随机数,有的是随机序列,有点是从随机序列中选择元素等等。
简单的随机数据
|
rand(d0, d1, ..., dn) |
随机值 >>> np.random.rand(3,2)
array([[ 0.14022471, 0.96360618], #random
[ 0.37601032, 0.25528411], #random
[ 0.49313049, 0.94909878]]) #random |
|
randn(d0, d1, ..., dn) |
返回一个样本,具有标准正态分布。 Notes For
random samples from sigma * np.random.randn(...) + mu Examples >>> np.random.randn() 2.1923875335537315 #random Two-by-four array of samples from N(3, 6.25): >>> 2.5 * np.random.randn(2, 4) + 3
array([[-4.49401501, 4.00950034, -1.81814867, 7.29718677], #random
[ 0.39924804, 4.68456316, 4.99394529, 4.84057254]]) #random |
|
randint(low[, high, size]) |
返回随机的整数,位于半开区间 [low, high)。 >>> np.random.randint(2, size=10) array([1, 0, 0, 0, 1, 1, 0, 0, 1, 0]) >>> np.random.randint(1, size=10) array([0, 0, 0, 0, 0, 0, 0, 0, 0, 0]) Generate a 2 x 4 array of ints between 0 and 4, inclusive: >>> np.random.randint(5, size=(2, 4))
array([[4, 0, 2, 1],
[3, 2, 2, 0]]) |
|
random_integers(low[, high, size]) |
返回随机的整数,位于闭区间 [low, high]。 Notes To sample from N evenly spaced floating-point numbers between a and b, use: a + (b - a) * (np.random.random_integers(N) - 1) / (N - 1.) Examples >>> np.random.random_integers(5)
4
>>> type(np.random.random_integers(5))
<type ‘int‘>
>>> np.random.random_integers(5, size=(3.,2.))
array([[5, 4],
[3, 3],
[4, 5]])
Choose
five random numbers from the set of five evenly-spaced numbers between 0 and
2.5, inclusive (i.e., from the
set >>> 2.5 * (np.random.random_integers(5, size=(5,)) - 1) / 4. array([ 0.625, 1.25 , 0.625, 0.625, 2.5 ]) Roll two six sided dice 1000 times and sum the results: >>> d1 = np.random.random_integers(1, 6, 1000) >>> d2 = np.random.random_integers(1, 6, 1000) >>> dsums = d1 + d2 Display results as a histogram: >>> import matplotlib.pyplot as plt >>> count, bins, ignored = plt.hist(dsums, 11, normed=True) >>> plt.show()
|
|
random_sample([size]) |
返回随机的浮点数,在半开区间 [0.0, 1.0)。 To
sample (b - a) * random_sample() + a Examples >>> np.random.random_sample() 0.47108547995356098 >>> type(np.random.random_sample()) <type ‘float‘> >>> np.random.random_sample((5,)) array([ 0.30220482, 0.86820401, 0.1654503 , 0.11659149, 0.54323428]) Three-by-two array of random numbers from [-5, 0): >>> 5 * np.random.random_sample((3, 2)) - 5
array([[-3.99149989, -0.52338984],
[-2.99091858, -0.79479508],
[-1.23204345, -1.75224494]])
|
|
random([size]) |
返回随机的浮点数,在半开区间 [0.0, 1.0)。 (官网例子与random_sample完全一样) |
|
ranf([size]) |
返回随机的浮点数,在半开区间 [0.0, 1.0)。 (官网例子与random_sample完全一样) |
|
sample([size]) |
返回随机的浮点数,在半开区间 [0.0, 1.0)。 (官网例子与random_sample完全一样) |
|
choice(a[, size, replace, p]) |
生成一个随机样本,从一个给定的一维数组 Examples Generate a uniform random sample from np.arange(5) of size 3: >>> np.random.choice(5, 3) array([0, 3, 4]) >>> #This is equivalent to np.random.randint(0,5,3) Generate a non-uniform random sample from np.arange(5) of size 3: >>> np.random.choice(5, 3, p=[0.1, 0, 0.3, 0.6, 0]) array([3, 3, 0]) Generate a uniform random sample from np.arange(5) of size 3 without replacement: >>> np.random.choice(5, 3, replace=False) array([3,1,0]) >>> #This is equivalent to np.random.permutation(np.arange(5))[:3] Generate a non-uniform random sample from np.arange(5) of size 3 without replacement: >>> np.random.choice(5, 3, replace=False, p=[0.1, 0, 0.3, 0.6, 0]) array([2, 3, 0]) Any of the above can be repeated with an arbitrary array-like instead of just integers. For instance: >>> aa_milne_arr = [‘pooh‘, ‘rabbit‘, ‘piglet‘, ‘Christopher‘]
>>> np.random.choice(aa_milne_arr, 5, p=[0.5, 0.1, 0.1, 0.3])
array([‘pooh‘, ‘pooh‘, ‘pooh‘, ‘Christopher‘, ‘piglet‘],
dtype=‘|S11‘)
|
|
bytes(length) |
返回随机字节。 >>> np.random.bytes(10) ‘ eh\x85\x022SZ\xbf\xa4‘ #random
|
产生随机数的方式很多种,应用比较广的是
1、rand()、random产生随机的浮点数,但基本在0-1区间内,添加一个参数标注随机序列的size,这个函数的用法和random的一致,两者区别就是一个可以生成二维序列,一个不行。
numpy.random.rand(d0,d1,…,dn)
- rand函数根据给定维度生成[0,1)之间的数据,包含0,不包含1
- dn表格每个维度
- 返回值为指定维度的array
np.random.rand(4,2)
array([[ 0.02173903,  0.44376568],
       [ 0.25309942,  0.85259262],
       [ 0.56465709,  0.95135013],
       [ 0.14145746,  0.55389458]])
np.random.rand(4,3,2) # shape: 4*3*2
array([[[ 0.08256277,  0.11408276],
        [ 0.11182496,  0.51452019],
        [ 0.09731856,  0.18279204]],

       [[ 0.74637005,  0.76065562],
        [ 0.32060311,  0.69410458],
        [ 0.28890543,  0.68532579]],

       [[ 0.72110169,  0.52517524],
        [ 0.32876607,  0.66632414],
        [ 0.45762399,  0.49176764]],

       [[ 0.73886671,  0.81877121],
        [ 0.03984658,  0.99454548],
        [ 0.18205926,  0.99637823]]])
2、randint(),产生随机整数,特点是可以指定最大值和最小值,返回的是整数。当然也可以指定size,size中每个数都在low和high内。
numpy.random.randint(low, high=None, size=None, dtype=’l’)
- 返回随机整数,范围区间为[low,high),包含low,不包含high
- 参数:low为最小值,high为最大值,size为数组维度大小,dtype为数据类型,默认的数据类型是np.int
- high没有填写时,默认生成随机数的范围是[0,low)
np.random.randint(1,size=5) # 返回[0,1)之间的整数,所以只有0
array([0, 0, 0, 0, 0])
np.random.randint(1,5) # 返回1个[1,5)时间的随机整数
4
np.random.randint(-5,5,size=(2,2))
array([[ 2, -1],
       [ 2,  0]])
3、randn(),其中n表示标准正态分布,这个在生成样本的时候经常使用,需要指定这个序列的尺寸
numpy.random.randn(d0,d1,…,dn)
- randn函数返回一个或一组样本,具有标准正态分布。
- dn表格每个维度
- 返回值为指定维度的array
np.random.randn() # 当没有参数时,返回单个数据
-1.1241580894939212
np.random.randn(2,4)
array([[ 0.27795239, -2.57882503,  0.3817649 ,  1.42367345],
       [-1.16724625, -0.22408299,  0.63006614, -0.41714538]])
np.random.randn(4,3,2)
array([[[ 1.27820764,  0.92479163],
        [-0.15151257,  1.3428253 ],
        [-1.30948998,  0.15493686]],

       [[-1.49645411, -0.27724089],
        [ 0.71590275,  0.81377671],
        [-0.71833341,  1.61637676]],

       [[ 0.52486563, -1.7345101 ],
        [ 1.24456943, -0.10902915],
        [ 1.27292735, -0.00926068]],

       [[ 0.88303   ,  0.46116413],
        [ 0.13305507,  2.44968809],
        [-0.73132153, -0.88586716]]])
标准正态分布介绍
- 标准正态分布—-standard normal distribution
- 标准正态分布又称为u分布,是以0为均值、以1为标准差的正态分布,记为N(0,1)。
4、choice(),这个函数经常使用,经常在从序列中随机选择元素,而且还是指定选择出元素序列,很是方便。关键是可以为每个元素制定选择的概率。即p
numpy.random.choice(a, size=None, replace=True, p=None)
- 从给定的一维数组中生成随机数
- 参数: a为一维数组类似数据或整数;size为数组维度;p为数组中的数据出现的概率
- a为整数时,对应的一维数组为np.arange(a)
np.random.choice(5,3)
array([4, 1, 4])
np.random.choice(5, 3, replace=False)
# 当replace为False时,生成的随机数不能有重复的数值
array([0, 3, 1])
np.random.choice(5,size=(3,2))
array([[1, 0],
       [4, 2],
       [3, 3]])
demo_list = ['lenovo', 'sansumg','moto','xiaomi', 'iphone']
np.random.choice(demo_list,size=(3,3))
array([['moto', 'iphone', 'xiaomi'],
       ['lenovo', 'xiaomi', 'xiaomi'],
       ['xiaomi', 'lenovo', 'iphone']],
      dtype='<U7')
- 参数p的长度与参数a的长度需要一致;
- 参数p为概率,p里的数据之和应为1
demo_list = ['lenovo', 'sansumg','moto','xiaomi', 'iphone']
np.random.choice(demo_list,size=(3,3), p=[0.1,0.6,0.1,0.1,0.1])
array([['sansumg', 'sansumg', 'sansumg'],
       ['sansumg', 'sansumg', 'sansumg'],
       ['sansumg', 'xiaomi', 'iphone']],
      dtype='<U7')
5、sample
lists=[1,2,3,4,5,6,7,8,10] #从指定序列中随机获取指定长度的片断
a=random.sample(lists,3)
print (a)
[8, 6, 10]
排列
|
shuffle(x) |
现场修改序列,改变自身内容。(类似洗牌,打乱顺序) >>> arr = np.arange(10) >>> np.random.shuffle(arr) >>> arr [1 7 5 2 9 4 3 6 0 8]
This function only shuffles the array along the first index of a multi-dimensional array: >>> arr = np.arange(9).reshape((3, 3))
>>> np.random.shuffle(arr)
>>> arr
array([[3, 4, 5],
[6, 7, 8],
[0, 1, 2]])
|
|
permutation(x) |
返回一个随机排列 >>> np.random.permutation(10) array([1, 7, 4, 3, 0, 9, 2, 5, 8, 6]) >>> np.random.permutation([1, 4, 9, 12, 15]) array([15, 1, 9, 4, 12]) >>> arr = np.arange(9).reshape((3, 3))
>>> np.random.permutation(arr)
array([[6, 7, 8],
[0, 1, 2],
[3, 4, 5]])
|
上面两者都收用于打乱数组的排序,功能是一样的。
numpy.random.permutation(x):与numpy.random.shuffle(x)函数功能相同,两者区别:peumutation(x)不会修改X的顺序。
因为前者返回了一个副本。
分布
|
beta(a, b[, size]) |
贝塔分布样本,在 [0, 1]内。 |
|
binomial(n, p[, size]) |
二项分布的样本。 |
|
chisquare(df[, size]) |
卡方分布样本。 |
|
dirichlet(alpha[, size]) |
狄利克雷分布样本。 |
|
exponential([scale, size]) |
指数分布 |
|
f(dfnum, dfden[, size]) |
F分布样本。 |
|
gamma(shape[, scale, size]) |
伽马分布 |
|
geometric(p[, size]) |
几何分布 |
|
gumbel([loc, scale, size]) |
耿贝尔分布。 |
|
hypergeometric(ngood, nbad, nsample[, size]) |
超几何分布样本。 |
|
laplace([loc, scale, size]) |
拉普拉斯或双指数分布样本 |
|
logistic([loc, scale, size]) |
Logistic分布样本 |
|
lognormal([mean, sigma, size]) |
对数正态分布 |
|
logseries(p[, size]) |
对数级数分布。 |
|
multinomial(n, pvals[, size]) |
多项分布 |
|
multivariate_normal(mean, cov[, size]) |
多元正态分布。 >>> mean = [0,0] >>> cov = [[1,0],[0,100]] # diagonal covariance, points lie on x or y-axis >>> import matplotlib.pyplot as plt >>> x, y = np.random.multivariate_normal(mean, cov, 5000).T >>> plt.plot(x, y, ‘x‘); plt.axis(‘equal‘); plt.show()
|
|
negative_binomial(n, p[, size]) |
负二项分布 |
|
noncentral_chisquare(df, nonc[, size]) |
非中心卡方分布 |
|
noncentral_f(dfnum, dfden, nonc[, size]) |
非中心F分布 |
|
normal([loc, scale, size]) |
正态(高斯)分布 Notes The probability density for the Gaussian distribution is
where The
function has its peak at the mean, and its “spread” increases with the standard
deviation (the function reaches 0.607 times its maximum at
Examples Draw samples from the distribution: >>> mu, sigma = 0, 0.1 # mean and standard deviation >>> s = np.random.normal(mu, sigma, 1000) Verify the mean and the variance: >>> abs(mu - np.mean(s)) < 0.01 True >>> abs(sigma - np.std(s, ddof=1)) < 0.01 True Display the histogram of the samples, along with the probability density function: >>> import matplotlib.pyplot as plt >>> count, bins, ignored = plt.hist(s, 30, normed=True) >>> plt.plot(bins, 1/(sigma * np.sqrt(2 * np.pi)) * ... np.exp( - (bins - mu)**2 / (2 * sigma**2) ), ... linewidth=2, color=‘r‘) >>> plt.show()
|
|
pareto(a[, size]) |
帕累托(Lomax)分布 |
|
poisson([lam, size]) |
泊松分布 |
|
power(a[, size]) |
Draws samples in [0, 1] from a power distribution with positive exponent a - 1. |
|
rayleigh([scale, size]) |
Rayleigh 分布 |
|
standard_cauchy([size]) |
标准柯西分布 |
|
standard_exponential([size]) |
标准的指数分布 |
|
standard_gamma(shape[, size]) |
标准伽马分布 |
|
standard_normal([size]) |
标准正态分布 (mean=0, stdev=1). |
|
standard_t(df[, size]) |
Standard Student’s t distribution with df degrees of freedom. |
|
triangular(left, mode, right[, size]) |
三角形分布 |
|
uniform([low, high, size]) |
均匀分布 |
|
vonmises(mu, kappa[, size]) |
von Mises分布 |
|
wald(mean, scale[, size]) |
瓦尔德(逆高斯)分布 |
|
weibull(a[, size]) |
Weibull 分布 |
|
zipf(a[, size]) |
齐普夫分布 |
random的的分布,其实就是随机生成器的完善版,比如:
numpy.random.uniform介绍:
1. 函数原型: numpy.random.uniform(low,high,size)
功能:从一个均匀分布[low,high)中随机采样,注意定义域是左闭右开,即包含low,不包含high.
参数介绍:
low: 采样下界,float类型,默认值为0;
high: 采样上界,float类型,默认值为1;
size: 输出样本数目,为int或元组(tuple)类型,例如,size=(m,n,k), 则输出m*n*k个样本,缺省时输出1个值。
2. 类似uniform,还有以下随机数产生函数:
a. randint: 原型:numpy.random.randint(low, high=None, size=None, dtype='l'),产生随机整数;
b. random_integers: 原型: numpy.random.random_integers(low, high=None, size=None),在闭区间上产生随机整数;
c. random_sample: 原型: numpy.random.random_sample(size=None),在[0.0,1.0)上随机采样;
d. random: 原型: numpy.random.random(size=None),和random_sample一样,是random_sample的别名;
e. rand: 原型: numpy.random.rand(d0, d1, ..., dn),产生d0 - d1 - ... - dn形状的在[0,1)上均匀分布的float型数。
f. randn: 原型:numpy.random.randn(d0,d1,...,dn),产生d0 - d1 - ... - dn形状的标准正态分布的float型数
# -*- coding: utf-8 -*-
import matplotlib.pyplot as plt
import numpy as np

s = np.random.uniform(0,1,1200)      # 产生1200个[0,1)的数
count, bins, ignored = plt.hist(s, 12, normed=True)
 """
 hist原型:
         matplotlib.pyplot.hist(x, bins=10, range=None, normed=False, weights=None,
         cumulative=False, bottom=None, histtype='bar', align='mid',
         orientation='vertical',rwidth=None, log=False, color=None, label=None,
         stacked=False, hold=None,data=None,**kwargs)

 输入参数很多,具体查看matplotlib.org,本例中用到3个参数,分别表示:s数据源,bins=12表示bin
 的个数,即画多少条条状图,normed表示是否归一化,每条条状图y坐标为n/(len(x)`dbin),整个条状图积分值为1

 输出:count表示数组,长度为bins,里面保存的是每个条状图的纵坐标值
      bins:数组,长度为bins+1,里面保存的是所有条状图的横坐标,即边缘位置
      ignored: patches,即附加参数,列表或列表的列表,本例中没有用到。
"""
plt.plot(bins, np.ones_like(bins), linewidth=2, color='r')
plt.show()
在分布中标准正态分布和正态分布很重要,因为分布状态类似高斯分布,这个在数据样本产生中经常使用。
normal和standnormal,但是这些可以通过randn生成。
随机数生成器
| Container for the Mersenne Twister pseudo-random number generator. | |
|
seed([seed]) |
Seed the generator. |
| Return a tuple representing the internal state of the generator. | |
|
set_state(state) |
Set the internal state of the generator from a tuple. |
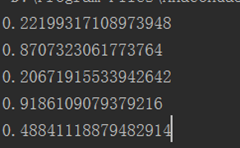
import numpy as np
np.random.seed(5)
for i in range(5):
    print(np.random.random())
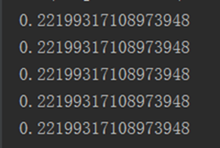
import numpy as np

for i in range(5):
    np.random.seed(5)
    print(np.random.random())

 , use:
 ):
): multiply the output of
 is the mean and
  the standard deviation. The square of the
standard deviation,
  , is called the variance.
 and
and 


 浙公网安备 33010602011771号