CMU mocap数据集
信息
Wentao Zhu等人的2016 AAAI论文:
- We have categorized the CMU motion capture dataset into 45 classes for the purpose of skeleton based action recognition.
- The categorized dataset contains 2,235 sequences (987,341 frames after down-sampling).
- CMU subset: we have chosen 8 representative action categories containing 664 sequences (125,667 frames after down-sampling), with actions of jump, walk back, run, sit, getup, pickup, basketball, cartwheel.
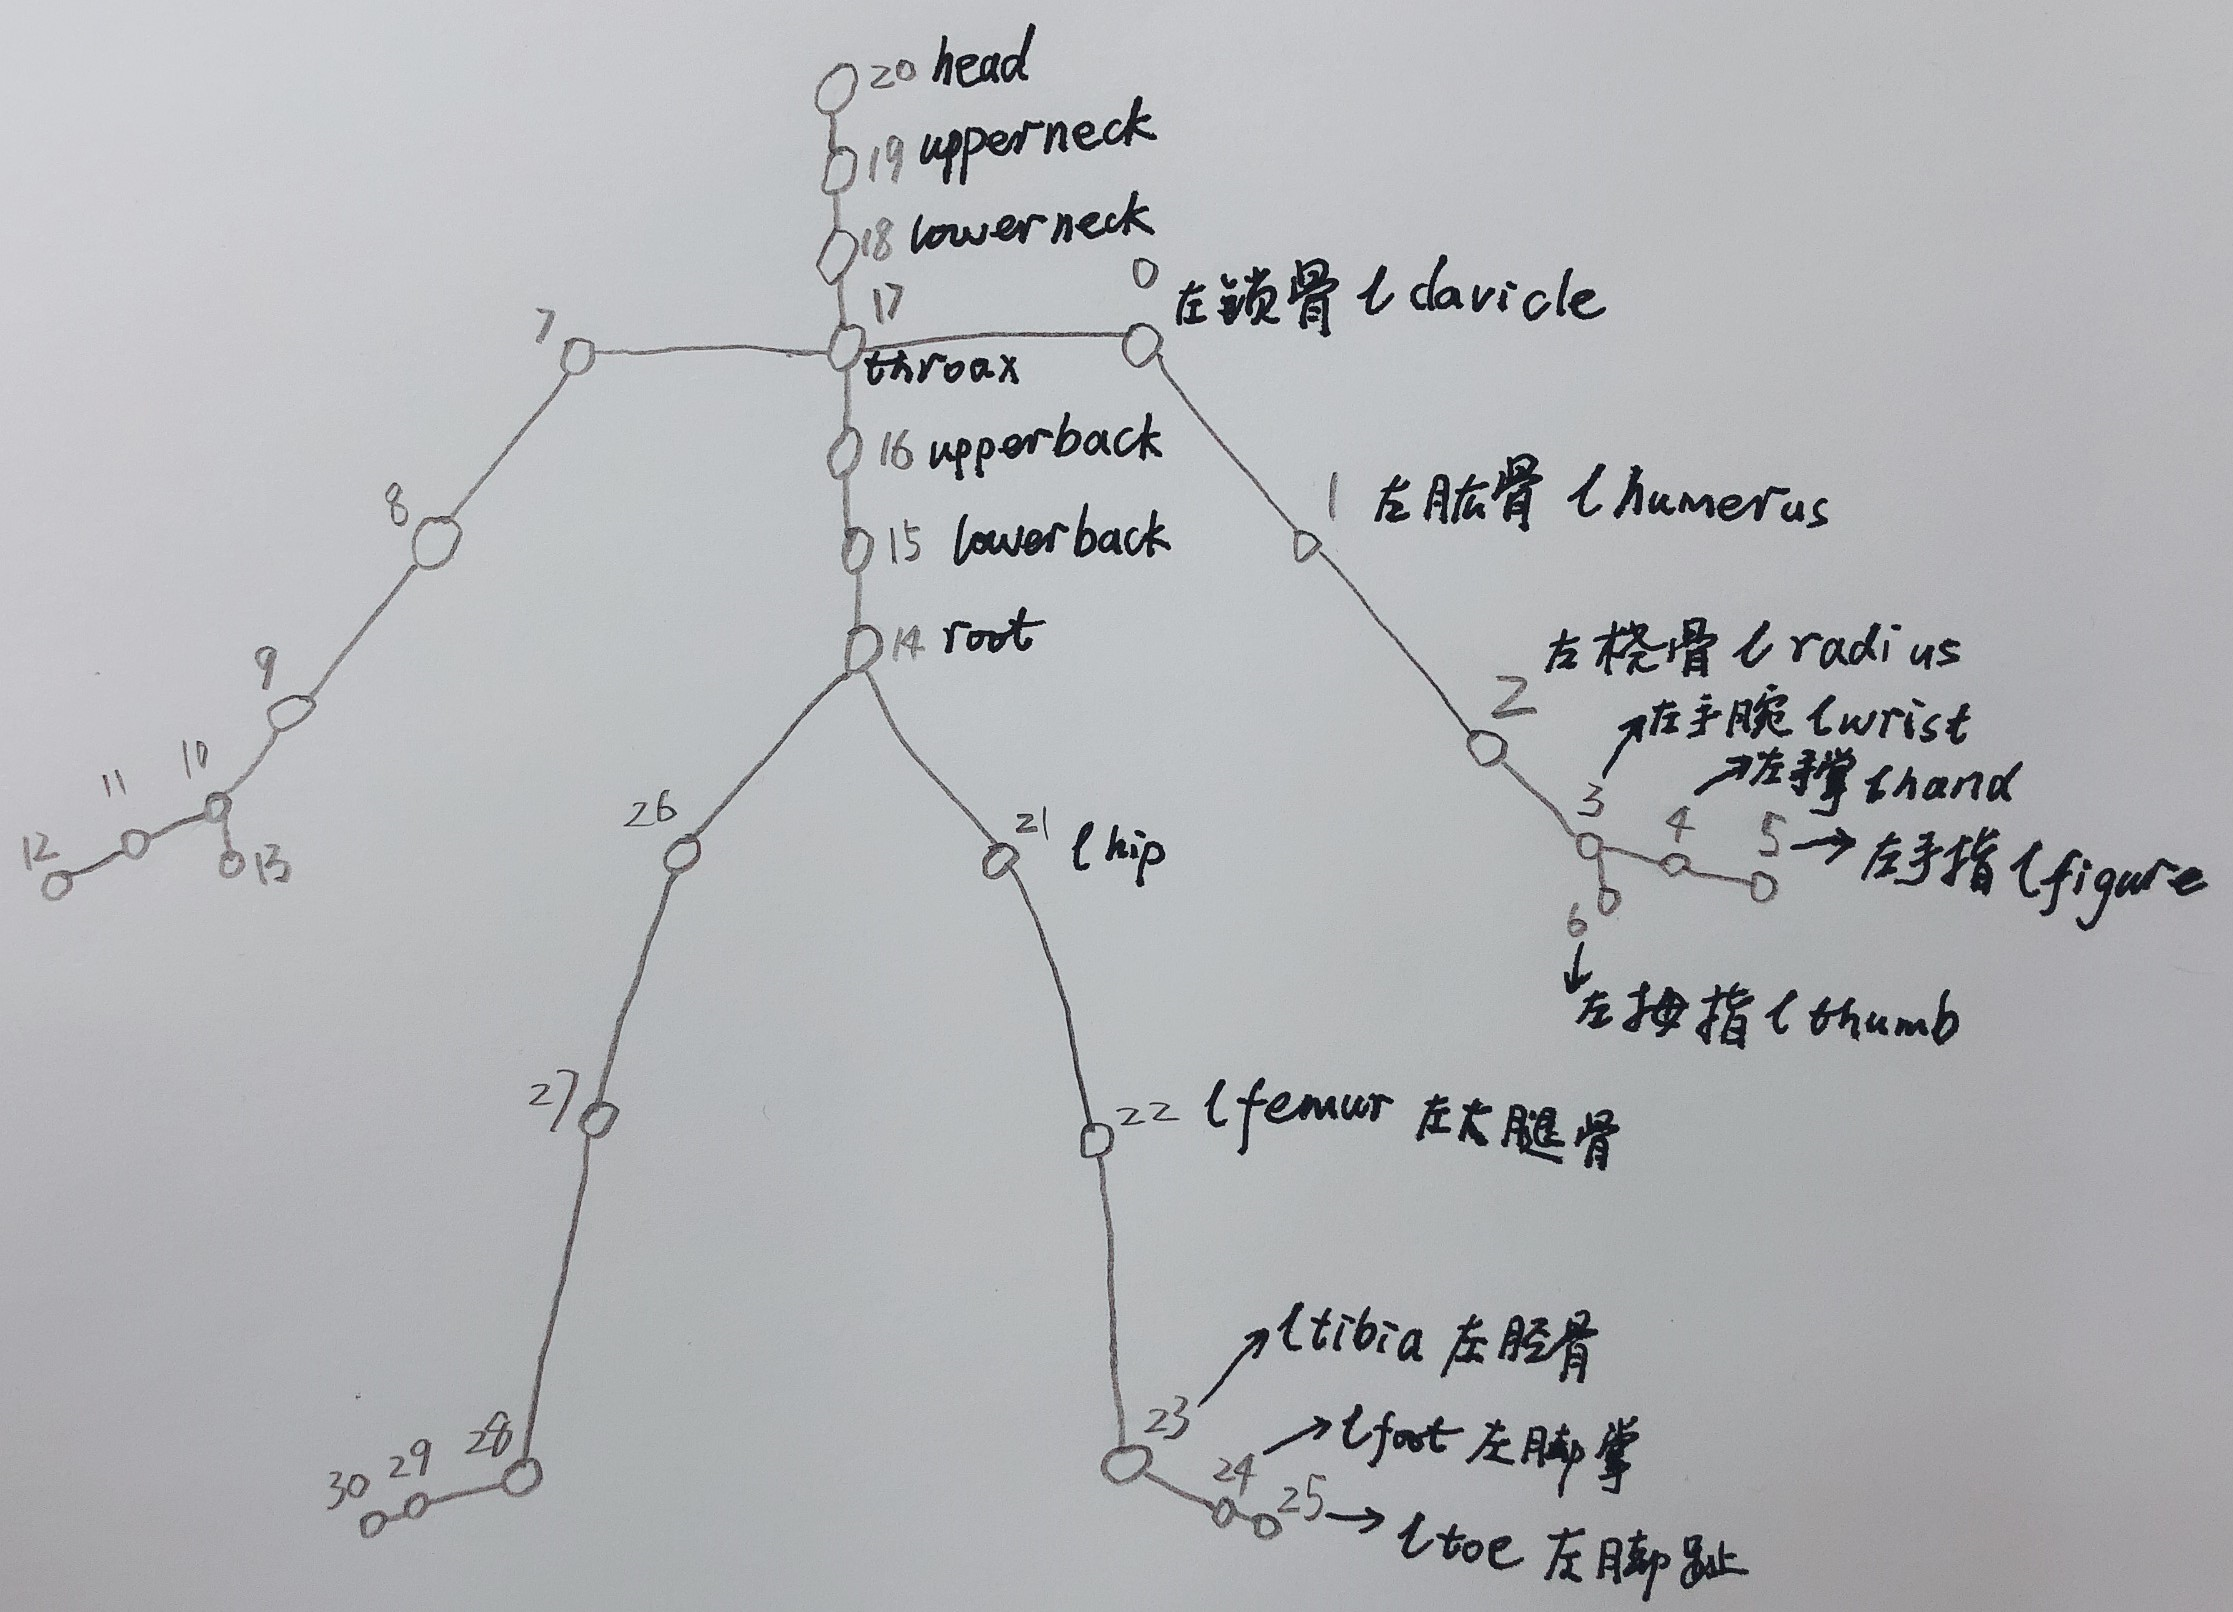
骨架连接图:
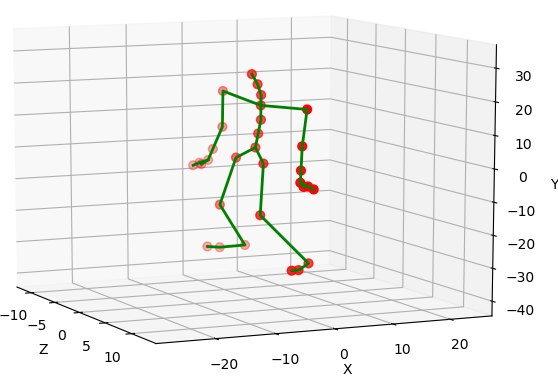
可视化程序
下面的程序把txt文件中的骨架坐标数据用三维动图的方式可视化。
import numpy as np
import matplotlib.pyplot as plt
from mpl_toolkits.mplot3d import Axes3D

data = np.loadtxt(r"E:\CS\action_research\cmu_mocap\wenjun\cmudatasetpart4\82_09.txt", dtype=np.float32, delimiter=',')
T, J = data.shape
data = data.reshape([T, int(J/3), 3])
print(data.shape)

xmax = np.max(data[:, :, 0]) + 0.5
xmin = np.min(data[:, :, 0]) - 0.5
ymax = np.max(data[:, :, 1]) + 10
ymin = np.min(data[:, :, 1]) - 10
zmax = np.max(data[:, :, 2])
zmin = np.min(data[:, :, 2])

# 相邻各节点列表,用来画节点之间的连接线
arms = [12, 11, 10, 9, 8, 7, 17, 0, 1, 2, 3, 4, 5]
rightHand = [10, 13]
leftHand = [3, 6]
legs = [30, 29, 28, 27, 26, 14, 21, 22, 23, 24, 25]
trunk = [14, 15, 16, 17, 18, 19, 20]

# 3D展示------------------------------------------------------------------------
n = 0   # 从第n帧开始展示
m = T   # 到第m帧结束,n<m<T
fig = plt.figure()   # 先生成一块画布,然后在画布上添加3D坐标轴
plt.ion()
for i in range(n, m):
    fig.clf()
    ax = Axes3D(fig, azim=-25, elev=10)
    ax.scatter(data[i, :, 2], data[i, :, 0], data[i, :, 1], c='red', s=40.0)
    ax.plot(data[i, arms, 2], data[i, arms, 0], data[i, arms, 1], c='green', lw=2.0)
    ax.plot(data[i, rightHand, 2], data[i, rightHand, 0], data[i, rightHand, 1], c='green', lw=2.0)
    ax.plot(data[i, leftHand, 2], data[i, leftHand, 0], data[i, leftHand, 1], c='green', lw=2.0)
    ax.plot(data[i, legs, 2], data[i, legs, 0], data[i, legs, 1], c='green', lw=2.0)
    ax.plot(data[i, trunk, 2], data[i, trunk, 0], data[i, trunk, 1], c='green', lw=2.0)
    ax.text(xmax-0.8, ymax-0.2, zmax-0.2, 'frame {}/{}'.format(i, T))
#    ax.text(xmax-0.8, ymax-0.4, zmax-0.4, 'label: ' + str(label[i]))
    ax.set_xlabel("Z")
    ax.set_ylabel("X")
    ax.set_zlabel("Y")
    ax.set_xlim(zmin, zmax)
    ax.set_ylim(xmin, xmax)
    ax.set_zlim(ymin, ymax)
    plt.pause(0.1)

plt.ioff()
plt.show()


# 2D展示------------------------------------------------------------------------
#n = 0  # 从第n帧开始展示
#m = T  # 到第m帧结束,n<m<T
#plt.figure()
#plt.ion()
#for i in range(n, m):
#    plt.cla()
#    plt.scatter(data[i, :, 0], data[i, :, 1], c='red', s=40.0)
#    plt.plot(data[i, arms, 0], data[i, arms, 1], c='green', lw=2.0)
#    plt.plot(data[i, rightHand, 0], data[i, rightHand, 1], c='green', lw=2.0)
#    plt.plot(data[i, leftHand, 0], data[i, leftHand, 1], c='green', lw=2.0)
#    plt.plot(data[i, legs, 0], data[i, legs, 1], c='green', lw=2.0)
#    plt.plot(data[i, trunk, 0], data[i, trunk, 1], c='green', lw=2.0)
#
#    plt.text(xmax - 9.5, ymax - 2.5, 'frame: {}/{}'.format(i, T - 1))
#    # plt.text(xmax-0.8, ymax-0.4, 'label: ' + str(label[i]))
#    plt.xlim(xmin, xmax)
#    plt.ylim(ymin, ymax)
#    plt.pause(0.1)
#
#plt.ioff()
#plt.show()
运行结果:

 浙公网安备 33010602011771号