ArcGIS API for JavaScript 4.2学习笔记[15] 弹窗内容的格式与自定义格式
先看结果截图吧(不看过程可以直接看总结,在文末):
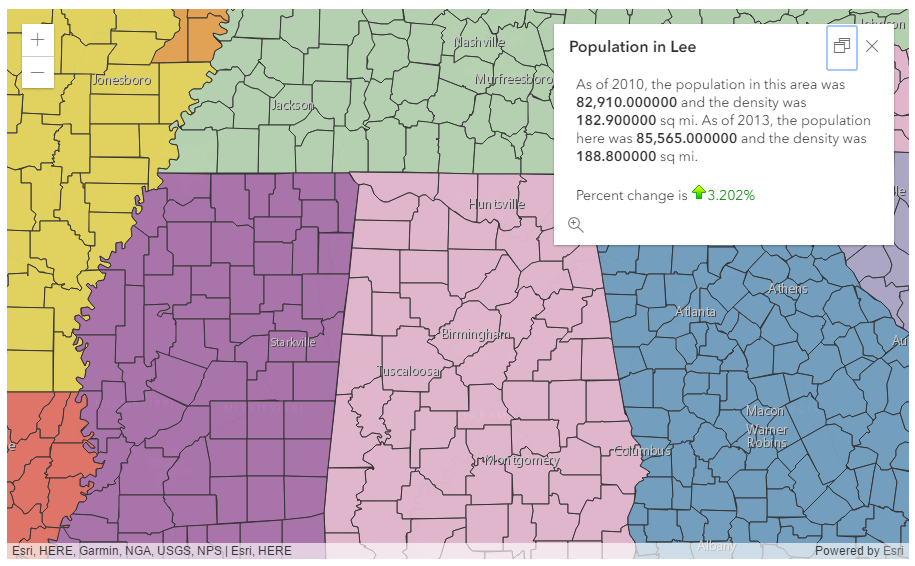
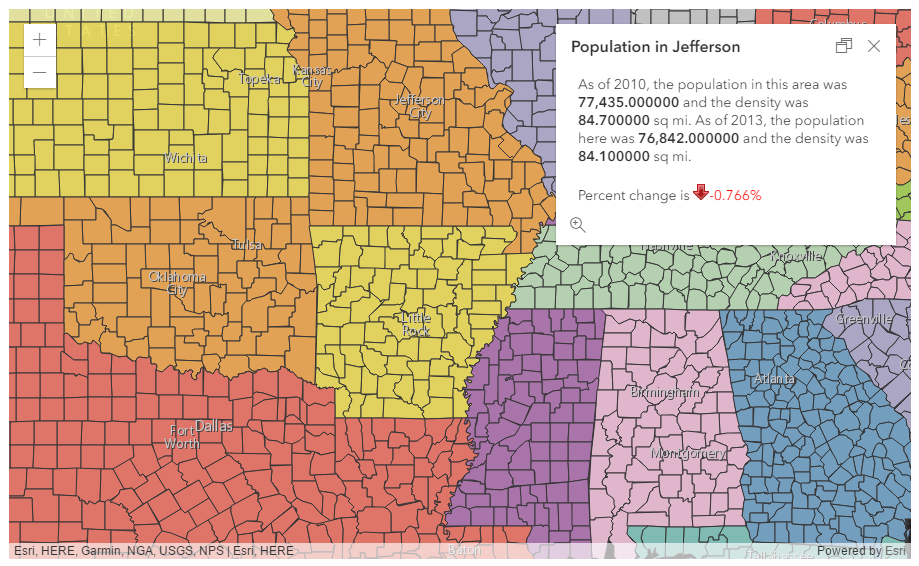
随便点击了两个城市斑块,出现结果如图。
我来解读一下这结果和以前的有什么不同:
这个例子使用了PopupTemplate,数据是Layer(使用PortalID创建的Layer)。
但是我们看到图中有个地方不同:当Percent change is这个东西是负数的时候,就是红色+红色下箭头,反之则是绿色字+绿色上箭头。
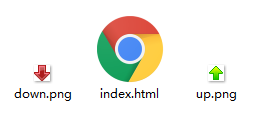
实际上,这两个箭头是两个png图片。
见html同目录下的两个文件:
所以说,这种特定格式,能随着数字正负自动判断使用什么图片、什么样式的content是怎么实现的呢?
解读开始。
一、给出引用(用到的模块)
require(
    [
        "esri/Map", "esri/views/MapView", "esri/layers/Layer",
        "dojo/dom", "dojo/number", "dojo/on", "dojo/domReady!"
    ],
    function(){...}
);
二、函数参数(第二参数/回调函数)
function(Map, MapView, Layer, dom, number, on){
    var map = new Map({...});
    var view = MapView({...});
    Layer.fromPortalItem({...})
    .then(function(layer)
        {
            map.add(layer);
            var popupTemplate = {...};
            layer.popupTemplate = popupTemplate;
            populationChange = function(...){...};
        });
}
省略了部分代码。在Layer.fromPortalItem返回的Promise对象中,使用了then()方法回调一个函数,操作此Promise返回的layer对象。
首先使用map的add()方法添加layer到地图中去。
然后是定义一个popupTemplate,并赋给layer的popupTemplate属性。
到这里,都很正常,问题是,
到现在为止都没说那个自定义的content是怎么弄的?后面的populationChange方法又是干什么用的?
三、popupTemplate的content属性
直接看下文代码块中的content属性:
var popupTemplate = {
  title: "Population in {NAME}",
  content: "As of 2010, the population in this area was <b>{POP2010:NumberFormat}</b> " +
    "and the density was <b>{POP10_SQMI:NumberFormat}</b> sq mi. " +
    "As of 2013, the population here was <b>{POP2013:NumberFormat}</b> " +
    "and the density was <b>{POP13_SQMI:NumberFormat}</b> sq mi. <br/> <br/>" +
    "Percent change is {POP2013:populationChange}"
};
可以看到,有5个{}在content中,也就是说有5个值是动态变化的,在弹窗时会改变。
前4个使用的格式是NumbreFormat,当然这个是可以指定一个方法给它的,
就是第5个{}中的POP2013字段,它的格式就指定为了populationChange方法。我们来看看populationChange方法:
populationChange = function(value, key, data) {
  var diff = data.POP2013 - data.POP2010;
  var pctChange = (diff * 100) / data.POP2010;
  var result = diff > 0 ? "up.png" : "down.png";

  return "<img src='" + result + "'/>" +
    "<span style='color: " +
    (pctChange < 0 ? "red" : "green") + ";'>" +
    number.format(pctChange, {
      places: 3
    }) +
    "%</span>";
}
result中有一个三元判断符 “A?B:C”,意思是若A为真,则选择B作为结果,否则选择C。
看样子就知道diff就是变化数了,它>0就"up.png",否则就"down.png"。
返回一串html代码,看就知道是什么了,这与我们在开头看到的例子的结果一致。
这个方法的参数中data即各个字段的集合。
四、总结
popupTemplate的content中如何用自己的规则去控制样式?
这样即可对变化值进行格式自定义控制:
content: "...{字段:Function名}..."
在代码后补全同名方法即可。
就是这么简单!熟悉html组织文本样式的童鞋就能创造更多好看复杂的样式了。
给出源代码:


<!DOCTYPE html>
<html>
<head>
  <meta http-equiv="Content-Type" content="text/html; charset=utf-8">
  <meta name="viewport" content="initial-scale=1, maximum-scale=1,user-scalable=no">
  <title>PopupTemplate Function - 4.2</title>

  <link rel="stylesheet" href="https://js.arcgis.com/4.2/esri/css/main.css">
  <script src="https://js.arcgis.com/4.2/"></script>

  <style>
    html,
    body,
    #viewDiv {
      padding: 0;
      margin: 0;
      height: 100%;
      width: 100%;
    }
  </style>

  <script>
    var populationChange;
    require([
        "esri/Map",
        "esri/views/MapView",
        "esri/layers/Layer",
        "dojo/dom",
        "dojo/number",
        "dojo/on",
        "dojo/domReady!"
      ],
      function(
        Map, MapView, Layer,
        dom, number, on
      ) {
        var map = new Map({
          basemap: "dark-gray"
        });

        // Create the MapView
        var view = new MapView({
          container: "viewDiv",
          map: map,
          zoom: 7,
          center: [-87, 34]
        });

        Layer.fromPortalItem({
          portalItem: { // autocast as esri/portal/PortalItem
            id: "e8f85b4982a24210b9c8aa20ba4e1bf7"
          }
        }).then(function(layer) {
          // add the layer to the map
          map.add(layer);

          // create a new popupTemplate for the layer
          // format the numeric field values using out of the box
          // NumberFormat function. Call populationChange() custom
          // function to calculate percent change for the county.
          var popupTemplate = {
            title: "Population in {NAME}",
            content: "As of 2010, the population in this area was <b>{POP2010:NumberFormat}</b> " +
              "and the density was <b>{POP10_SQMI:NumberFormat}</b> sq mi. " +
              "As of 2013, the population here was <b>{POP2013:NumberFormat}</b> " +
              "and the density was <b>{POP13_SQMI:NumberFormat}</b> sq mi. <br/> <br/>" +
              "Percent change is {POP2013:populationChange}"
          };

          layer.popupTemplate = popupTemplate;

          populationChange = function(value, key, data) {
            // calculate the population percent change from 2010 to 2013.
            var diff = data.POP2013 - data.POP2010;
            var pctChange = (diff * 100) / data.POP2010;
            var result = diff > 0 ? "up.png" : "down.png";

            // add green arrow if the percent change is positive.
            // red arrow for negatice percent change.
            return "<img src='" + result + "'/>" +
              "<span style='color: " +
              (pctChange < 0 ? "red" : "green") + ";'>" +
              number.format(pctChange, {
                places: 3
              }) +
              "%</span>";
          }
        });
      });
  </script>
</head>
<body>
  <div id="viewDiv"></div>
</body>
</html>

 浙公网安备 33010602011771号