matplotlib 填充颜色
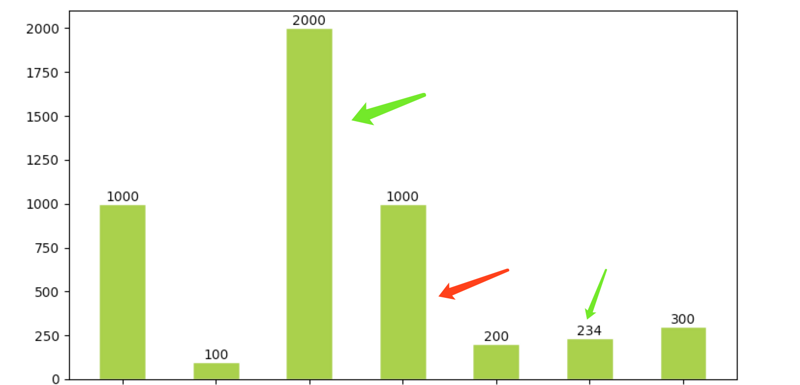
def huitu_host(nodes,total):
    x = np.arange(len(nodes))
    plt.figure(figsize=(9,5))
    plt.xticks(x,nodes)
    plt.bar(x,total,width = 0.5,facecolor = 'yellowgreen',edgecolor = 'white')
    for x,y in zip(x,total):
        plt.text(x,y,'%.f' % y,ha="center", va="bottom")
    plt.show()
return![]()
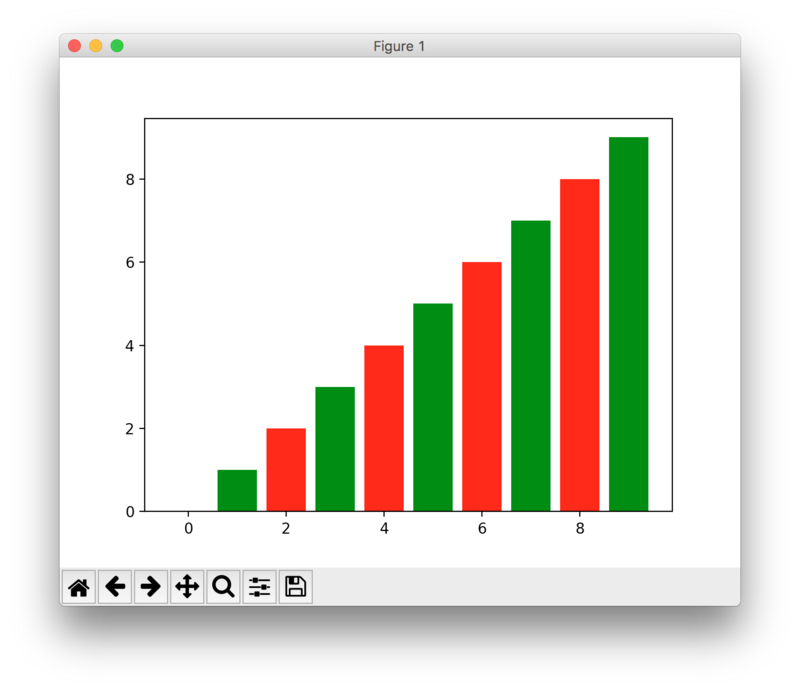
color和edgecolor这些都能传array-like的参数
在array里分别指定颜色就好了
例子:
x=np.arange(10)
y=np.arange(10)
plt.bar(x,y,color=['red','green'])
![]()

 浙公网安备 33010602011771号