SaltStack自动化部署Kubernetes
- SaltStack自动化部署Kubernetes v1.10.3版本(支持TLS双向认证、RBAC授权、Flannel网络、ETCD集群、Kuber-Proxy使用LVS等)。
版本明细:Release-v1.10.3
- 测试通过系统:CentOS 7.4
- salt-ssh: 2017.7.4
- Kubernetes: v1.10.3
- Etcd: v3.3.1
- Docker: 17.12.1-ce
- Flannel: v0.10.0
- CNI-Plugins: v0.7.0 建议部署节点:最少三个节点,请配置好主机名解析(必备)
架构介绍
- 使用Salt Grains进行角色定义,增加灵活性。
- 使用Salt Pillar进行配置项管理,保证安全性。
- 使用Salt SSH执行状态,不需要安装Agent,保证通用性。
- 使用Kubernetes当前稳定版本v1.10.3,保证稳定性。
0.系统初始化
- 设置主机名
- 设置/etc/hosts保证主机名能够解析
- 关闭SELinux和防火墙
- 配置网卡
- 配置dns
- 安装常用软件
操作过程记录:
-
配置/etc/hosts
[root@linux-node1 ~]# cat /etc/hosts
127.0.0.1   localhost localhost.localdomain localhost4 localhost4.localdomain4
::1         localhost localhost.localdomain localhost6 localhost6.localdomain6
192.168.56.11 linux-node1 linux-node1.example.com
192.168.56.12 linux-node2 linux-node2.example.com
192.168.56.13 linux-node3 linux-node3.example.com
-
配置主机名称
hostnamectl set-hostname linux-node1.example.com
hostname linux-node1.example.com

hostnamectl set-hostname linux-node2.example.com
hostname linux-node2.example.com

hostnamectl set-hostname linux-node3.example.com
hostname linux-node3.example.com
-
close firewalld and NetworkManager
systemctl disable firewalld
systemctl disable NetworkManager

and

sed -i 's/SELINUX=enforcing/SELINUX=disabled/g' /etc/selinux/config
setenforce 0
-
配置网卡IP
[root@linux-node1 ~]# vi /etc/sysconfig/network-scripts/ifcfg-eth0
TYPE=Ethernet
PROXY_METHOD=none
BROWSER_ONLY=no
BOOTPROTO=static
DEFROUTE=yes
PEERDNS=no
PEERROUTES=yes
IPV4_FAILURE_FATAL=no
NAME=eth0
#UUID=ecc5a023-d746-40b7-8bfc-d09ff94ba62b
DEVICE=eth0
ONBOOT=yes
IPADDR=192.168.56.11
NETMASK=255.255.255.0
GATEWAY=192.168.56.2
- 配置dns
[root@linux-node1 ~]# cat /etc/resolv.conf
# Generated by NetworkManager
nameserver 192.168.56.2
- 安装常用软件
yum install net-tools vim lrzsz screen lsof tcpdump nc mtr nmap -y
yum  update -y && reboot
1.设置部署节点到其它所有节点的SSH免密码登录(包括本机)
[root@linux-node1 ~]# ssh-keygen -t rsa
[root@linux-node1 ~]# ssh-copy-id linux-node1
[root@linux-node1 ~]# ssh-copy-id linux-node2
[root@linux-node1 ~]# ssh-copy-id linux-node3
2.安装Salt-SSH并克隆本项目代码。
2.1 安装Salt SSH(注意:老版本的Salt SSH不支持Roster定义Grains,需要2017.7.4以上版本)
[root@linux-node1 ~]# yum install https://repo.saltstack.com/yum/redhat/salt-repo-latest-2.el7.noarch.rpm
[root@linux-node1 ~]# yum install -y salt-ssh git
2.2 获取本项目代码,并放置在/srv目录
[root@linux-node1 ~]# git clone https://github.com/unixhot/salt-kubernetes.git
[root@linux-node1 srv]# cd salt-kubernetes/
[root@linux-node1 srv]# mv * /srv/
[root@linux-node1 srv]# cd /srv/
[root@linux-node1 srv]# cp roster /etc/salt/roster
[root@linux-node1 srv]# cp master /etc/salt/master
2.4 下载二进制文件,也可以自行官方下载,为了方便国内用户访问,请在百度云盘下载。 下载完成后,将文件移动到/srv/salt/k8s/目录下,并解压 Kubernetes二进制文件。
[root@linux-node1 ~]# cd /srv/salt/k8s/
[root@linux-node1 k8s]# unzip k8s-v1.10.3-auto.zip
[root@linux-node1 k8s]# ls -l files/
total 0
drwxr-xr-x 2 root root  94 Mar 28 00:33 cfssl-1.2
drwxrwxr-x 2 root root 195 Mar 27 23:15 cni-plugins-amd64-v0.7.0
drwxr-xr-x 2 root root  33 Mar 28 00:33 etcd-v3.3.1-linux-amd64
drwxr-xr-x 2 root root  47 Mar 28 12:05 flannel-v0.10.0-linux-amd64
drwxr-xr-x 3 root root  17 Mar 28 00:47 k8s-v1.10.3
3.Salt SSH管理的机器以及角色分配
- k8s-role: 用来设置K8S的角色
- etcd-role: 用来设置etcd的角色,如果只需要部署一个etcd,只需要在一台机器上设置即可
- etcd-name: 如果对一台机器设置了etcd-role就必须设置etcd-name
[root@linux-node1 ~]# vim /etc/salt/roster
linux-node1:
  host: 192.168.56.11
  user: root
  priv: /root/.ssh/id_rsa
  minion_opts:
    grains:
      k8s-role: master
      etcd-role: node
      etcd-name: etcd-node1

linux-node2:
  host: 192.168.56.12
  user: root
  priv: /root/.ssh/id_rsa
  minion_opts:
    grains:
      k8s-role: node
      etcd-role: node
      etcd-name: etcd-node2

linux-node3:
  host: 192.168.56.13
  user: root
  priv: /root/.ssh/id_rsa
  minion_opts:
    grains:
      k8s-role: node
      etcd-role: node
      etcd-name: etcd-node3
4.修改对应的配置参数,本项目使用Salt Pillar保存配置
[root@linux-node1 ~]# vim /srv/pillar/k8s.sls
#设置Master的IP地址(必须修改)
MASTER_IP: "192.168.56.11"

#设置ETCD集群访问地址(必须修改)
ETCD_ENDPOINTS: "https://192.168.56.11:2379,https://192.168.56.12:2379,https://192.168.56.13:2379"

#设置ETCD集群初始化列表(必须修改)
ETCD_CLUSTER: "etcd-node1=https://192.168.56.11:2380,etcd-node2=https://192.168.56.12:2380,etcd-node3=https://192.168.56.13:2380"

#通过Grains FQDN自动获取本机IP地址,请注意保证主机名解析到本机IP地址
NODE_IP: {{ grains['fqdn_ip4'][0] }}

#设置BOOTSTARP的TOKEN,可以自己生成
BOOTSTRAP_TOKEN: "ad6d5bb607a186796d8861557df0d17f"

#配置Service IP地址段
SERVICE_CIDR: "10.1.0.0/16"

#Kubernetes服务 IP (从 SERVICE_CIDR 中预分配)
CLUSTER_KUBERNETES_SVC_IP: "10.1.0.1"

#Kubernetes DNS 服务 IP (从 SERVICE_CIDR 中预分配)
CLUSTER_DNS_SVC_IP: "10.1.0.2"

#设置Node Port的端口范围
NODE_PORT_RANGE: "20000-40000"

#设置POD的IP地址段
POD_CIDR: "10.2.0.0/16"

#设置集群的DNS域名
CLUSTER_DNS_DOMAIN: "cluster.local."
5.执行SaltStack状态
测试Salt SSH联通性
[root@linux-node1 ~]# salt-ssh '*' test.ping

执行高级状态,会根据定义的角色再对应的机器部署对应的服务

5.1 部署Etcd,由于Etcd是基础组建,需要先部署,目标为部署etcd的节点。
[root@linux-node1 ~]# salt-ssh -L 'linux-node1,linux-node2,linux-node3' state.sls k8s.etcd

5.2 部署K8S集群
[root@linux-node1 ~]# salt-ssh '*' state.highstate
由于包比较大,这里执行时间较长,5分钟+,如果执行有失败可以再次执行即可!
6.测试Kubernetes安装
[root@linux-node1 ~]# source /etc/profile
[root@k8s-node1 ~]# kubectl get cs
NAME                 STATUS    MESSAGE             ERROR
scheduler            Healthy   ok
controller-manager   Healthy   ok
etcd-0               Healthy   {"health":"true"}
etcd-2               Healthy   {"health":"true"}
etcd-1               Healthy   {"health":"true"}
[root@linux-node1 ~]# kubectl get node
NAME            STATUS    ROLES     AGE       VERSION
192.168.56.12   Ready     <none>    1m        v1.10.3
192.168.56.13   Ready     <none>    1m        v1.10.3
7.测试Kubernetes集群和Flannel网络
[root@linux-node1 ~]# kubectl run net-test --image=alpine --replicas=2 sleep 360000
deployment "net-test" created
需要等待拉取镜像,可能稍有的慢,请等待。
[root@linux-node1 ~]# kubectl get pod -o wide
NAME                        READY     STATUS    RESTARTS   AGE       IP          NODE
net-test-5767cb94df-n9lvk   1/1       Running   0          14s       10.2.12.2   192.168.56.13
net-test-5767cb94df-zclc5   1/1       Running   0          14s       10.2.24.2   192.168.56.12

测试联通性,如果都能ping通,说明Kubernetes集群部署完毕,有问题请QQ群交流。
[root@linux-node1 ~]# ping -c 1 10.2.12.2
PING 10.2.12.2 (10.2.12.2) 56(84) bytes of data.
64 bytes from 10.2.12.2: icmp_seq=1 ttl=61 time=8.72 ms

--- 10.2.12.2 ping statistics ---
1 packets transmitted, 1 received, 0% packet loss, time 0ms
rtt min/avg/max/mdev = 8.729/8.729/8.729/0.000 ms

[root@linux-node1 ~]# ping -c 1 10.2.24.2
PING 10.2.24.2 (10.2.24.2) 56(84) bytes of data.
64 bytes from 10.2.24.2: icmp_seq=1 ttl=61 time=22.9 ms

--- 10.2.24.2 ping statistics ---
1 packets transmitted, 1 received, 0% packet loss, time 0ms
rtt min/avg/max/mdev = 22.960/22.960/22.960/0.000 ms
7.如何新增Kubernetes节点
- 1.设置SSH无密码登录
- 2.在/etc/salt/roster里面,增加对应的机器
- 3.执行SaltStack状态salt-ssh '*' state.highstate。
[root@linux-node1 ~]# vim /etc/salt/roster
linux-node4:
  host: 192.168.56.14
  user: root
  priv: /root/.ssh/id_rsa
  minion_opts:
    grains:
      k8s-role: node
[root@linux-node1 ~]# salt-ssh '*' state.highstate


8. 部署Kubernetes Proxy
1.配置kube-proxy使用LVS (备注:三个节点都要安装软件,但是linux-node2和linux-node3启服务。Linux-node1不启服务。)
[root@linux-node1 ~]# yum install -y ipvsadm ipset conntrack
2.创建 kube-proxy 证书请求
[root@linux-node1 ~]# cd /usr/local/src/ssl/
[root@linux-node1 ~]# vim kube-proxy-csr.json
{
  "CN": "system:kube-proxy",
  "hosts": [],
  "key": {
    "algo": "rsa",
    "size": 2048
  },
  "names": [
    {
      "C": "CN",
      "ST": "BeiJing",
      "L": "BeiJing",
      "O": "k8s",
      "OU": "System"
    }
  ]
}
3.生成证书
[root@linux-node1~]# cfssl gencert -ca=/opt/kubernetes/ssl/ca.pem \
   -ca-key=/opt/kubernetes/ssl/ca-key.pem \
   -config=/opt/kubernetes/ssl/ca-config.json \
   -profile=kubernetes  kube-proxy-csr.json | cfssljson -bare kube-proxy
4.分发证书到所有Node节点
[root@linux-node1 ssl]# cp kube-proxy*.pem /opt/kubernetes/ssl/
[root@linux-node1 ssl]# scp kube-proxy*.pem 192.168.56.12:/opt/kubernetes/ssl/
[root@linux-node1 ssl]# scp kube-proxy*.pem 192.168.56.12:/opt/kubernetes/ssl/
5.创建kube-proxy配置文件
[root@linux-node1 ~]# kubectl config set-cluster kubernetes \
   --certificate-authority=/opt/kubernetes/ssl/ca.pem \
   --embed-certs=true \
   --server=https://192.168.56.11:6443 \
   --kubeconfig=kube-proxy.kubeconfig
Cluster "kubernetes" set.

[root@linux-node1 ~]# kubectl config set-credentials kube-proxy \
   --client-certificate=/opt/kubernetes/ssl/kube-proxy.pem \
   --client-key=/opt/kubernetes/ssl/kube-proxy-key.pem \
   --embed-certs=true \
   --kubeconfig=kube-proxy.kubeconfig
User "kube-proxy" set.

[root@linux-node1 ~]# kubectl config set-context default \
   --cluster=kubernetes \
   --user=kube-proxy \
   --kubeconfig=kube-proxy.kubeconfig
Context "default" created.

[root@linux-node1 ~]# kubectl config use-context default --kubeconfig=kube-proxy.kubeconfig
Switched to context "default".
6.分发kubeconfig配置文件
[root@linux-node1 ssl]# cp kube-proxy.kubeconfig /opt/kubernetes/cfg/
[root@linux-node1 ~]# scp kube-proxy.kubeconfig 192.168.56.12:/opt/kubernetes/cfg/
[root@linux-node1 ~]# scp kube-proxy.kubeconfig 192.168.56.13:/opt/kubernetes/cfg/
7.创建kube-proxy服务配置
[root@linux-node1 bin]# mkdir /var/lib/kube-proxy

[root@k8s-node1 ~]# vim /usr/lib/systemd/system/kube-proxy.service
[Unit]
Description=Kubernetes Kube-Proxy Server
Documentation=https://github.com/GoogleCloudPlatform/kubernetes
After=network.target

[Service]
WorkingDirectory=/var/lib/kube-proxy
ExecStart=/opt/kubernetes/bin/kube-proxy \
  --bind-address=192.168.56.11 \
  --hostname-override=192.168.56.11 \
  --kubeconfig=/opt/kubernetes/cfg/kube-proxy.kubeconfig \
--masquerade-all \
  --feature-gates=SupportIPVSProxyMode=true \
  --proxy-mode=ipvs \
  --ipvs-min-sync-period=5s \
  --ipvs-sync-period=5s \
  --ipvs-scheduler=rr \
  --logtostderr=true \
  --v=2 \
  --logtostderr=false \
  --log-dir=/opt/kubernetes/log

Restart=on-failure
RestartSec=5
LimitNOFILE=65536

[Install]
WantedBy=multi-user.target

# 发送配置文件,并修改配置文件中的ip地址,改成相应服务器的ip地址。
scp /usr/lib/systemd/system/kube-proxy.service 192.168.56.12:/usr/lib/systemd/system/kube-proxy.service scp /usr/lib/systemd/system/kube-proxy.service 192.168.56.13:/usr/lib/systemd/system/kube-proxy.service
8.启动Kubernetes Proxy(备注:但是linux-node2和linux-node3启服务。Linux-node1不启服务。))
[root@linux-node2 ~]# systemctl daemon-reload
[root@linux-node2 ~]# systemctl enable kube-proxy
[root@linux-node2 ~]# systemctl start kube-proxy
9.查看服务状态 查看kube-proxy服务状态
[root@linux-node2 scripts]# systemctl status kube-proxy

检查LVS状态
[root@linux-node2 ~]# ipvsadm -L -n
IP Virtual Server version 1.2.1 (size=4096)
Prot LocalAddress:Port Scheduler Flags
  -> RemoteAddress:Port           Forward Weight ActiveConn InActConn
TCP  10.1.0.1:443 rr persistent 10800
  -> 192.168.56.11:6443           Masq    1      0          0
如果你在两台实验机器都安装了kubelet和proxy服务,使用下面的命令可以检查状态:(备注:在linux-node1上面操作)
[root@linux-node1 ssl]#  kubectl get node
NAME            STATUS    ROLES     AGE       VERSION
192.168.56.12   Ready     <none>    22m       v1.10.1
192.168.56.13   Ready     <none>    3m        v1.10.1
10、CoreDNS和Dashboard部署
10.1、安装CoreDNS
#编写CoreDNS脚本:
[root@linux-node1 ~]# cat coredns.yaml
apiVersion: v1
kind: ServiceAccount
metadata:
  name: coredns
  namespace: kube-system
  labels:
      kubernetes.io/cluster-service: "true"
      addonmanager.kubernetes.io/mode: Reconcile
---
apiVersion: rbac.authorization.k8s.io/v1
kind: ClusterRole
metadata:
  labels:
    kubernetes.io/bootstrapping: rbac-defaults
    addonmanager.kubernetes.io/mode: Reconcile
  name: system:coredns
rules:
- apiGroups:
  - ""
  resources:
  - endpoints
  - services
  - pods
  - namespaces
  verbs:
  - list
  - watch
---
apiVersion: rbac.authorization.k8s.io/v1
kind: ClusterRoleBinding
metadata:
  annotations:
    rbac.authorization.kubernetes.io/autoupdate: "true"
  labels:
    kubernetes.io/bootstrapping: rbac-defaults
    addonmanager.kubernetes.io/mode: EnsureExists
  name: system:coredns
roleRef:
  apiGroup: rbac.authorization.k8s.io
  kind: ClusterRole
  name: system:coredns
subjects:
- kind: ServiceAccount
  name: coredns
  namespace: kube-system
---
apiVersion: v1
kind: ConfigMap
metadata:
  name: coredns
  namespace: kube-system
  labels:
      addonmanager.kubernetes.io/mode: EnsureExists
data:
  Corefile: |
    .:53 {
        errors
        health
        kubernetes cluster.local. in-addr.arpa ip6.arpa {
            pods insecure
            upstream
            fallthrough in-addr.arpa ip6.arpa
        }
        prometheus :9153
        proxy . /etc/resolv.conf
        cache 30
    }
---
apiVersion: extensions/v1beta1
kind: Deployment
metadata:
  name: coredns
  namespace: kube-system
  labels:
    k8s-app: coredns
    kubernetes.io/cluster-service: "true"
    addonmanager.kubernetes.io/mode: Reconcile
    kubernetes.io/name: "CoreDNS"
spec:
  replicas: 2
  strategy:
    type: RollingUpdate
    rollingUpdate:
      maxUnavailable: 1
  selector:
    matchLabels:
      k8s-app: coredns
  template:
    metadata:
      labels:
        k8s-app: coredns
    spec:
      serviceAccountName: coredns
      tolerations:
        - key: node-role.kubernetes.io/master
          effect: NoSchedule
        - key: "CriticalAddonsOnly"
          operator: "Exists"
      containers:
      - name: coredns
        image: coredns/coredns:1.0.6
        imagePullPolicy: IfNotPresent
        resources:
          limits:
            memory: 170Mi
          requests:
            cpu: 100m
            memory: 70Mi
        args: [ "-conf", "/etc/coredns/Corefile" ]
        volumeMounts:
        - name: config-volume
          mountPath: /etc/coredns
        ports:
        - containerPort: 53
          name: dns
          protocol: UDP
        - containerPort: 53
          name: dns-tcp
          protocol: TCP
        livenessProbe:
          httpGet:
            path: /health
            port: 8080
            scheme: HTTP
          initialDelaySeconds: 60
          timeoutSeconds: 5
          successThreshold: 1
          failureThreshold: 5
      dnsPolicy: Default
      volumes:
        - name: config-volume
          configMap:
            name: coredns
            items:
            - key: Corefile
              path: Corefile
---
apiVersion: v1
kind: Service
metadata:
  name: coredns
  namespace: kube-system
  labels:
    k8s-app: coredns
    kubernetes.io/cluster-service: "true"
    addonmanager.kubernetes.io/mode: Reconcile
    kubernetes.io/name: "CoreDNS"
spec:
  selector:
    k8s-app: coredns
  clusterIP: 10.1.0.2
  ports:
  - name: dns
    port: 53
    protocol: UDP
  - name: dns-tcp
    port: 53
    protocol: TCP
#上传脚本到linux-node1节点上面。 (备注:在linux-node1上面执行)
[root@linux-node1 ~]# lltotal 1130548-rw-r--r-- 1 root root 3459 Jun 3 04:50 coredns.yaml |
#创建coredns (备注:在linux-node1上面执行)
[root@linux-node1 ~]# kubectl create -f coredns.yaml serviceaccount "coredns" createdclusterrole.rbac.authorization.k8s.io "system:coredns" createdclusterrolebinding.rbac.authorization.k8s.io "system:coredns" createdconfigmap "coredns" createddeployment.extensions "coredns" created |
#查看deployment (备注:系统默认的服务,单独放在一个命名空间里面。)
[root@linux-node1 ~]# kubectl get deployment -n kube-systemNAME DESIRED CURRENT UP-TO-DATE AVAILABLE AGEcoredns 2 2 2 2 6m |
#查看pod的服务否启动
[root@linux-node1 ~]# kubectl get pod -n kube-systemNAME READY STATUS RESTARTS AGEcoredns-77c989547b-9pj8b 1/1 Running 0 6mcoredns-77c989547b-kncd5 1/1 Running 0 6m |
#查看服务是否启动
[root@linux-node1 ~]# kubectl get service -n kube-systemNAME TYPE CLUSTER-IP EXTERNAL-IP PORT(S) AGEcoredns ClusterIP 10.1.0.2 <none> 53/UDP,53/TCP 7m |
#view Lvs (备注:在linux-node2操作)
[root@linux-node2 ~]# ipvsadm -LnIP Virtual Server version 1.2.1 (size=4096)Prot LocalAddress:Port Scheduler Flags -> RemsoteAddress:Port Forward Weight ActiveConn InActConnTCP 10.1.0.1:443 rr persistent 10800 -> 192.168.56.11:6443 Masq 1 1 0 TCP 10.1.0.2:53 rr -> 10.2.15.9:53 Masq 1 0 0 -> 10.2.89.8:53 Masq 1 0 0 TCP 10.1.156.120:80 rr -> 10.2.15.6:80 Masq 1 0 0 -> 10.2.15.7:80 Masq 1 0 0 -> 10.2.15.8:80 Masq 1 0 0 -> 10.2.89.6:80 Masq 1 0 0 -> 10.2.89.7:80 Masq 1 0 0 UDP 10.1.0.2:53 rr #访问10.1.0.2:53,转发到10.2.15.9:53 and 10.2.89.8:53 -> 10.2.15.9:53 Masq 1 0 0 -> 10.2.89.8:53 Masq 1 0 0 |
#查看pod
[root@linux-node1 ~]# kubectl get pod -n kube-systemNAME READY STATUS RESTARTS AGEcoredns-77c989547b-57jjq 1/1 Running 0 11mcoredns-77c989547b-cvt4h 1/1 Running 0 11m |
#测试dns是否部署完成
[root@linux-node1 ~]# kubectl run dns-test --rm -it --image=alpine /bin/shIf you don't see a command prompt, try pressing enter./ # ping baidu.com #能ping通,说明dns部署okPING baidu.com (220.181.57.216): 56 data bytes64 bytes from 220.181.57.216: seq=0 ttl=127 time=56.303 ms64 bytes from 220.181.57.216: seq=1 ttl=127 time=53.219 ms64 bytes from 220.181.57.216: seq=2 ttl=127 time=49.618 ms64 bytes from 220.181.57.216: seq=3 ttl=127 time=53.750 ms^C--- baidu.com ping statistics ---4 packets transmitted, 4 packets received, 0% packet lossround-trip min/avg/max = 49.618/53.222/56.303 ms |
/ # exit #退出
Session ended, resume using 'kubectl attach dns-test-c6c485c47-6z8dh -c dns-test -i -t' command when the pod is running
#查看日志 参数:-n 是一个独立的命令空间,必须指定-n参数,否则就会提示你找不到
[root@linux-node1 ~]# kubectl get pod -n kube-systemNAME READY STATUS RESTARTS AGEcoredns-77c989547b-57jjq 1/1 Running 0 24mcoredns-77c989547b-cvt4h 1/1 Running 0 24mkubernetes-dashboard-66c9d98865-6k98r 0/1 ImagePullBackOff 0 6m |
#查看pod的日志
[root@linux-node1 ~]# kubectl logs pod/coredns-77c989547b-57jjq -n kube-system.:53CoreDNS-1.0.6linux/amd64, go1.10, 83b5eadb2018/06/06 11:34:29 [INFO] CoreDNS-1.0.62018/06/06 11:34:29 [INFO] linux/amd64, go1.10, 83b5eadb |
10.2、创建Dashboard
#上传软件到linux-node1,/root目录
#上传软件包[root@linux-node1 ~]# ll-rw-r--r-- 1 root root 1927 Jun 6 19:51 dashboard.tar.gz#解压tar xf dashboard.tar.gz#查看[root@linux-node1 ~]# lldrwxr-xr-x 2 root root 117 Jun 6 19:50 dashboard-rw-r--r-- 1 root root 1927 Jun 6 19:51 dashboard.tar.gz |
#进入目录
[root@linux-node1 ~]# cd dashboard[root@linux-node1 dashboard]# lltotal 20-rw-r--r-- 1 root root 357 Jun 6 19:50 admin-user-sa-rbac.yaml-rw-r--r-- 1 root root 4884 Jun 6 19:50 kubernetes-dashboard.yaml-rw-r--r-- 1 root root 458 Jun 6 19:50 ui-admin-rbac.yaml-rw-r--r-- 1 root root 477 Jun 6 19:50 ui-read-rbac.yaml#安装[root@linux-node1 dashboard]# kubectl create -f .serviceaccount "admin-user" createdclusterrolebinding.rbac.authorization.k8s.io "admin-user" createdsecret "kubernetes-dashboard-certs" createdserviceaccount "kubernetes-dashboard" createdrole.rbac.authorization.k8s.io "kubernetes-dashboard-minimal" createdrolebinding.rbac.authorization.k8s.io "kubernetes-dashboard-minimal" createddeployment.apps "kubernetes-dashboard" createdservice "kubernetes-dashboard" createdclusterrole.rbac.authorization.k8s.io "ui-admin" createdrolebinding.rbac.authorization.k8s.io "ui-admin-binding" createdclusterrole.rbac.authorization.k8s.io "ui-read" createdrolebinding.rbac.authorization.k8s.io "ui-read-binding" created |
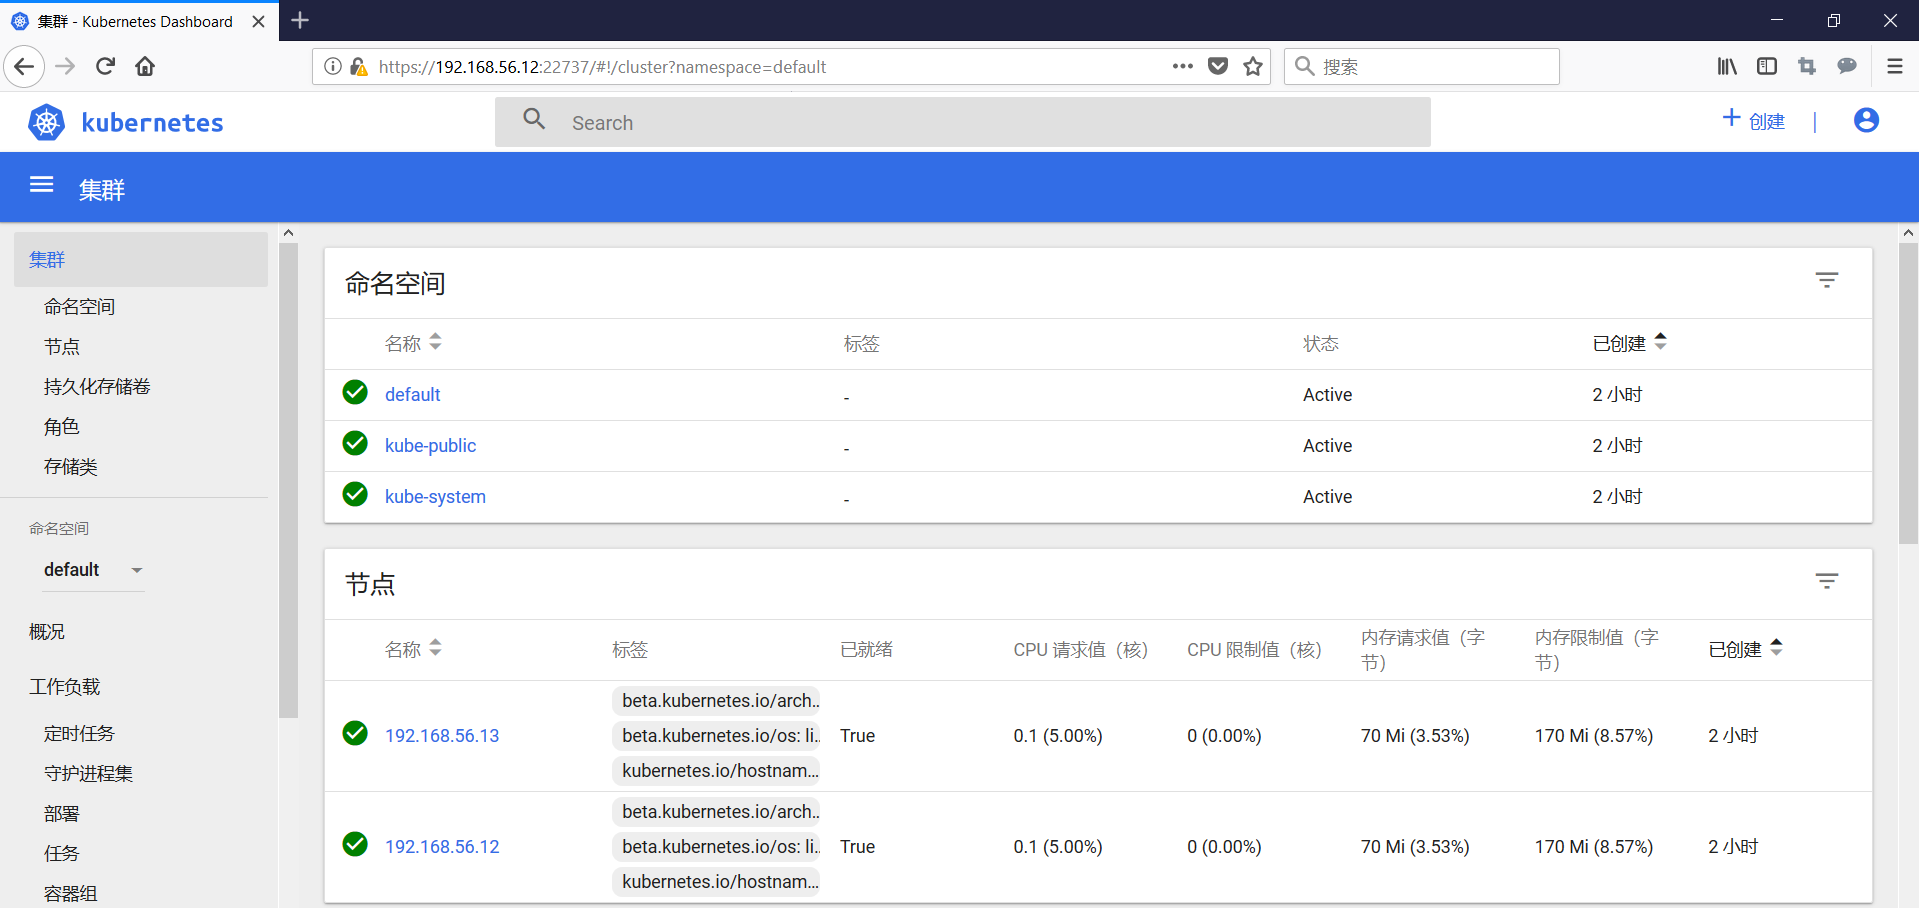
#查看集群信息
|
1
2
3
4
5
6
|
[root@linux-node1 dashboard]# kubectl cluster-infoKubernetes master is running at https://192.168.56.11:6443CoreDNS is running at https://192.168.56.11:6443/api/v1/namespaces/kube-system/services/coredns:dns/proxykubernetes-dashboard is running at https://192.168.56.11:6443/api/v1/namespaces/kube-system/services/https:kubernetes-dashboard:/proxyTo further debug and diagnose cluster problems, use 'kubectl cluster-info dump'. |
#查看pod and service
|
1
2
3
4
5
6
|
查看pod[root@linux-node1 ~]# kubectl get pod -n kube-systemNAME READY STATUS RESTARTS AGEcoredns-77c989547b-57jjq 1/1 Running 0 28mcoredns-77c989547b-cvt4h 1/1 Running 0 28mkubernetes-dashboard-66c9d98865-6k98r 1/1 Running 0 9m |
|
1
2
3
4
5
|
#查看service (dashboard监听了node节点,)[root@linux-node1 dashboard]# kubectl get service -n kube-systemNAME TYPE CLUSTER-IP EXTERNAL-IP PORT(S) AGEcoredns ClusterIP 10.1.0.2 <none> 53/UDP,53/TCP 13mkubernetes-dashboard NodePort 10.1.23.38 <none> 443:22737/TCP 1m |
#访问dashboard
https://192.168.56.12:22737
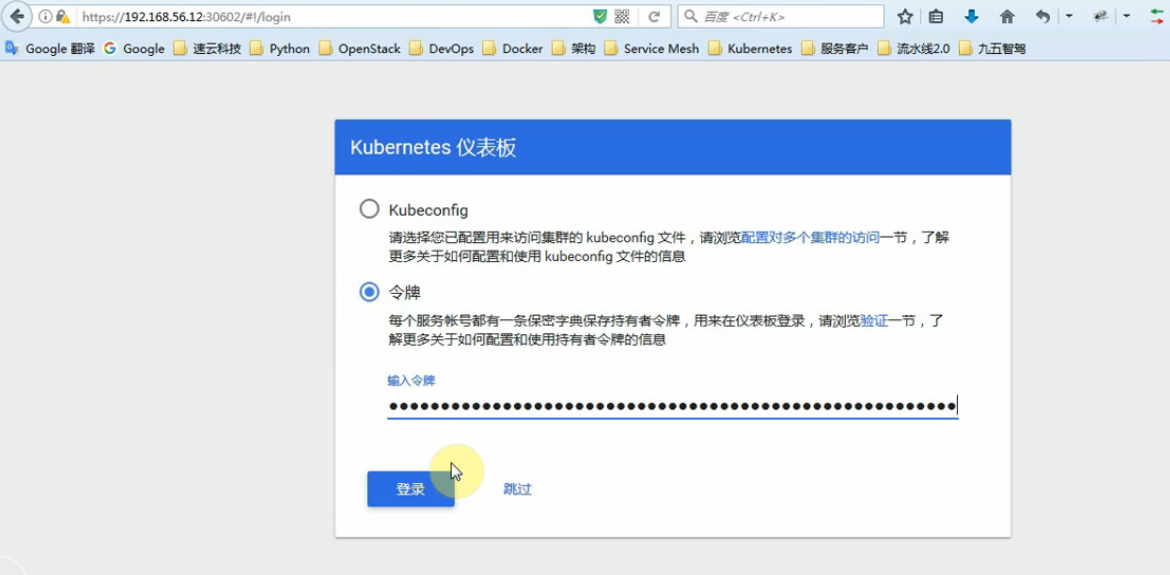
#获取令牌,会生成token
kubectl -n kube-system describe secret $(kubectl -n kube-system get secret | grep admin-user | awk '{print $1}') |
执行结果:
[root@linux-node1 dashboard]# kubectl -n kube-system describe secret $(kubectl -n kube-system get secret | grep admin-user | awk '{print $1}')Name: admin-user-token-tlj2lNamespace: kube-systemLabels: <none>Annotations: kubernetes.io/service-account.name=admin-user kubernetes.io/service-account.uid=1e118661-6e26-11e8-9f63-000c29d2b766Type: kubernetes.io/service-account-tokenData====ca.crt: 1359 bytesnamespace: 11 bytestoken: eyJhbGciOiJSUzI1NiIsImtpZCI6IiJ9.eyJpc3MiOiJrdWJlcm5ldGVzL3NlcnZpY2VhY2NvdW50Iiwia3ViZXJuZXRlcy5pby9zZXJ2aWNlYWNjb3VudC9uYW1lc3BhY2UiOiJrdWJlLXN5c3RlbSIsImt1YmVybmV0ZXMuaW8vc2VydmljZWFjY291bnQvc2VjcmV0Lm5hbWUiOiJhZG1pbi11c2VyLXRva2VuLXRsajJsIiwia3ViZXJuZXRlcy5pby9zZXJ2aWNlYWNjb3VudC9zZXJ2aWNlLWFjY291bnQubmFtZSI6ImFkbWluLXVzZXIiLCJrdWJlcm5ldGVzLmlvL3NlcnZpY2VhY2NvdW50L3NlcnZpY2UtYWNjb3VudC51aWQiOiIxZTExODY2MS02ZTI2LTExZTgtOWY2My0wMDBjMjlkMmI3NjYiLCJzdWIiOiJzeXN0ZW06c2VydmljZWFjY291bnQ6a3ViZS1zeXN0ZW06YWRtaW4tdXNlciJ9.cFbeIcA2hvn7K9rSUaUreoNGVv65FBWDi2ifFg7JQQFI2YL5s-uImlcCrgN-00WlT2HsHEK4ya5wr-Dhy81JrRE7d7Gbc5cZimbOyRT5HRWKA83wSSOXQy5crlej8VJQCWzKoHtdX0cI6wZItTd2-ef4OW017GvKfHI8EIjK27WPDPqyDQYxTSf3UX8BokASfmryemuwz3nm6s7l-e5UwmLz4dnekwvG3XKw127P0VuJPQ2IKDUL2idS23dg_WHbGBdB_CNRyXRpm_Z3IR9r5T9ShJffYiJ_kCrkHbEwip9PlJBUzWg9zZkZAZbpihXB-YR0E19KmiXgHZvDqtXo6Q |
#登录界面
#解决dashboard无法打开的问题
#通过yaml文件删除:
kubectl delete -f xxx.yaml
#删除yaml文件
[root@linux-node1 dashboard]# kubectl delete -f .
serviceaccount "admin-user" deleted
clusterrolebinding.rbac.authorization.k8s.io "admin-user" deleted
secret "kubernetes-dashboard-certs" deleted
serviceaccount "kubernetes-dashboard" deleted
role.rbac.authorization.k8s.io "kubernetes-dashboard-minimal" deleted
rolebinding.rbac.authorization.k8s.io "kubernetes-dashboard-minimal" deleted
deployment.apps "kubernetes-dashboard" deleted
service "kubernetes-dashboard" deleted
clusterrole.rbac.authorization.k8s.io "ui-admin" deleted
rolebinding.rbac.authorization.k8s.io "ui-admin-binding" deleted
clusterrole.rbac.authorization.k8s.io "ui-read" deleted
rolebinding.rbac.authorization.k8s.io "ui-read-binding" deleted
#查看服务发布的端口
[root@linux-node1 dashboard]# kubectl get service -n kube-system
NAME TYPE CLUSTER-IP EXTERNAL-IP PORT(S) AGE
coredns ClusterIP 10.1.0.2 <none> 53/UDP,53/TCP 12h
#kubectl apply -f xxx.yaml (创建+更新,可以重复使用)
[root@linux-node1 dashboard]# kubectl apply -f .
serviceaccount "admin-user" created
clusterrolebinding.rbac.authorization.k8s.io "admin-user" created
secret "kubernetes-dashboard-certs" created
serviceaccount "kubernetes-dashboard" created
role.rbac.authorization.k8s.io "kubernetes-dashboard-minimal" created
rolebinding.rbac.authorization.k8s.io "kubernetes-dashboard-minimal" created
deployment.apps "kubernetes-dashboard" created
service "kubernetes-dashboard" created
clusterrole.rbac.authorization.k8s.io "ui-admin" created
rolebinding.rbac.authorization.k8s.io "ui-admin-binding" created
clusterrole.rbac.authorization.k8s.io "ui-read" created
rolebinding.rbac.authorization.k8s.io "ui-read-binding" created
[root@linux-node1 dashboard]# kubectl get service -n kube-system
NAME TYPE CLUSTER-IP EXTERNAL-IP PORT(S) AGE
coredns ClusterIP 10.1.0.2 <none> 53/UDP,53/TCP 12h
kubernetes-dashboard NodePort 10.1.150.207 <none> 443:27819/TCP 10s
#查看pod
[root@linux-node1 dashboard]# kubectl get pod -n kube-system
NAME READY STATUS RESTARTS AGE
coredns-77c989547b-87sn9 1/1 Running 0 12h
coredns-77c989547b-bwtb9 1/1 Running 0 12h
kubernetes-dashboard-66c9d98865-98w9g 1/1 Running 0 4m
[root@linux-node1 dashboard]# kubectl describe pod kubernetes-dashboard-66c9d98865-98w9g --namespace kube-system
Name: kubernetes-dashboard-66c9d98865-98w9g
Namespace: kube-system
Node: 192.168.56.13/192.168.56.13
Start Time: Thu, 25 Apr 2019 12:42:07 +0800
Labels: k8s-app=kubernetes-dashboard
pod-template-hash=2275854421
Annotations: <none>
Status: Running
IP: 10.2.5.5
Controlled By: ReplicaSet/kubernetes-dashboard-66c9d98865
Containers:
kubernetes-dashboard:
Container ID: docker://07b6ea5906e8997d1359ac06fabe41c7050028a397422bffd8786541751918b2
Image: mirrorgooglecontainers/kubernetes-dashboard-amd64:v1.8.3
Image ID: docker-pullable://mirrorgooglecontainers/kubernetes-dashboard-amd64@sha256:3c886d8bdd4d399c63c5e6deefd6293c0a8e2c7a2cdfc149aaccc06f9fa9411e
Port: 8443/TCP
Host Port: 0/TCP
Args:
--auto-generate-certificates
State: Running
Started: Thu, 25 Apr 2019 12:42:43 +0800
Ready: True
Restart Count: 0
Liveness: http-get https://:8443/ delay=30s timeout=30s period=10s #success=1 #failure=3
Environment: <none>
Mounts:
/certs from kubernetes-dashboard-certs (rw)
/tmp from tmp-volume (rw)
/var/run/secrets/kubernetes.io/serviceaccount from kubernetes-dashboard-token-d5zc8 (ro)
Conditions:
Type Status
Initialized True
Ready True
PodScheduled True
Volumes:
kubernetes-dashboard-certs:
Type: Secret (a volume populated by a Secret)
SecretName: kubernetes-dashboard-certs
Optional: false
tmp-volume:
Type: EmptyDir (a temporary directory that shares a pod's lifetime)
Medium:
kubernetes-dashboard-token-d5zc8:
Type: Secret (a volume populated by a Secret)
SecretName: kubernetes-dashboard-token-d5zc8
Optional: false
QoS Class: BestEffort
Node-Selectors: <none>
Tolerations: node-role.kubernetes.io/master:NoSchedule
Events:
Type Reason Age From Message
---- ------ ---- ---- -------
Normal Scheduled 8m default-scheduler Successfully assigned kubernetes-dashboard-66c9d98865-98w9g to 192.168.56.13
Normal SuccessfulMountVolume 8m kubelet, 192.168.56.13 MountVolume.SetUp succeeded for volume "tmp-volume"
Normal SuccessfulMountVolume 8m kubelet, 192.168.56.13 MountVolume.SetUp succeeded for volume "kubernetes-dashboard-certs"
Normal SuccessfulMountVolume 8m kubelet, 192.168.56.13 MountVolume.SetUp succeeded for volume "kubernetes-dashboard-token-d5zc8"
Normal Pulling 8m kubelet, 192.168.56.13 pulling image "mirrorgooglecontainers/kubernetes-dashboard-amd64:v1.8.3"
Normal Pulled 8m kubelet, 192.168.56.13 Successfully pulled image "mirrorgooglecontainers/kubernetes-dashboard-amd64:v1.8.3"
Normal Created 8m kubelet, 192.168.56.13 Created container
Normal Started 8m kubelet, 192.168.56.13 Started container
#登录

#kubernetes命令记录
参考:https://www.cnblogs.com/ssss429170331/p/7685044.html
#集成Heapster
Heapster是容器集群监控和性能分析工具,天然的支持Kubernetes和CoreOS。
Heapster支持多种储存方式,本示例中使用influxdb,直接执行下列命令即可:
kubectl create -f http://mirror.faasx.com/kubernetes/heapster/deploy/kube-config/influxdb/influxdb.yaml
kubectl create -f http://mirror.faasx.com/kubernetes/heapster/deploy/kube-config/influxdb/grafana.yaml
kubectl create -f http://mirror.faasx.com/kubernetes/heapster/deploy/kube-config/influxdb/heapster.yaml
kubectl create -f http://mirror.faasx.com/kubernetes/heapster/deploy/kube-config/rbac/heapster-rbac.yaml
查看pod的状态
[root@linux-node1 ~]# kubectl get pods --namespace=kube-system
NAME                                    READY     STATUS              RESTARTS   AGE
coredns-77c989547b-87sn9                1/1       Running             0          13h
coredns-77c989547b-bwtb9                1/1       Running             0          13h
heapster-5869b599bd-wth8b               0/1       ContainerCreating   0          18s
kubernetes-dashboard-66c9d98865-98w9g   1/1       Running             0          59m
monitoring-grafana-679f6b46cb-gjnbr     0/1       ContainerCreating   0          22s
monitoring-influxdb-6f875dc468-xgjpw    1/1       Running             0          24s
#刷新一下首页,再登录

heapster源码
https://github.com/kubernetes-retired/heapster

 浙公网安备 33010602011771号