金融量化分析【day112】:股票数据分析Tushare1
目录
1、使用tushare包获取某股票的历史行情数据
2、输出该股票所有收盘比开盘上涨3%以上的日期
3、输出该股票所有开盘比前日收盘跌幅超过2%的日期
4、假如我从2010年1月1日开始,每月第一个交易日买入1受股票,每年最后一个交易日卖出所有的股票,到今天为止,我的收益如何?
Tushare金融数据接口
Tushare是一个免费、开源的python测井数据接口包
一、 使用tushare包获取某股票的历史行情数据
1、实现代码
import pandas as pd
import numpy as np
import tushare as ts
%matplotlib auto
df = ts.get_k_data("600519", start="1988-01-01")
df.to_csv("600519.csv")
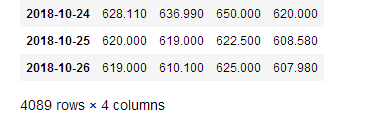
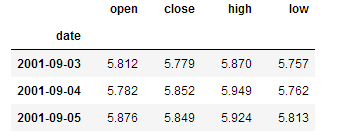
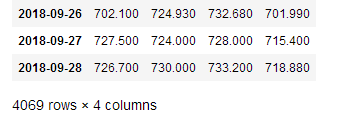
df = pd.read_csv("600519.csv",index_col='date',parse_dates=['date'])[['open','close','high','low']]
df
2、输出截图

......
二、 输出该股票所有收盘比开盘上涨3%以上的日期
1、代码
df[(df['close']-df['open'])/df['open']>0.03].index
2、输出

三、 输出该股票所有开盘比前日收盘跌幅超过2%的日期
1、答案
1、代码
df[(df['open']-df['close'].shift(1))/df['close'].shift(1)<=-0.02].index
2、输出

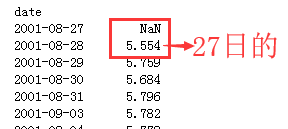
2、shift说明
1、代码
df['close'].shift(1)
2、输出
四、 假如我从2010年1月1日开始,每月第一个交易日买入1受股票,每年最后一个交易日卖出所有的股票,到今天为止,我的收益如何?
0、答案
1、代码
df_monthly = df.resample('M').first()
df_yearly = df.resample('A').last()[:-1]
cost_money = 0
hold = 0
for year in range(2001, 2019):
cost_money += df_monthly[str(year)]['open'].sum()*100
hold += len(df_monthly[str(year)]['open']) * 100
if year != 2018:
cost_money -= df_yearly[str(year)]['open'][0] * hold
hold = 0
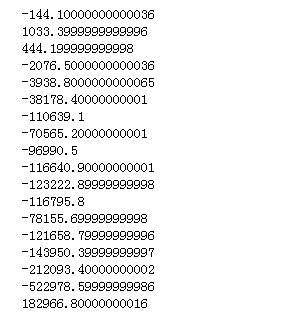
print(cost_money)
cost_money -= hold * price_last
print(-cost_money)
2、输出
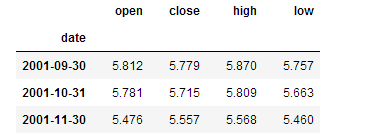
3、打印df_yearly
df_monthly = df.resample('M').first()
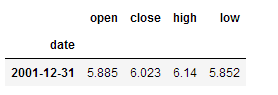
df_yearly = df.resample('A').last()[:-1]
df_yearly['2001']
输出
4、打印df_monthly
df_monthly['2018']

1、删除首尾无用数据
1、代码
price_last = df['open'][-1]
df = df['2001-9':'2018-9']
df
2、输出
.......
2、如何找每个月的第一一个交易日?
1、代码
df.resample('m').first()
2、输出
.........

3、如何找每个年的最后一个交易日?
1、代码
df.resample('3D').mean()
df.resample('A').last()[:-1]
2、输出

.........

切掉最后一行,是因为今年还没到年底
3、df.resample('A').last()深入
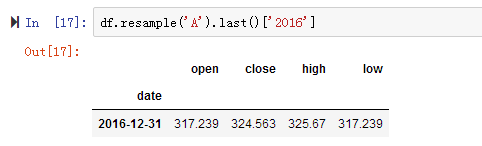
虽然显示的是一天但是其实代表一年
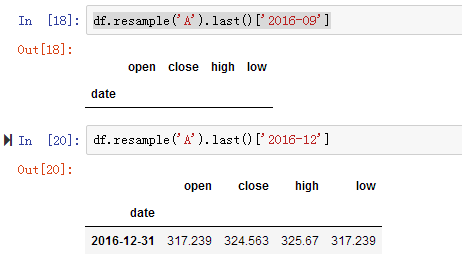
这是每年的最后一天,交易日不一定有这一天
作者:罗阿红
出处:http://www.cnblogs.com/luoahong/
本文版权归作者和博客园共有,欢迎转载,但未经作者同意必须保留此段声明,且在文章页面明显位置给出原文连接。

 浙公网安备 33010602011771号