kubernetes云平台管理实战:k8s弹性伸缩(十八)
一、什么是弹性伸缩
Horizontal Pod Autoscaler的操作对象是Replication Controller、ReplicaSet或Deployment对应的Pod,根据观察到的CPU使用量与用户的阈值进行比对,做出是否需要增减实例数量的决策。controller目前使用heapSter来检测CPU使用量,检测周期默认是30秒
二、创建hpa
nginx-rc.yaml
[root@master hpa]# cat nginx-rc.yaml
apiVersion: v1
kind: ReplicationController
metadata:
  name: myweb1
spec:
  replicas: 2
  selector:
    app: myweb1
  template:
    metadata:
      labels:
        app: myweb1
    spec:
      containers:
      - name: myweb1
        image: 192.168.118.18:5000/nginx:1.13
        ports:
        - containerPort: 80
        resources:
          limits:
            cpu: 100m
            memory: 50Mi
          requests:
            cpu: 100m
            memory: 50Mi
创建检查
[root@master hpa]# kubectl create -f nginx-rc.yaml
replicationcontroller "myweb1" created
[root@master hpa]# kubectl get pods -o wide --all-namespaces
NAMESPACE     NAME                                           READY     STATUS    RESTARTS   AGE       IP            NODE
default       mysql-3qkf1                                    1/1       Running   0          1d        172.16.60.7   192.168.118.19
default       myweb1-g1x3r                                   1/1       Running   0          25s       172.16.56.5   192.168.118.18
default       myweb1-xxxqs                                   1/1       Running   0          25s       172.16.60.2   192.168.118.19
kube-system   heapster-hrfmb                                 1/1       Running   0          36m       172.16.56.3   192.168.118.18
kube-system   influxdb-grafana-0lj0n                         2/2       Running   0          36m       172.16.56.4   192.168.118.18
kube-system   kube-dns-1835838994-jm5bk                      4/4       Running   0          7h        172.16.99.3   192.168.118.20
kube-system   kubernetes-dashboard-latest-2728556226-fc2pc   1/1       Running   0          5h        172.16.60.6   192.168.118.19
luoahong      myweb-qsml7                                    1/1       Running   0          3h        172.16.60.8   192.168.118.19
luoahong      myweb-sbsw2                                    1/1       Running   0          3h        172.16.99.4   192.168.118.20
[root@master hpa]# kubectl get rc -o wide --all-namespaces
NAMESPACE     NAME               DESIRED   CURRENT   READY     AGE       CONTAINER(S)       IMAGE(S)                                                                                 SELECTOR
default       mysql              1         1         1         1d        mysql              192.168.118.18:5000/mysql:5.7                                                            app=mysql
default       myweb1             2         2         2         45s       myweb1             192.168.118.18:5000/nginx:1.13                                                           app=myweb1
kube-system   heapster           1         1         1         36m       heapster           192.168.118.18:5000/heapster:canary                                                      k8s-app=heapster,version=v6
kube-system   influxdb-grafana   1         1         1         36m       influxdb,grafana   192.168.118.18:5000/heapster_influxdb:v0.5,192.168.118.18:5000/heapster_grafana:v2.6.0   name=influxGrafana
luoahong      myweb              2         2         2         3h        myweb              192.168.118.18:5000/nginx:1.13                                                           app=myweb
创建hpa
[root@master hpa]# kubectl autoscale replicationcontroller myweb1 --max=8 --min=1 --cpu-percent=10
replicationcontroller "myweb1" autoscaled
[root@master hpa]# kubectl get pods -o wide --all-namespaces
NAMESPACE     NAME                                           READY     STATUS    RESTARTS   AGE       IP            NODE
default       mysql-3qkf1                                    1/1       Running   0          1d        172.16.60.7   192.168.118.19
default       myweb1-xxxqs                                   1/1       Running   0          7m        172.16.60.2   192.168.118.19
kube-system   heapster-hrfmb                                 1/1       Running   0          42m       172.16.56.3   192.168.118.18
kube-system   influxdb-grafana-0lj0n                         2/2       Running   0          42m       172.16.56.4   192.168.118.18
kube-system   kube-dns-1835838994-jm5bk                      4/4       Running   0          7h        172.16.99.3   192.168.118.20
kube-system   kubernetes-dashboard-latest-2728556226-fc2pc   1/1       Running   0          6h        172.16.60.6   192.168.118.19
luoahong      myweb-qsml7                                    1/1       Running   0          3h        172.16.60.8   192.168.118.19
luoahong      myweb-sbsw2                                    1/1       Running   0          3h        172.16.99.4   192.168.118.2
三、压力测试
1、执行压力测试命令
[root@master hpa]# ab -n 500000 -c 100 http://172.16.60.2/index.html
This is ApacheBench, Version 2.3 <$Revision: 1430300 $>
Copyright 1996 Adam Twiss, Zeus Technology Ltd, http://www.zeustech.net/
Licensed to The Apache Software Foundation, http://www.apache.org/

Benchmarking 172.16.60.2 (be patient)
Completed 50000 requests
Completed 100000 requests
Completed 150000 requests
Completed 200000 requests
Completed 250000 requests
Completed 300000 requests
Completed 350000 requests
Completed 400000 requests
Completed 450000 requests
Completed 500000 requests
Finished 500000 requests


Server Software:        nginx/1.13.12
Server Hostname:        172.16.60.2
Server Port:            80

Document Path:          /index.html
Document Length:        612 bytes

Concurrency Level:      100
Time taken for tests:   389.121 seconds
Complete requests:      500000
Failed requests:        0
Write errors:           0
Total transferred:      423000000 bytes
HTML transferred:       306000000 bytes
Requests per second:    1284.95 [#/sec] (mean)
Time per request:       77.824 [ms] (mean)
Time per request:       0.778 [ms] (mean, across all concurrent requests)
Transfer rate:          1061.59 [Kbytes/sec] received

Connection Times (ms)
              min  mean[+/-sd] median   max
Connect:        0   18 146.3      3   15028
Processing:     0   60  80.5     74    5091
Waiting:        0   59  79.2     73    5091
Total:          2   78 171.3     77   15103

Percentage of the requests served within a certain time (ms)
  50%     77
  66%     89
  75%     96
  80%     98
  90%    100
  95%    284
  98%    303
  99%   1077
 100%  15103 (longest request)
2、查看容器状态描述
1、查看pod数量
[root@master kubernetes]# kubectl get pods -o wide |grep myweb1
myweb1-46kz9   1/1       Running   0          11s       172.16.99.5   192.168.118.20
myweb1-9nq3c   1/1       Running   0          4m        172.16.99.2   192.168.118.20
myweb1-9nsks   1/1       Running   0          11s       172.16.60.4   192.168.118.19
myweb1-flbds   1/1       Running   0          11s       172.16.60.3   192.168.118.19
myweb1-nhkqr   1/1       Running   0          11s       172.16.56.7   192.168.118.18
myweb1-q722p   1/1       Running   0          4m        172.16.56.6   192.168.118.18
myweb1-q78qh   1/1       Running   0          4m        172.16.56.5   192.168.118.18
myweb1-xxxqs   1/1       Running   0          14m       172.16.60.2   192.168.118.19
2、查看HPA状态描述
[root@master kubernetes]# kubectl describe hpa myweb1
Name:				myweb1
Namespace:			default
Labels:				<none>
Annotations:			<none>
CreationTimestamp:		Wed, 13 May 2020 17:59:04 +0800
Reference:			ReplicationController/myweb1
Target CPU utilization:		10%
Current CPU utilization:	25%
Min replicas:			1
Max replicas:			8
ReplicationController pods:	8 current / 8 desired
Events:
  FirstSeen	LastSeen	Count	From				SubObjectPath	Type		Reason			Message
  ---------	--------	-----	----				-------------	--------	------			-------
  12m		12m		2	{horizontal-pod-autoscaler }			Normal		MetricsNotAvailableYet	unable to get metrics for resource cpu: no metrics returned from heapster
  12m		12m		3	{horizontal-pod-autoscaler }			Normal		DesiredReplicasComputed	Computed the desired num of replicas: 0 (avgCPUutil: 0, current replicas: 2)
  12m		12m		1	{horizontal-pod-autoscaler }			Normal		SuccessfulRescale	New size: 1; reason: All metrics below target
  11m		4m		16	{horizontal-pod-autoscaler }			Normal		DesiredReplicasComputed	Computed the desired num of replicas: 0 (avgCPUutil: 0, current replicas: 1)
  4m		4m		1	{horizontal-pod-autoscaler }			Normal		DesiredReplicasComputed	Computed the desired num of replicas: 4 (avgCPUutil: 39, current replicas: 1)
  4m		4m		1	{horizontal-pod-autoscaler }			Normal		SuccessfulRescale	New size: 4; reason: CPU utilization above target
  3m		2m		3	{horizontal-pod-autoscaler }			Normal		DesiredReplicasComputed	Computed the desired num of replicas: 10 (avgCPUutil: 99, current replicas: 4)
  2m		15s		7	{horizontal-pod-autoscaler }			Normal		DesiredReplicasComputed	Computed the desired num of replicas: 10 (avgCPUutil: 25, current replicas: 4)
  15s		15s		1	{horizontal-pod-autoscaler }			Normal		SuccessfulRescale	New size: 8; reason: CPU utilization above target
  15s		15s		2	{horizontal-pod-autoscaler }			Normal		DesiredReplicasComputed	Computed the desired num of replicas: 10 (avgCPUutil: 25, current replicas: 8)
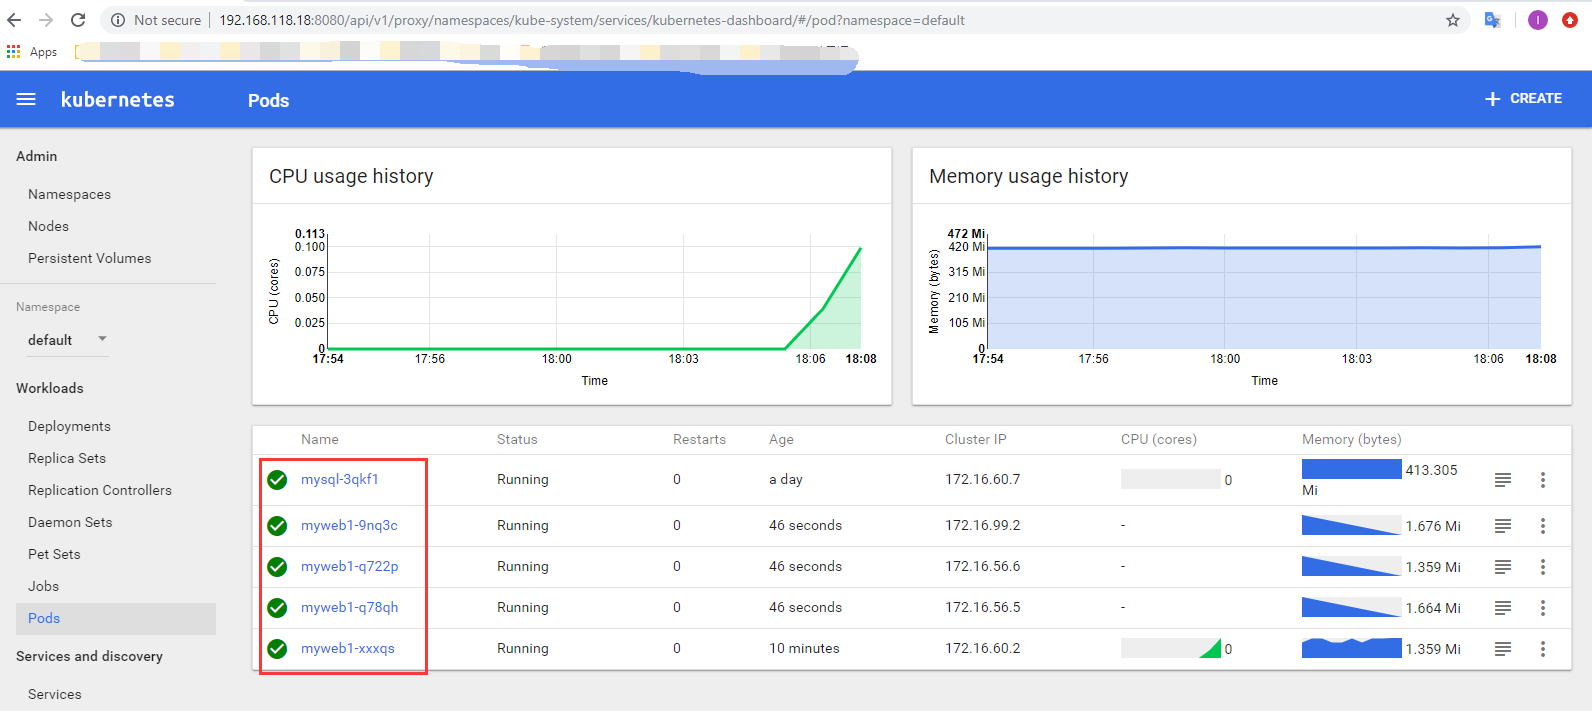
3、通过监控截图查看
作者:罗阿红
出处:http://www.cnblogs.com/luoahong/
本文版权归作者和博客园共有,欢迎转载,但未经作者同意必须保留此段声明,且在文章页面明显位置给出原文连接。

 浙公网安备 33010602011771号