Linux性能优化实战学习笔记:第十七讲
问题 1: 使用 perf 工具时,看到的是 16 进制地址而不是函数名
1、分析过程
在 CentOS 系统中,使用 perf 工具看不到函数名,只能看到一些 16 进制格式的函数地址。
其实,只要你观察一下 perf 界面最下面的那一行,就会发现一个警告信息Failed to open /opt/bitnami/php/lib/php/extensions/opcache.so, continuing without symbol
这说明,perf 找不到待分析进程依赖的库。当然,实际上这个案例中有很多依赖库都找不到,只不过,perf 工具本身只在最后一行显示警告信息
这个问题,其实也是在分析 Docker 容器应用时,我们经常碰到的一个问题,因为容器应用依赖的库都在镜像里面。
方案一:在容器外面构建相同路径的依赖库
这种方法从原理上可行,但是我并不推荐,一方面是因为找出这些依赖库比较麻烦,更重要的是构建这些路径,会污染容器主机的环境。
方案二:在容器内部运行 perf
不过,这需要容器运行在特权模式下,但实际的应用程序往只以普通容器的方式运行。所以,容器内部一般没有权限执行 perf 分析。
比方说,如果你在普通容器内部运行 perf record,你将会看到下面这个错误提示:
perf_4.9 record -a -g
perf_event_open(..., PERF_FLAG_FD_CLOEXEC) failed with unexpected error 1 (Operation not permitted)
perf_event_open(..., 0) failed unexpectedly with error 1 (Operation not permitted)
当然,其实你还可以通过配置 /proc/sys/kernel/perf_event_paranoid 许非特权用户执行 perf 事件分析。
方案三:指定符号路径为容器文件系统的路径
比如对于第 05 讲的应用,你可以执行下面这个命令:
mkdir /tmp/foo
$ PID=$(docker inspect --format {{.State.Pid}} phpfpm)
$ bindfs /proc/$PID/root /tmp/foo
$ perf report --symfs /tmp/foo

# 使用完成后不要忘记解除绑定
$ umount /tmp/foo/
不过这里要注意,bindfs 这个工具需要你额外安装。bindfs 的基本功能是实现目录绑定(类似于mount --bind),这里需要你安装的是1.13.10 版本(这也是它的最新发布版)。
如果你安装的是旧版本,你可以到 GitHub上面下载源码,然后编译安装。https://github.com/mpartel/bindfs
方案四,在容器外面把分析纪录保存下来,再去容器里查看结果这样,库和符号的路径也就都对了。
1、先运行 perf record -g -p < pid>,执行一会儿(比如 15 秒)后,按 Ctrl+C 停止。
2、然后,把生成的 perf.data 文件,拷贝到容器里面来分析
docker cp perf.data phpfpm:/tmp
$ docker exec -i -t phpfpm bash
3、接下来,在容器的 bash 中继续运行下面的命令,安装perf 并使用 perf report 查看报告:
cd /tmp/
$ apt-get update && apt-get install -y linux-tools linux-perf procps
$ perf_4.9 report
首先是 perf 工具的版本问题。在最后一步中,我们运行的工具是容器内部安装的版本 perf_4.9,而不是普通的perf 命令。这是因为, perf 命令实际上是一个
软连接,会跟内核的版本进行匹配,但镜像里安装的 perf 版本跟虚拟机的内核版本有可能并不一致
另外,php-fpm 镜像是基于 Debian 系统的所以安装 perf 工具的命令,跟 Ubuntu 也并不完也并不完全一样。比如, Ubuntu 上的安装方法是下面这样
apt-get install -y linux-tools-common linux-tools-generic linux-tools-$(uname -r))
而在 php-fpm 容器里,你应该执行下面的命令来安装安装 perf:
apt-get install -y linux-perf
当你按照前面这几种方法操作后,你就可以在容器内部看到 sqrsqrt 的堆栈
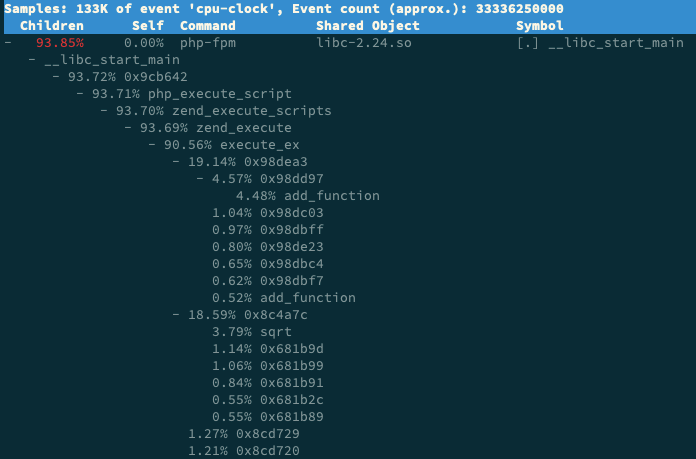
事实上,抛开我们的案例来说,即使是在非容器化的应用中,你也可能会碰到这个问题。假如你的应用程序在编译时
使用 strip 删除了 ELF 二进制文件的符号表,那么你同样也只能看到函数的地址。
问题 2:如何用 perf 工具分析 Java 程序
像是 Java 这种通过 JVM 来运行的应用程序,运行堆栈用的都是 JVM 内置的函数和堆栈管理。所以,从系统层面你只能看到 JVM 的函数堆栈,
perf_events 实际上已经支持了 JIT,但还需要一个 /tmp/perf-PID.map 文件,来进行符号翻译。当然,开源项目 perf-map-agent 可以帮你生成这符号表
此外,为了生成全部调用栈,你还需要开启 JDK 的选项-XX:+PreserveFramePointer。因为这里涉及到大量的 Java 知识,我就不再详细展开了。如果你的应用刚好基于 Java ,那么你可以参考 NETFLIX 的技术博客链接为
https://medium.com/netflix-techblogjava-in-flames-e763b3d32166
问题 3:为什么 perf 的报告中,很多符号都不显示调用栈
1、man perf-report 命令,找到 -g 参数的说明
-g, --call-graph=<print_type,threshold[,print_limit],order,sort_key[,branch],value>
Display call chains using type, min percent threshold, print limit, call order, sort key, optional branch and value. Note that
ordering is not fixed so any parameter can be given in an arbitrary order. One exception is the print_limit which should be
preceded by threshold.

print_type can be either:
- flat: single column, linear exposure of call chains.
- graph: use a graph tree, displaying absolute overhead rates. (default)
- fractal: like graph, but displays relative rates. Each branch of
the tree is considered as a new profiled object.
- folded: call chains are displayed in a line, separated by semicolons
- none: disable call chain display.

threshold is a percentage value which specifies a minimum percent to be
included in the output call graph. Default is 0.5 (%).

print_limit is only applied when stdio interface is used. It's to limit
number of call graph entries in a single hist entry. Note that it needs
to be given after threshold (but not necessarily consecutive).
Default is 0 (unlimited).

order can be either:
- callee: callee based call graph.
- caller: inverted caller based call graph.
Default is 'caller' when --children is used, otherwise 'callee'.

sort_key can be:
- function: compare on functions (default)
- address: compare on individual code addresses
- srcline: compare on source filename and line number

branch can be:
- branch: include last branch information in callgraph when available.
Usually more convenient to use --branch-history for this.

value can be:
- percent: diplay overhead percent (default)
- period: display event period
- count: display event count
通过这个说明可以看到,-g 选项等同于 --call-graph,它的参数是后面那些被逗号隔开的选项,意思分别是输出类型、最小阈值、输出限制、排序方法、排序关键词分支以及值的类型。
我们可以看到,这里默认的参数是 graph,0.5,callcaller,function,percent,具体含义文档中都有详细讲解,这里我就不再重复了。
2、调整阀值
perf report -g graph,0.3
3、swapper 为什么会特别高?
它只在系统初始化时创建 init 进程,之后它就成了一个最低优先级的空闲任务。也就是说,当 CPU 上没有其他任务运行时,就会执行 swapper 。所以,你可以称它为“空闲任务”。
展开它的调用栈,你会看到, swapper 时钟事件都耗费在了 do_idle 上,也就是在执行空闲任务。
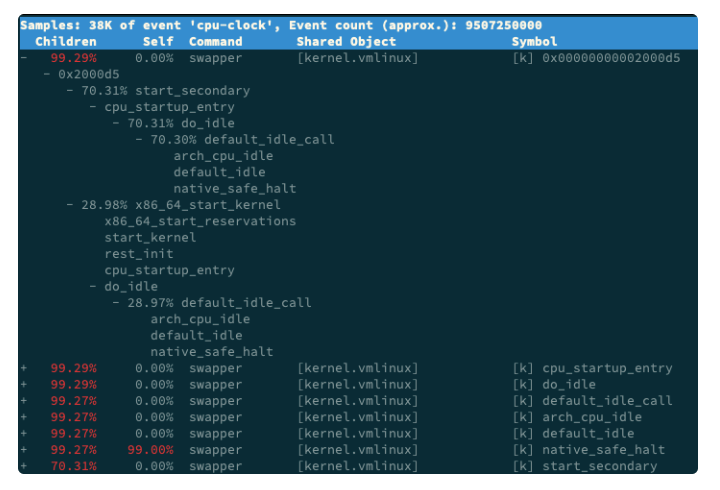
因为在多任务系统中,次数多的事件,不一定就是性能瓶颈。所以,只观察到一个大数值,并不能说明什么问题。具体有没有瓶颈,还需要你观测多个方面的多个标,
来交叉验证。这也是我在套路篇中不断强调的一点。
4、关于 Children 和 Self 的含义
Self 是最后一列的符号(可以理解为函数)本身所占比例;
Children 是这个符号调用的其他符号(可以理解为子函数,包括直接和间接调用)占用的比例之和。
perf 这种动态追踪工具,会给系统带来一定的性能损失。
vmstat、pidstat 这些直接读取 proc 系统来获取指标的工具,不会带来性能损失。
问题 5:性能优化书籍和参考资料推荐
书籍:《性能之巅:洞悉系统、企业与云计算》
网站:http://www.brendangregg.com/linuxperf.html

 浙公网安备 33010602011771号