Linux性能优化实战学习笔记:第六讲1
一、环境准备
1、安装软件包
终端1
机器配置:2 CPU,8GB 内存 预先安装 docker、sysstat、perf等工具
[root@luoahong ~]# docker -v
Docker version 18.09.1, build 4c52b90
[root@luoahong ~]# rpm -qa|grep sysstat
sysstat-12.1.2-1.x86_64
终端2
机器配置:1 CPU,2GB 内存 预先安装ab 等工具
[root@nfs ~]#yum -y install httpd-tools
[root@nfs ~]# ab -V
This is ApacheBench, Version 2.3 <$Revision: 1430300 $>
Copyright 1996 Adam Twiss, Zeus Technology Ltd, http://www.zeustech.net/
Licensed to The Apache Software Foundation, http://www.apache.org/
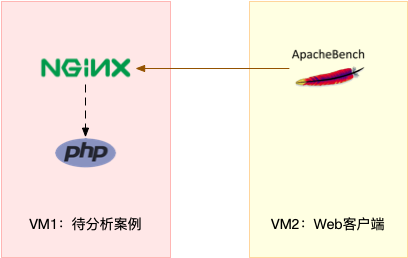
2、实战拓谱图
二、操作和分析
1、发现问题
首先在第一个终端执行的命令来运行Nnginx和PHP应用
$ docker run --name nginx -p 10000:80 -itd feisky/nginx
$ docker run --name phpfpm -itd --network container:nginx feisky/php-fpm
第二个终端测试确认Nnginx已经正常启动
[root@nfs ~]# curl http://192.168.118.97:10000
It works!
第二个终端测试Nnginx服务的性能
# 并发 10 个请求测试 Nginx 性能,总共测试 100 个请求
[root@nfs ~]# ab -c 10 -n 100 http://192.168.118.97:10000/
......
Requests per second: 24.07 [#/sec] (mean)
......
第二个终端测试Nnginx服务的性能加大压力测试
# 并发 10000个请求测试 Nginx 性能,总共测试 100 个请求
[root@nfs ~]# ab -c 10 -n 10000 http://192.168.118.97:10000/
......
Requests per second: 24.07 [#/sec] (mean)
......
top查看终端一

这里看一看到,系统中有几个php-fpm进程的CPU使用率加起来接近200%;而每个CPU的用户使用率已经超过了
98%,接近跑和,这样就可以确认,正是用户空间的PHP-fpm进程导致CPU使用率骤升
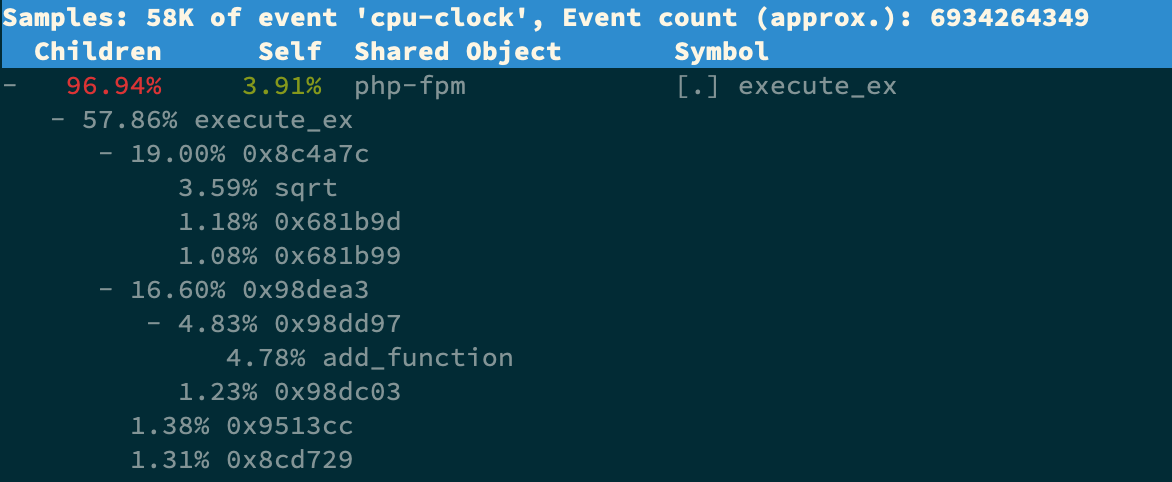
终端一运行perf 命令
按方向键切换到PHP-FPM,再按下回车键展开php-fpm的调用关系,你会发现,调用关系最终到了sqrt 和 add_function。看来,我们需要从这两个函数入手了
2、解决问题
我们拷贝出 Nginx 应用的源码,看看是不是调用了这两个函:
# 从容器 phpfpm 中将 PHP 源码拷贝出来
$ docker cp phpfpm:/app .

# 使用 grep 查找函数调用
$ grep sqrt -r app/ # 找到了 sqrt 调用
app/index.php:  $x += sqrt($x);
$ grep add_function -r app/ # 没找到 add_function 调用,这其实是 PHP 内置函数
原来只有 sqrt 函数在 app/index.php 文件中调用了。那最后一步,我们就该看看这个文件的源码了:
cat app/index.php
<?php
// test only.
$x = 0.0001;
for ($i = 0; $i <= 1000000; $i++) {
  $x += sqrt($x);
}

echo "It works!"
测试代码没删除就直接发布应用了,为了方便你验证优化后的效果。我们修复好的应用打包成了一个
Docker 镜像,你可以在第一个终端中执行下面的命令来运行它
# 停止原来的应用
$ docker rm -f nginx phpfpm
# 运行优化后的应用
$ docker run --name nginx -p 10000:80 -itd feisky/nginx:cpu-fix
$ docker run --name phpfpm -itd --network container:nginx feisky/php-fpm:cpu-fix
终端二验证修复的效果
[root@nfs ~]#  ab -c 10 -n 10000 http://192.168.118.97:10000/
This is ApacheBench, Version 2.3 <$Revision: 1430300 $>
Copyright 1996 Adam Twiss, Zeus Technology Ltd, http://www.zeustech.net/
Licensed to The Apache Software Foundation, http://www.apache.org/

Benchmarking 192.168.118.97 (be patient)
Completed 1000 requests
Completed 2000 requests
Completed 3000 requests
Completed 4000 requests
Completed 5000 requests
Completed 6000 requests
Completed 7000 requests
Completed 8000 requests
Completed 9000 requests
Completed 10000 requests
Finished 10000 requests


Server Software:        nginx/1.15.6
Server Hostname:        192.168.118.97
Server Port:            10000

Document Path:          /
Document Length:        153 bytes

Concurrency Level:      10
Time taken for tests:   10.776 seconds
Complete requests:      10000
Failed requests:        992
   (Connect: 0, Receive: 0, Length: 992, Exceptions: 0)
Write errors:           0
Non-2xx responses:      9008
Total transferred:      2900048 bytes
HTML transferred:       1387152 bytes
Requests per second:    928.00 [#/sec] (mean)
Time per request:       10.776 [ms] (mean)
Time per request:       1.078 [ms] (mean, across all concurrent requests)
Transfer rate:          262.82 [Kbytes/sec] received
从这里你可以发现,现在美秒的平均请求数,已经从原来的24变成了928
三、执行perf top -g -p (php-fpm进程号),发现不了sqrt函数
1、故障现象
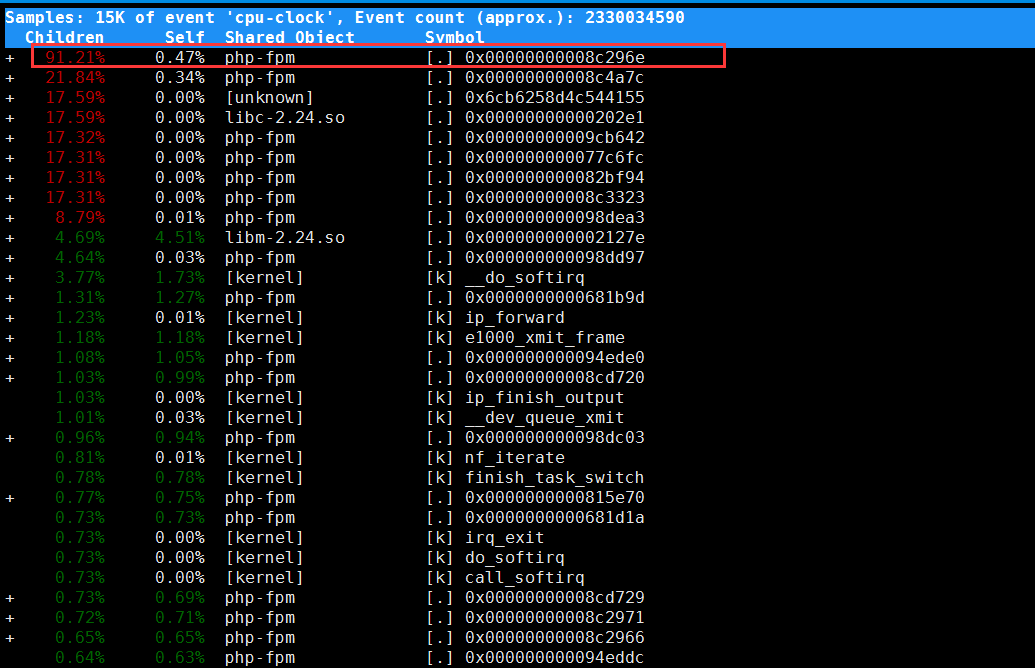
我的系统是centos7,上次实战用 perf top -g -p pid没有看到函数名称,只能看到一堆十六进制的东西,然后老师给了解决方法,我转述下:
分析:当没有看到函数名称,只看到了十六进制符号,下面有Failed to open /usr/lib/x86_64-linux-gnu/libxml2.so.2.9.4, continuing without symbols 这说明perf无法找到待分析进程所依赖的库。这里只显示了一个,但其实依赖的库还有很多。这个问题其实是在分析Docker容器应用时经常会碰到的一个问题,因为容器应用所依赖的库都在镜像里面。
2、解决办法
老师给了两个解决思路:
(1)在容器外面构建相同路径的依赖库。这种方法不推荐,一是因为找出这些依赖比较麻烦,更重要的是构建这些路径会污染虚拟机的环境。
(2)在容器外面把分析纪录保存下来,到容器里面再去查看结果,这样库和符号的路径就都是对的了。
操作:
(1)在Centos系统上运行 perf record -g -p <pid>,执行一会儿(比如15秒)按ctrl+c停止
(2)把生成的 perf.data(这个文件生成在执行命令的当前目录下,当然也可以通过查找它的路径 find | grep perf.data或 find / -name perf.data)文件拷贝到容器里面分析:
docker cp perf.data phpfpm:/tmp
docker exec -i -t phpfpm bash
$ cd /tmp/
$ apt-get update && apt-get install -y linux-perf linux-tools procps
$ perf_4.9 report
注意:最后运行的工具名字是容器内部安装的版本 perf_4.9,而不是 perf 命令,这是因为 perf 会去跟内核的版本进行匹配,但镜像里面安装的perf版本有可能跟虚拟机的内核版本不一致。
注意:上面的问题只是在centos系统中有问题,ubuntu上没有这个问题


 浙公网安备 33010602011771号