

Prometheus的Exporter详解
|
导航:这里主要是列出一个prometheus一些系统的学习过程,最后按照章节顺序查看,由于写作该文档经历了不同时期,所以在文中有时出现 的云环境不统一,但是学习具体使用方法即可,在最后的篇章,有一个完整的腾讯云的实战案例。 8.kube-state-metrics 和 metrics-server 13.Grafana简单用法 参考: https://prometheus.io/docs/prometheus/latest/configuration/configuration/#kubernetes_sd_config https://www.bookstack.cn/read/prometheus_practice/introduction-README.md |
本来在PromQL后讲解exporter,这样便于理解,但是这里先了解一下也不错。
1.Exporter是什么
广义上讲所有可以向Prometheus提供监控样本数据的程序都可以被称为一个Exporter。而Exporter的一个实例称为target,如下所示,Prometheus通过轮询的方式定期从这些target中获取样本数据:

1.1 Exporter的来源
从Exporter的来源上来讲,主要分为两类:
- 社区提供的
Prometheus社区提供了丰富的Exporter实现,涵盖了从基础设施,中间件以及网络等各个方面的监控功能。这些Exporter可以实现大部分通用的监控需求。下表列举一些社区中常用的Exporter:
| 范围 | 常用Exporter |
| 数据库 | MySQL Exporter, Redis Exporter, MongoDB Exporter, MSSQL Exporter等 |
| 硬件 | Apcupsd Exporter,IoT Edison Exporter, IPMI Exporter, Node Exporter等 |
| 消息队列 | Beanstalkd Exporter, Kafka Exporter, NSQ Exporter, RabbitMQ Exporter等 |
| 存储 | Ceph Exporter, Gluster Exporter, HDFS Exporter, ScaleIO Exporter等 |
| HTTP服务 | Apache Exporter, HAProxy Exporter, Nginx Exporter等 |
| API服务 | AWS ECS Exporter, Docker Cloud Exporter, Docker Hub Exporter, GitHub Exporter等 |
| 日志 | Fluentd Exporter, Grok Exporter等 |
| 监控系统 | Collectd Exporter, Graphite Exporter, InfluxDB Exporter, Nagios Exporter, SNMP Exporter等 |
| 其它 | Blockbox Exporter, JIRA Exporter, Jenkins Exporter, Confluence Exporter等 |
- 用户自定义的
除了直接使用社区提供的Exporter程序以外,用户还可以基于Prometheus提供的Client Library创建自己的Exporter程序,目前Promthues社区官方提供了对以下编程语言的支持:Go、Java/Scala、Python、Ruby。同时还有第三方实现的如:Bash、C++、Common Lisp、Erlang,、Haskeel、Lua、Node.js、PHP、Rust等。
1.2 Exporter的运行方式
从Exporter的运行方式上来讲,又可以分为:
独立使用的
以我们已经使用过的Node Exporter为例,由于操作系统本身并不直接支持Prometheus,同时用户也无法通过直接从操作系统层面上提供对Prometheus的支持。因此,用户只能通过独立运行一个程序的方式,通过操作系统提供的相关接口,将系统的运行状态数据转换为可供Prometheus读取的监控数据。 除了Node Exporter以外,比如MySQL Exporter、Redis Exporter等都是通过这种方式实现的。 这些Exporter程序扮演了一个中间代理人的角色。
集成到应用中的
为了能够更好的监控系统的内部运行状态,有些开源项目如Kubernetes,ETCD等直接在代码中使用了Prometheus的Client Library,提供了对Prometheus的直接支持。这种方式打破的监控的界限,让应用程序可以直接将内部的运行状态暴露给Prometheus,适合于一些需要更多自定义监控指标需求的项目。
1.3 Exporter规范
所有的Exporter程序都需要按照Prometheus的规范,返回监控的样本数据。以Node Exporter为例,当访问/metrics地址时会返回以下内容:
# HELP node_cpu Seconds the cpus spent in each mode.
# TYPE node_cpu counter
node_cpu{cpu="cpu0",mode="idle"} 362812.7890625
# HELP node_load1 1m load average.
# TYPE node_load1 gauge
node_load1 3.0703125
这是一种基于文本的格式规范,在Prometheus 2.0之前的版本还支持Protocol buffer规范。相比于Protocol buffer文本具有更好的可读性,以及跨平台性。Prometheus 2.0的版本也已经不再支持Protocol buffer,这里就不对Protocol buffer规范做详细的阐述。
Exporter返回的样本数据,主要由三个部分组成:样本的一般注释信息(HELP),样本的类型注释信息(TYPE)和样本。Prometheus会对Exporter响应的内容逐行解析:
如果当前行以# HELP开始,Prometheus将会按照以下规则对内容进行解析,得到当前的指标名称以及相应的说明信息:
# HELP <metrics_name> <doc_string>
如果当前行以# TYPE开始,Prometheus会按照以下规则对内容进行解析,得到当前的指标名称以及指标类型:
# TYPE <metrics_name> <metrics_type>
TYPE注释行必须出现在指标的第一个样本之前。如果没有明确的指标类型需要返回为untyped。 除了# 开头的所有行都会被视为是监控样本数据。 每一行样本需要满足以下格式规范:
metric_name [
  "{" label_name "=" `"` label_value `"` { "," label_name "=" `"` label_value `"` } [ "," ] "}"
] value [ timestamp ]
其中metric_name和label_name必须遵循PromQL的格式规范要求。value是一个float格式的数据,timestamp的类型为int64(从1970-01-01 00:00:00以来的毫秒数),timestamp为可选默认为当前时间。具有相同metric_name的样本必须按照一个组的形式排列,并且每一行必须是唯一的指标名称和标签键值对组合。
需要特别注意的是对于histogram和summary类型的样本。需要按照以下约定返回样本数据:
- 类型为summary或者histogram的指标x,该指标所有样本的值的总和需要使用一个单独的x_sum指标表示。
- 类型为summary或者histogram的指标x,该指标所有样本的总数需要使用一个单独的x_count指标表示。
- 对于类型为summary的指标x,其不同分位数quantile所代表的样本,需要使用单独的x{quantile="y"}表示。
- 对于类型histogram的指标x为了表示其样本的分布情况,每一个分布需要使用x_bucket{le="y"}表示,其中y为当前分布的上位数。同时必须包含一个样本x_bucket{le="+Inf"},并且其样本值必须和x_count相同。
- 对于histogram和summary的样本,必须按照分位数quantile和分布le的值的递增顺序排序。
以下是类型为histogram和summary的样本输出示例:
# A histogram, which has a pretty complex representation in the text format:
# HELP http_request_duration_seconds A histogram of the request duration.
# TYPE http_request_duration_seconds histogram
http_request_duration_seconds_bucket{le="0.05"} 24054
http_request_duration_seconds_bucket{le="0.1"} 33444
http_request_duration_seconds_bucket{le="0.2"} 100392
http_request_duration_seconds_bucket{le="+Inf"} 144320
http_request_duration_seconds_sum 53423
http_request_duration_seconds_count 144320

# Finally a summary, which has a complex representation, too:
# HELP rpc_duration_seconds A summary of the RPC duration in seconds.
# TYPE rpc_duration_seconds summary
rpc_duration_seconds{quantile="0.01"} 3102
rpc_duration_seconds{quantile="0.05"} 3272
rpc_duration_seconds{quantile="0.5"} 4773
rpc_duration_seconds_sum 1.7560473e+07
rpc_duration_seconds_count 2693
对于某些Prometheus还没有提供支持的编程语言,用户只需要按照以上规范返回响应的文本数据即可。
1.4 指定样本格式的版本
在Exporter响应的HTTP头信息中,可以通过Content-Type指定特定的规范版本,例如:
HTTP/1.1 200 OK
Content-Encoding: gzip
Content-Length: 2906
Content-Type: text/plain; version=0.0.4
Date: Sat, 17 Mar 2018 08:47:06 GMT
其中version用于指定Text-based的格式版本,当没有指定版本的时候,默认使用最新格式规范的版本。同时HTTP响应头还需要指定压缩格式为gzip。
2.容器监控:cAdvisor
后面还是会详细讲解cAdivisor,这里只是做一个简单介绍
Docker是一个开源的应用容器引擎,让开发者可以打包他们的应用以及依赖包到一个可移植的容器中,然后发布到任何流行的Linux/Windows/Mac机器上。容器镜像正成为一个新的标准化软件交付方式。
例如,可以通过以下命令快速在本地启动一个Nginx服务:
docker run -itd nginx
为了能够获取到Docker容器的运行状态,用户可以通过Docker的stats命令获取到当前主机上运行容器的统计信息,可以查看容器的CPU利用率、内存使用量、网络IO总量以及磁盘IO总量等信息。
$ docker stats
CONTAINER           CPU %               MEM USAGE / LIMIT     MEM %               NET I/O             BLOCK I/O           PIDS
9a1648bec3b2        0.30%               196KiB / 3.855GiB     0.00%               828B / 0B           827kB / 0B          1
除了使用命令以外,用户还可以通过Docker提供的HTTP API查看容器详细的监控统计信息。
2.1 使用CAdvisor
CAdvisor是Google开源的一款用于展示和分析容器运行状态的可视化工具。通过在主机上运行CAdvisor用户可以轻松的获取到当前主机上容器的运行统计信息,并以图表的形式向用户展示。
在本地运行CAdvisor也非常简单,直接运行一下命令即可:
docker run \
  --volume=/:/rootfs:ro \
  --volume=/var/run:/var/run:rw \
  --volume=/sys:/sys:ro \
  --volume=/var/lib/docker/:/var/lib/docker:ro \
  --publish=8080:8080 \
  --detach=true \
  --name=cadvisor \
  google/cadvisor:latest
通过访问http://localhost:8080可以查看,当前主机上容器的运行状态,如下所示:
CAdvisor是一个简单易用的工具,相比于使用Docker命令行工具,用户不用再登录到服务器中即可以可视化图表的形式查看主机上所有容器的运行状态。
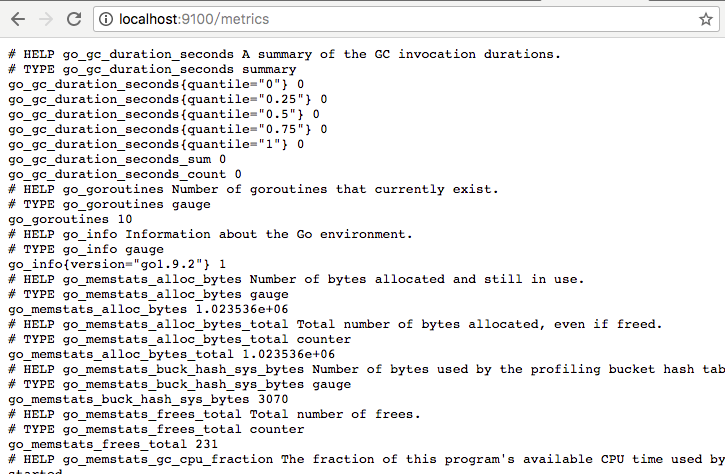
而在多主机的情况下,在所有节点上运行一个CAdvisor再通过各自的UI查看监控信息显然不太方便,同时CAdvisor默认只保存2分钟的监控数据。好消息是CAdvisor已经内置了对Prometheus的支持。访问http://localhost:8080/metrics即可获取到标准的Prometheus监控样本输出:
# HELP cadvisor_version_info A metric with a constant '1' value labeled by kernel version, OS version, docker version, cadvisor version & cadvisor revision.
# TYPE cadvisor_version_info gauge
cadvisor_version_info{cadvisorRevision="1e567c2",cadvisorVersion="v0.28.3",dockerVersion="17.09.1-ce",kernelVersion="4.9.49-moby",osVersion="Alpine Linux v3.4"} 1
# HELP container_cpu_load_average_10s Value of container cpu load average over the last 10 seconds.
# TYPE container_cpu_load_average_10s gauge
container_cpu_load_average_10s{container_label_maintainer="",id="/",image="",name=""} 0
container_cpu_load_average_10s{container_label_maintainer="",id="/docker",image="",name=""} 0
container_cpu_load_average_10s{container_label_maintainer="",id="/docker/15535a1e09b3a307b46d90400423d5b262ec84dc55b91ca9e7dd886f4f764ab3",image="busybox",name="lucid_shaw"} 0
container_cpu_load_average_10s{container_label_maintainer="",id="/docker/46750749b97bae47921d49dccdf9011b503e954312b8cffdec6268c249afa2dd",image="google/cadvisor:latest",name="cadvisor"} 0
container_cpu_load_average_10s{container_label_maintainer="NGINX Docker Maintainers <docker-maint@nginx.com>",id="/docker/f51fd4d4f410965d3a0fd7e9f3250218911c1505e12960fb6dd7b889e75fc114",image="nginx",name="confident_brattain"} 0
下面表格中列举了一些CAdvisor中获取到的典型监控指标:
| 指标名称 | 类型 | 含义 |
| container_cpu_load_average_10s | gauge | 过去10秒容器CPU的平均负载 |
| container_cpu_usage_seconds_total | counter | 容器在每个CPU内核上的累积占用时间 (单位:秒) |
| container_cpu_system_seconds_total | counter | System CPU累积占用时间(单位:秒) |
| container_cpu_user_seconds_total | counter | User CPU累积占用时间(单位:秒) |
| container_fs_usage_bytes | gauge | 容器中文件系统的使用量(单位:字节) |
| container_fs_limit_bytes | gauge | 容器可以使用的文件系统总量(单位:字节) |
| container_fs_reads_bytes_total | counter | 容器累积读取数据的总量(单位:字节) |
| container_fs_writes_bytes_total | counter | 容器累积写入数据的总量(单位:字节) |
| container_memory_max_usage_bytes | gauge | 容器的最大内存使用量(单位:字节) |
| container_memory_usage_bytes | gauge | 容器当前的内存使用量(单位:字节 |
| container_spec_memory_limit_bytes | gauge | 容器的内存使用量限制 |
| machine_memory_bytes | gauge | 当前主机的内存总量 |
| container_network_receive_bytes_total | counter | 容器网络累积接收数据总量(单位:字节) |
| container_network_transmit_bytes_total | counter | 容器网络累积传输数据总量(单位:字节) |
2.2 与Prometheus集成
修改/etc/prometheus/prometheus.yml,将cAdvisor添加监控数据采集任务目标当中:
- job_name: cadvisor
  static_configs:
  - targets:
    - localhost:8080
启动Prometheus服务:
prometheus --config.file=/etc/prometheus/prometheus.yml --storage.tsdb.path=/data/prometheus
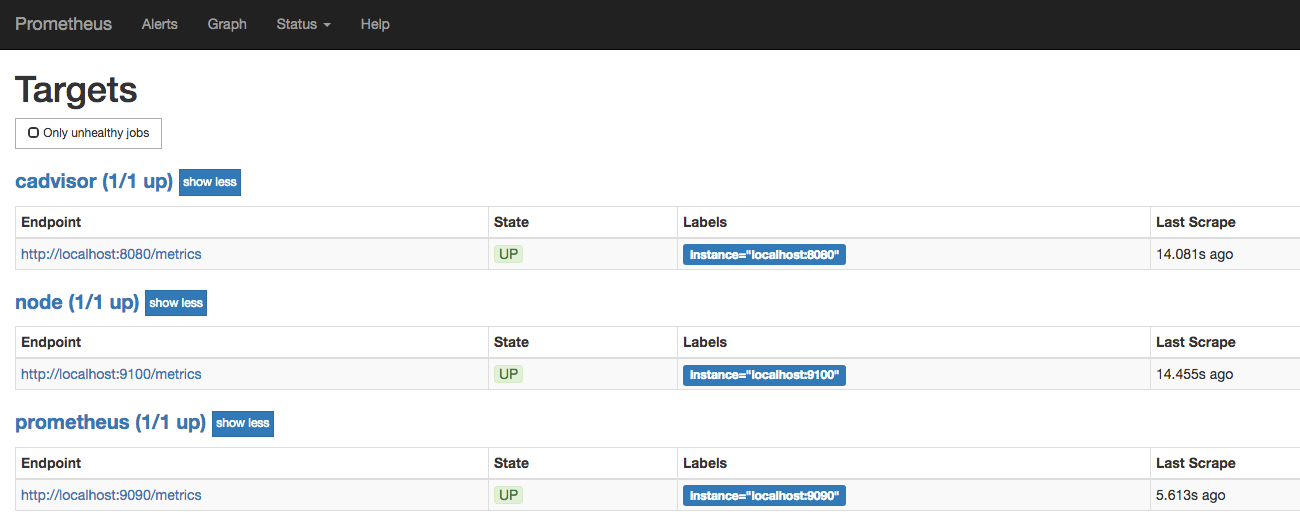
启动完成后,可以在Prometheus UI中查看到当前所有的Target状态:
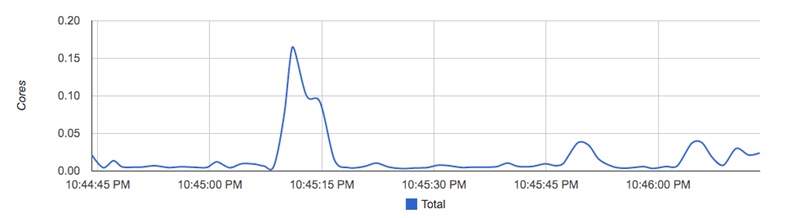
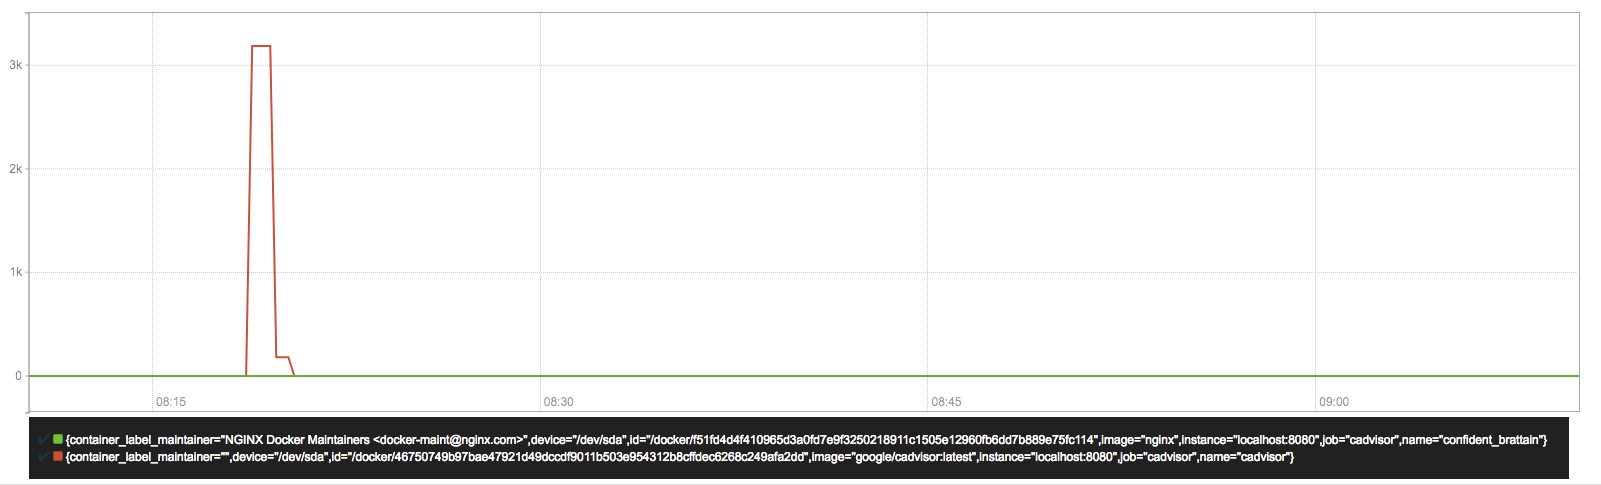
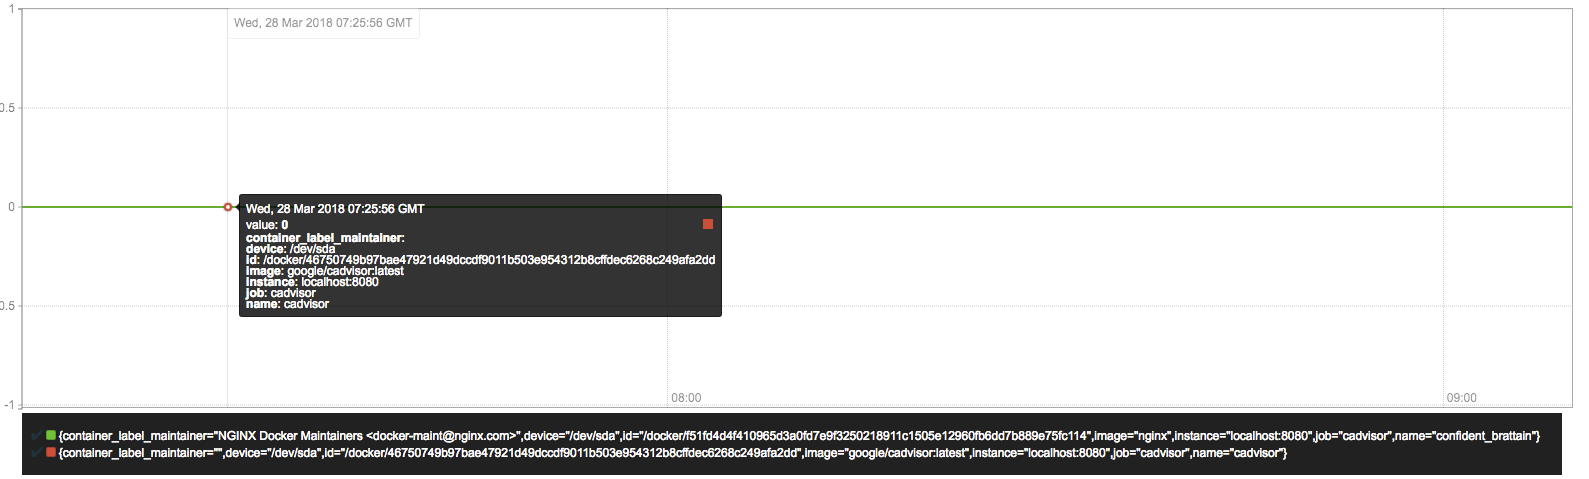
当能够正常采集到cAdvisor的样本数据后,可以通过以下表达式计算容器的CPU使用率:
sum(irate(container_cpu_usage_seconds_total{image!=""}[1m])) without (cpu)

容器CPU使用率
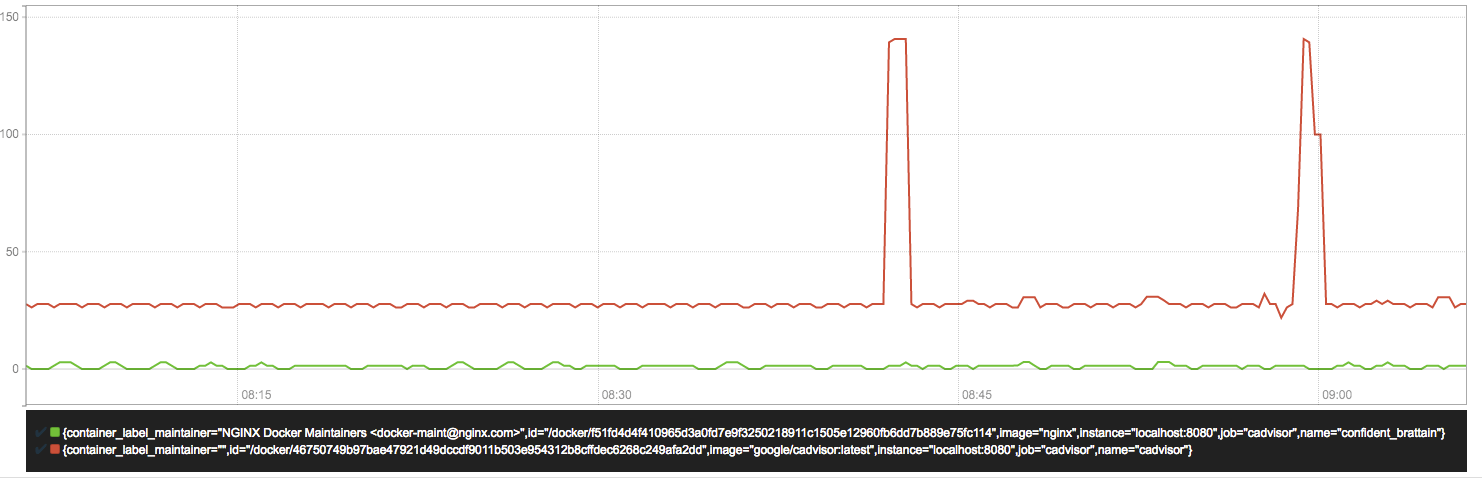
查询容器内存使用量(单位:字节):
container_memory_usage_bytes{image!=""}
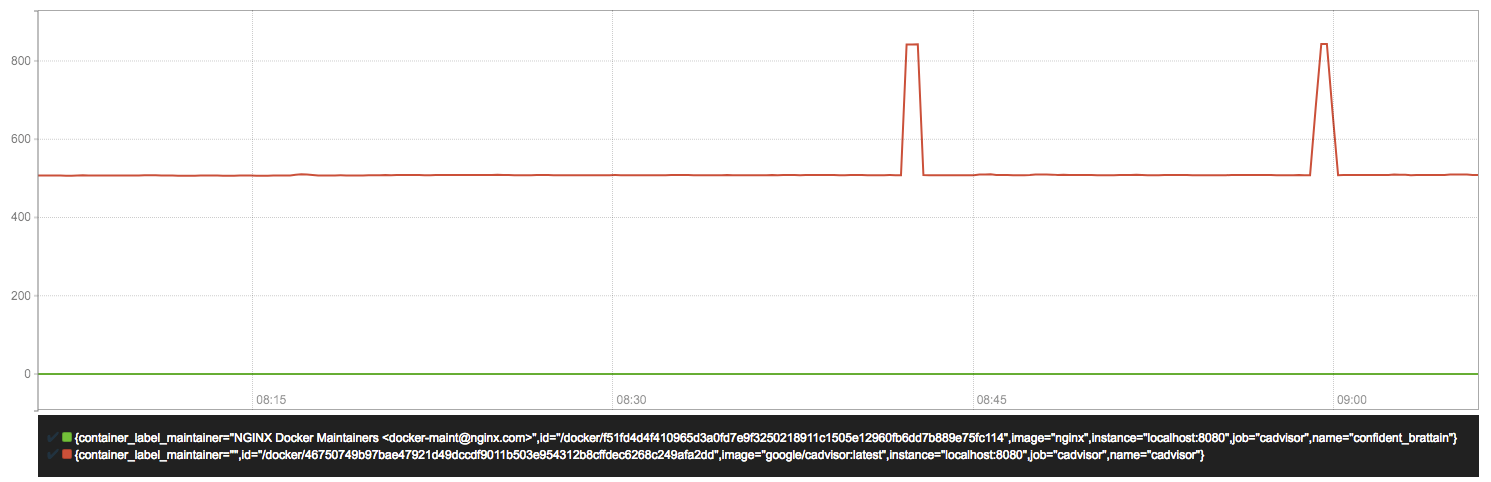
查询容器网络接收量速率(单位:字节/秒):
sum(rate(container_network_receive_bytes_total{image!=""}[1m])) without (interface)
容器网络接收量字节/秒
查询容器网络传输量速率(单位:字节/秒):
sum(rate(container_network_transmit_bytes_total{image!=""}[1m])) without (interface)
容器网络传输量 字节/秒
查询容器文件系统读取速率(单位:字节/秒):
sum(rate(container_fs_reads_bytes_total{image!=""}[1m])) without (device)
容器文件系统读取速率字节/秒
查询容器文件系统写入速率(单位:字节/秒):
sum(rate(container_fs_writes_bytes_total{image!=""}[1m])) without (device)
容器文件系统写入速率 字节/秒
3.Node Exporter
3.1 安装node exporter
在Prometheus的架构设计中,Prometheus Server并不直接服务监控特定的目标,其主要任务负责数据的收集,存储并且对外提供数据查询支持。因此为了能够能够监控到某些东西,如主机的CPU使用率,我们需要使用到Exporter。Prometheus周期性的从Exporter暴露的HTTP服务地址(通常是/metrics)拉取监控样本数据。
从上面的描述中可以看出Exporter可以是一个相对开放的概念,其可以是一个独立运行的程序独立于监控目标以外,也可以是直接内置在监控目标中。只要能够向Prometheus提供标准格式的监控样本数据即可。
这里为了能够采集到主机的运行指标如CPU, 内存,磁盘等信息。我们可以使用Node Exporter。
Node Exporter同样采用Golang编写,并且不存在任何的第三方依赖,只需要下载,解压即可运行。可以从https://prometheus.io/download/获取最新的node exporter版本的二进制包。
curl -OL https://github.com/prometheus/node_exporter/releases/download/v0.15.2/node_exporter-0.15.2.darwin-amd64.tar.gz
tar -xzf node_exporter-0.15.2.darwin-amd64.tar.gz
运行node exporter:
cd node_exporter-0.15.2.darwin-amd64
cp node_exporter-0.15.2.darwin-amd64/node_exporter /usr/local/bin/
node_exporter
启动成功后,可以看到以下输出:
INFO[0000] Listening on :9100 source="node_exporter.go:76"
3.2 初始Node Exporter监控指标
访问http://localhost:9100/metrics,可以看到当前node exporter获取到的当前主机的所有监控数据,如下所示:
每一个监控指标之前都会有一段类似于如下形式的信息:
# HELP node_cpu Seconds the cpus spent in each mode.
# TYPE node_cpu counter
node_cpu{cpu="cpu0",mode="idle"} 362812.7890625
# HELP node_load1 1m load average.
# TYPE node_load1 gauge
node_load1 3.0703125
其中HELP用于解释当前指标的含义,TYPE则说明当前指标的数据类型。在上面的例子中node_cpu的注释表明当前指标是cpu0上idle进程占用CPU的总时间,CPU占用时间是一个只增不减的度量指标,从类型中也可以看出node_cpu的数据类型是计数器(counter),与该指标的实际含义一致。又例如node_load1该指标反映了当前主机在最近一分钟以内的负载情况,系统的负载情况会随系统资源的使用而变化,因此node_load1反映的是当前状态,数据可能增加也可能减少,从注释中可以看出当前指标类型为仪表盘(gauge),与指标反映的实际含义一致。
除了这些以外,在当前页面中根据物理主机系统的不同,你还可能看到如下监控指标:
-
- node_boot_time:系统启动时间
- node_cpu:系统CPU使用量
- nodedisk*:磁盘IO
- nodefilesystem*:文件系统用量
- node_load1:系统负载
- nodememeory*:内存使用量
- nodenetwork*:网络带宽
- node_time:当前系统时间
- go_*:node exporter中go相关指标
- process_*:node exporter自身进程相关运行指标
3.3 从Node Exporter收集监控数据
为了能够让Prometheus Server能够从当前node exporter获取到监控数据,这里需要修改Prometheus配置文件。编辑prometheus.yml并在scrape_configs节点下添加以下内容:
scrape_configs:
  - job_name: 'prometheus'
    static_configs:
      - targets: ['localhost:9090']
  # 采集node exporter监控数据
  - job_name: 'node'
    static_configs:
      - targets: ['localhost:9100']
重新启动Prometheus Server
访问http://localhost:9090,进入到Prometheus Server。如果输入“up”并且点击执行按钮以后,可以看到如下结果:
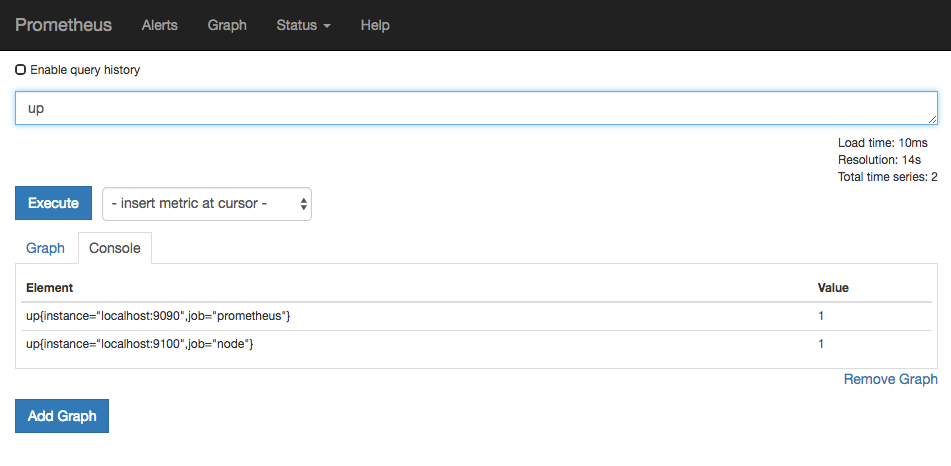
如果Prometheus能够正常从node exporter获取数据,则会看到以下结果:
up{instance="localhost:9090",job="prometheus"}    1
up{instance="localhost:9100",job="node"}    1
其中“1”表示正常,反之“0”则为异常。
3.4 Node Exporter 常用查询语句
收集到 node_exporter 的数据后,我们可以使用 PromQL 进行一些业务查询和监控,下面是一些比较常见的查询。
注意:以下查询均以单个节点作为例子,如果大家想查看所有节点,将 instance="xxx" 去掉即可。
CPU 使用率
100 - (avg by (instance) (irate(node_cpu{instance="xxx", mode="idle"}[5m])) * 100)
CPU各mode 占比率
avg by (instance, mode) (irate(node_cpu{instance="xxx"}[5m])) * 100
机器平均负载
node_load1{instance="xxx"} // 1分钟负载
node_load5{instance="xxx"} // 5分钟负载
node_load15{instance="xxx"} // 15分钟负载
内存使用率
100 - ((node_memory_MemFree{instance="xxx"}+node_memory_Cached{instance="xxx"}+node_memory_Buffers{instance="xxx"})/node_memory_MemTotal) * 100
磁盘使用率
100 - node_filesystem_free{instance="xxx",fstype!~"rootfs|selinuxfs|autofs|rpc_pipefs|tmpfs|udev|none|devpts|sysfs|debugfs|fuse.*"} / node_filesystem_size{instance="xxx",fstype!~"rootfs|selinuxfs|autofs|rpc_pipefs|tmpfs|udev|none|devpts|sysfs|debugfs|fuse.*"} * 100
或者你也可以直接使用 {fstype=”xxx”} 来指定想查看的磁盘信息
网络 IO
// 上行带宽
sum by (instance) (irate(node_network_receive_bytes{instance="xxx",device!~"bond.*?|lo"}[5m])/128)

// 下行带宽
sum by (instance) (irate(node_network_transmit_bytes{instance="xxx",device!~"bond.*?|lo"}[5m])/128)
网卡出/入包
// 入包量
sum by (instance) (rate(node_network_receive_bytes{instance="xxx",device!="lo"}[5m]))

// 出包量
sum by (instance) (rate(node_network_transmit_bytes{instance="xxx",device!="lo"}[5m]))
3.5 Node Exporter功能对照表
默认开启的功能
| 名称 | 说明 | 系统 |
| arp | 从/proc/net/arp中收集 ARP 统计信息 | Linux |
| conntrack | 从/proc/sys/net/netfilter/中收集 conntrack 统计信息 | Linux |
| cpu | 收集 cpu 统计信息 | Darwin, Dragonfly, FreeBSD, Linux |
| diskstats | 从/proc/diskstats中收集磁盘 I/O 统计信息 | Linux |
| edac | 错误检测与纠正统计信息 | Linux |
| entropy | 可用内核熵信息 | Linux |
| exec | execution 统计信息 | Dragonfly, FreeBSD |
| filefd | 从/proc/sys/fs/file-nr中收集文件描述符统计信息 | Linux |
| filesystem | 文件系统统计信息,例如磁盘已使用空间 | Darwin, Dragonfly, FreeBSD, Linux, OpenBSD |
| hwmon | 从/sys/class/hwmon/中收集监控器或传感器数据信息 | Linux |
| infiniband | 从InfiniBand 配置中收集网络统计信息 | Linux |
| loadavg | 收集系统负载信息 | Darwin, Dragonfly, FreeBSD, Linux, NetBSD, OpenBSD, Solaris |
| mdadm | 从/proc/mdstat中获取设备统计信息 | Linux |
| meminfo | 内存统计信息 | Darwin, Dragonfly, FreeBSD, Linux |
| netdev | 网口流量统计信息,单位 bytes | Darwin, Dragonfly, FreeBSD, Linux, OpenBSD |
| netstat | 从/proc/net/netstat收集网络统计数据,等同于 netstat -s | Linux |
| sockstat | 从/proc/net/sockstat中收集 socket 统计信息 | Linux |
| stat | 从/proc/stat中收集各种统计信息,包含系统启动时间,forks, 中断等 | Linux |
| textfile | 通过--collector.textfile.directory 参数指定本地文本收集路径,收集文本信息 | any |
| time | 系统当前时间 | any |
| uname | 通过uname系统调用, 获取系统信息 | any |
| vmstat | 从/proc/vmstat中收集统计信息 | Linux |
| wifi | 收集wifi设备相关统计数据 | Linux |
| xfs | 收集xfs运行时统计信息 | Linux (kernel 4.4+) |
| zfs | 收集zfs性能统计信息 | Linux |
默认关闭的功能
| 名称 | 说明 | 系统 |
| bonding | 收集系统配置以及激活的绑定网卡数量 | Linux |
| buddyinfo | 从/proc/buddyinfo中收集内存碎片统计信息 | Linux |
| devstat | 收集设备统计信息 | Dragonfly, FreeBSD |
| drbd | 收集远程镜像块设备(DRBD)统计信息 | Linux |
| interrupts | 收集更具体的中断统计信息 | Linux,OpenBSD |
| ipvs | 从/proc/net/ip_vs中收集 IPVS 状态信息,从/proc/net/ip_vs_stats获取统计信息 | Linux |
| ksmd | 从/sys/kernel/mm/ksm中获取内核和系统统计信息 | Linux |
| logind | 从logind中收集会话统计信息 | Linux |
| meminfo_numa | 从/proc/meminfo_numa中收集内存统计信息 | Linux |
| mountstats | 从/proc/self/mountstat中收集文件系统统计信息,包括 NFS客户端统计信息 | Linux |
| nfs | 从/proc/net/rpc/nfs中收集 NFS 统计信息,等同于nfsstat -c | Linux |
| qdisc | 收集队列推定统计信息 | Linux |
| runit | 收集runit状态信息 | any |
| supervisord | 收集supervisord状态信息 | any |
| systemd | 从systemd中收集设备系统状态信息 | Linux |
| tcpstat | 从/proc/net/tcp和/proc/net/tcp6收集 TCP 连接状态信息 | Linux |
注意:我们可以使用 --collectors.enabled 运行参数指定 node_exporter 收集的功能模块, 如果不指定,将使用默认模块。
4.Blackbox Exporter
在本章的前几个小节中我们主要介绍了Prometheus下如何进行白盒监控,我们监控主机的资源用量、容器的运行状态、数据库中间件的运行数据。 这些都是支持业务和服务的基础设施,通过白盒能够了解其内部的实际运行状态,通过对监控指标的观察能够预判可能出现的问题,从而对潜在的不确定因素进行优化。而从完整的监控逻辑的角度,除了大量的应用白盒监控以外,还应该添加适当的黑盒监控。黑盒监控即以用户的身份测试服务的外部可见性,常见的黑盒监控包括HTTP探针、TCP探针等用于检测站点或者服务的可访问性,以及访问效率等。
黑盒监控相较于白盒监控最大的不同在于黑盒监控是以故障为导向当故障发生时,黑盒监控能快速发现故障,而白盒监控则侧重于主动发现或者预测潜在的问题。一个完善的监控目标是要能够从白盒的角度发现潜在问题,能够在黑盒的角度快速发现已经发生的问题。
4.1 Blackbox Exporter简单使用方式
Blackbox Exporter是Prometheus社区提供的官方黑盒监控解决方案,其允许用户通过:HTTP、HTTPS、DNS、TCP以及ICMP的方式对网络进行探测。用户可以直接使用go get命令获取Blackbox Exporter源码并生成本地可执行文件:
go get prometheus/blackbox_exporter
运行Blackbox Exporter时,需要用户提供探针的配置信息,这些配置信息可能是一些自定义的HTTP头信息,也可能是探测时需要的一些TSL配置,也可能是探针本身的验证行为。在Blackbox Exporter每一个探针配置称为一个module,并且以YAML配置文件的形式提供给Blackbox Exporter。 每一个module主要包含以下配置内容,包括探针类型(prober)、验证访问超时时间(timeout)、以及当前探针的具体配置项:
  # 探针类型:http、 tcp、 dns、 icmp.
  prober: <prober_string>

  # 超时时间
  [ timeout: <duration> ]

  # 探针的详细配置,最多只能配置其中的一个
  [ http: <http_probe> ]
  [ tcp: <tcp_probe> ]
  [ dns: <dns_probe> ]
  [ icmp: <icmp_probe> ]
下面是一个简化的探针配置文件blockbox.yml,包含两个HTTP探针配置项:
modules:
  http_2xx:
    prober: http
    http:
      method: GET
  http_post_2xx:
    prober: http
    http:
      method: POST
通过运行以下命令,并指定使用的探针配置文件启动Blockbox Exporter实例:
blackbox_exporter --config.file=/etc/prometheus/blackbox.yml
启动成功后,就可以通过访问http://127.0.0.1:9115/probe?module=http_2xx&target=baidu.com对baidu.com进行探测。这里通过在URL中提供module参数指定了当前使用的探针,target参数指定探测目标,探针的探测结果通过Metrics的形式返回:
# HELP probe_dns_lookup_time_seconds Returns the time taken for probe dns lookup in seconds
# TYPE probe_dns_lookup_time_seconds gauge
probe_dns_lookup_time_seconds 0.011633673
# HELP probe_duration_seconds Returns how long the probe took to complete in seconds
# TYPE probe_duration_seconds gauge
probe_duration_seconds 0.117332275
# HELP probe_failed_due_to_regex Indicates if probe failed due to regex
# TYPE probe_failed_due_to_regex gauge
probe_failed_due_to_regex 0
# HELP probe_http_content_length Length of http content response
# TYPE probe_http_content_length gauge
probe_http_content_length 81
# HELP probe_http_duration_seconds Duration of http request by phase, summed over all redirects
# TYPE probe_http_duration_seconds gauge
probe_http_duration_seconds{phase="connect"} 0.055551141
probe_http_duration_seconds{phase="processing"} 0.049736019
probe_http_duration_seconds{phase="resolve"} 0.011633673
probe_http_duration_seconds{phase="tls"} 0
probe_http_duration_seconds{phase="transfer"} 3.8919e-05
# HELP probe_http_redirects The number of redirects
# TYPE probe_http_redirects gauge
probe_http_redirects 0
# HELP probe_http_ssl Indicates if SSL was used for the final redirect
# TYPE probe_http_ssl gauge
probe_http_ssl 0
# HELP probe_http_status_code Response HTTP status code
# TYPE probe_http_status_code gauge
probe_http_status_code 200
# HELP probe_http_version Returns the version of HTTP of the probe response
# TYPE probe_http_version gauge
probe_http_version 1.1
# HELP probe_ip_protocol Specifies whether probe ip protocol is IP4 or IP6
# TYPE probe_ip_protocol gauge
probe_ip_protocol 4
# HELP probe_success Displays whether or not the probe was a success
# TYPE probe_success gauge
probe_success 1
从返回的样本中,用户可以获取站点的DNS解析耗时、站点响应时间、HTTP响应状态码等等和站点访问质量相关的监控指标,从而帮助管理员主动的发现故障和问题。
4.2 与Prometheus集成
接下来,只需要在Prometheus下配置对Blockbox Exporter实例的采集任务即可。最直观的配置方式:
- job_name: baidu_http2xx_probe
  params:
    module:
    - http_2xx
    target:
    - baidu.com
  metrics_path: /probe
  static_configs:
  - targets:
    - 127.0.0.1:9115
- job_name: prometheus_http2xx_probe
  params:
    module:
    - http_2xx
    target:
    - prometheus.io
  metrics_path: /probe
  static_configs:
  - targets:
    - 127.0.0.1:9115
这里分别配置了名为baidu_http2x_probe和prometheus_http2xx_probe的采集任务,并且通过params指定使用的探针(module)以及探测目标(target)。
那问题就来了,假如我们有N个目标站点且都需要M种探测方式,那么Prometheus中将包含N * M个采集任务,从配置管理的角度来说显然是不可接受的。 在第7章的“服务发现与Relabel”小节,我们介绍了Prometheus的Relabeling能力,这里我们也可以采用Relabling的方式对这些配置进行简化,配置方式如下:
scrape_configs:
  - job_name: 'blackbox'
    metrics_path: /probe
    params:
      module: [http_2xx]
    static_configs:
      - targets:
        - http://prometheus.io    # Target to probe with http.
        - https://prometheus.io   # Target to probe with https.
        - http://example.com:8080 # Target to probe with http on port 8080.
    relabel_configs:
      - source_labels: [__address__]
        target_label: __param_target
      - source_labels: [__param_target]
        target_label: instance
      - target_label: __address__
        replacement: 127.0.0.1:9115
这里针对每一个探针服务(如http_2xx)定义一个采集任务,并且直接将任务的采集目标定义为我们需要探测的站点。在采集样本数据之前通过relabel_configs对采集任务进行动态设置。
- 第1步,根据Target实例的地址,写入__param_target标签中。__param_<name>形式的标签表示,在采集任务时会在请求目标地址中添加<name>参数,等同于params的设置;
- 第2步,获取__param_target的值,并覆写到instance标签中;
- 第3步,覆写Target实例的__address__标签值为BlockBox Exporter实例的访问地址。
通过以上3个relabel步骤,即可大大简化Prometheus任务配置的复杂度:
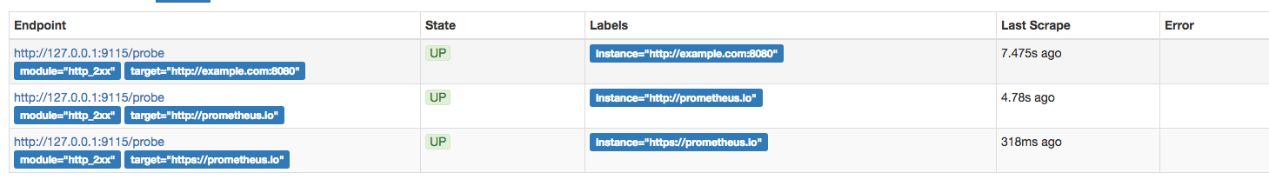
Blackbox Target实例
接下来,将详细介绍Blackbox中常用的HTTP探针使用方式
4.3 HTTP探针
HTTP探针是进行黑盒监控时最常用的探针之一,通过HTTP探针能够网站或者HTTP服务建立有效的监控,包括其本身的可用性,以及用户体验相关的如响应时间等等。除了能够在服务出现异常的时候及时报警,还能帮助系统管理员分析和优化网站体验。
在上一小节讲过,Blockbox Exporter中所有的探针均是以Module的信息进行配置。如下所示,配置了一个最简单的HTTP探针:
modules:
  http_2xx_example:
    prober: http
    http:
通过prober配置项指定探针类型。配置项http用于自定义探针的探测方式,这里有没对http配置项添加任何配置,表示完全使用HTTP探针的默认配置,该探针将使用HTTP GET的方式对目标服务进行探测,并且验证返回状态码是否为2XX,是则表示验证成功,否则失败。
自定义HTTP请求
HTTP服务通常会以不同的形式对外展现,有些可能就是一些简单的网页,而有些则可能是一些基于REST的API服务。 对于不同类型的HTTP的探测需要管理员能够对HTTP探针的行为进行更多的自定义设置,包括:HTTP请求方法、HTTP头信息、请求参数等。对于某些启用了安全认证的服务还需要能够对HTTP探测设置相应的Auth支持。对于HTTPS类型的服务还需要能够对证书进行自定义设置。
如下所示,这里通过method定义了探测时使用的请求方法,对于一些需要请求参数的服务,还可以通过headers定义相关的请求头信息,使用body定义请求内容:
http_post_2xx:
    prober: http
    timeout: 5s
    http:
      method: POST
      headers:
        Content-Type: application/json
      body: '{}'
如果HTTP服务启用了安全认证,Blockbox Exporter内置了对basic_auth的支持,可以直接设置相关的认证信息即可:
http_basic_auth_example:
    prober: http
    timeout: 5s
    http:
      method: POST
      headers:
        Host: "login.example.com"
      basic_auth:
        username: "username"
        password: "mysecret"
对于使用了Bear Token的服务也可以通过bearer_token配置项直接指定令牌字符串,或者通过bearer_token_file指定令牌文件。
对于一些启用了HTTPS的服务,但是需要自定义证书的服务,可以通过tls_config指定相关的证书信息:
http_custom_ca_example:
    prober: http
    http:
      method: GET
      tls_config:
        ca_file: "/certs/my_cert.crt"
自定义探针行为
在默认情况下HTTP探针只会对HTTP返回状态码进行校验,如果状态码为2XX(200 <= StatusCode < 300)则表示探测成功,并且探针返回的指标probe_success值为1。
如果用户需要指定HTTP返回状态码,或者对HTTP版本有特殊要求,如下所示,可以使用valid_http_versions和valid_status_codes进行定义:
 http_2xx_example:
    prober: http
    timeout: 5s
    http:
      valid_http_versions: ["HTTP/1.1", "HTTP/2"]
      valid_status_codes: []
默认情况下,Blockbox返回的样本数据中也会包含指标probe_http_ssl,用于表明当前探针是否使用了SSL:
# HELP probe_http_ssl Indicates if SSL was used for the final redirect
# TYPE probe_http_ssl gauge
probe_http_ssl 0
而如果用户对于HTTP服务是否启用SSL有强制的标准。则可以使用fail_if_ssl和fail_if_not_ssl进行配置。fail_if_ssl为true时,表示如果站点启用了SSL则探针失败,反之成功。fail_if_not_ssl刚好相反。
 http_2xx_example:
    prober: http
    timeout: 5s
    http:
      valid_status_codes: []
      method: GET
      no_follow_redirects: false
      fail_if_ssl: false
      fail_if_not_ssl: false
除了基于HTTP状态码,HTTP协议版本以及是否启用SSL作为控制探针探测行为成功与否的标准以外,还可以匹配HTTP服务的响应内容。使用fail_if_matches_regexp和fail_if_not_matches_regexp用户可以定义一组正则表达式,用于验证HTTP返回内容是否符合或者不符合正则表达式的内容。
 http_2xx_example:
    prober: http
    timeout: 5s
    http:
      method: GET
      fail_if_matches_regexp:
        - "Could not connect to database"
      fail_if_not_matches_regexp:
        - "Download the latest version here"
最后需要提醒的时,默认情况下HTTP探针会走IPV6的协议。在大多数情况下,可以使用preferred_ip_protocol=ip4强制通过IPV4的方式进行探测。在Bloackbox响应的监控样本中,也会通过指标probe_ip_protocol,表明当前的协议使用情况:
 # HELP probe_ip_protocol Specifies whether probe ip protocol is IP4 or IP6
# TYPE probe_ip_protocol gauge
probe_ip_protocol 6
除了支持对HTTP协议进行网络探测以外,Blackbox还支持对TCP、DNS、ICMP等其他网络协议,感兴趣的读者可以从Blackbox的Github项目中获取更多使用信息
4.4 Blackbox exporter线上部署
1.使用supervisord管理blackbox exporter
这里安装也比较简单,不需要自定义配置文件,并且使用supervisord管理,所以这里仅贴出supervisord的配置文件.
下载链接地址: https://prometheus.io/docs/instrumenting/exporters/
[program:blackbox_exporter]
command=/opt/blackbox_exporter/blackbox_exporter --config.file=/opt/blackbox_exporter/blackbox.yml
autostart=true
autorestart=true
startsecs=5
priority=1
stopasgroup=true
killasgroup=true
redirect_stderr         = true
stdout_logfile_maxbytes = 50MB
stdout_logfile=/var/log/supervisor/blackbox_exporter.log
2.监控web
监控web使用的是静态监控,所以主要关注prometheus的配置
- job_name: 'cn-gc-nginx01'
  metrics_path: /probe
  params:
    #prometheus的模块,有tcp_connect等等,http_2xx代表只有返回200,prometheus的监控值才是正常的,也就是返回200,prometheus才会显示1
    module: [http_2xx]
  static_configs:
    #要监控的url,一定不要是跳转或者404等,不然返回就不是200,那么就不正常
    - targets: ['10.1.1.1:80/admin#/login']
  relabel_configs:
    # 使用__address__源地址,覆盖__param_target的值
    - source_labels: [__address__]
      target_label: __param_target
    #把__address__源标签的值,替换成10.1.1.1:9115
    - target_label: __address__
      replacement: 10.1.1.1:9115
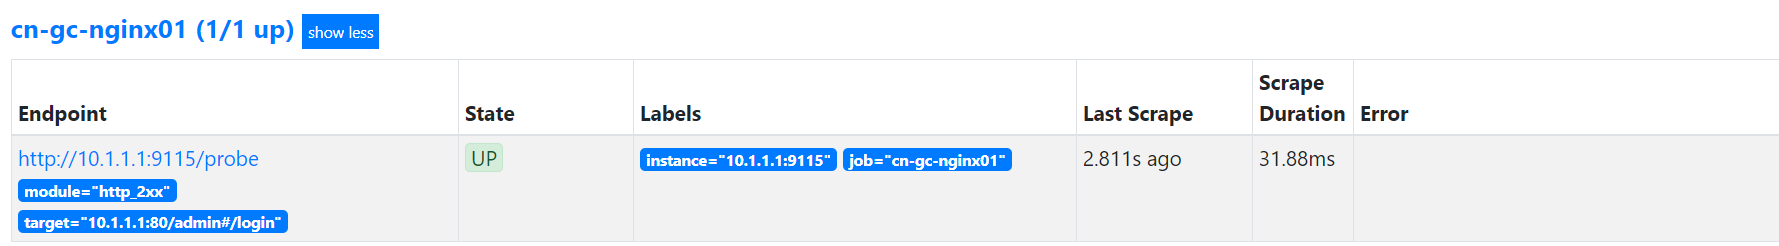
仔细观察一下标签,图中左边显示的target就是__param_target,这个就是要去访问监控的地址,而instance是blackbox,通过blackbox的插件去访问target的状态信息的,然后我们从blackbox获取信息,千万不能搞混.
所以就是需要2个地址一个是target被监控地址,一个是数据来源地址(重要)
3.监控TCP端口
本章节会使用到consul自动发现的知识,如果有需要,可以参考本文档的consul自动发现章节.
由于web监控的机器比较少,所以采用了静态配置,但是tcp端口可能机器会有多台,所以这里使用consul自动发现,这里就需要关注consul的主机json配置以及prometheus配置.
prometheus
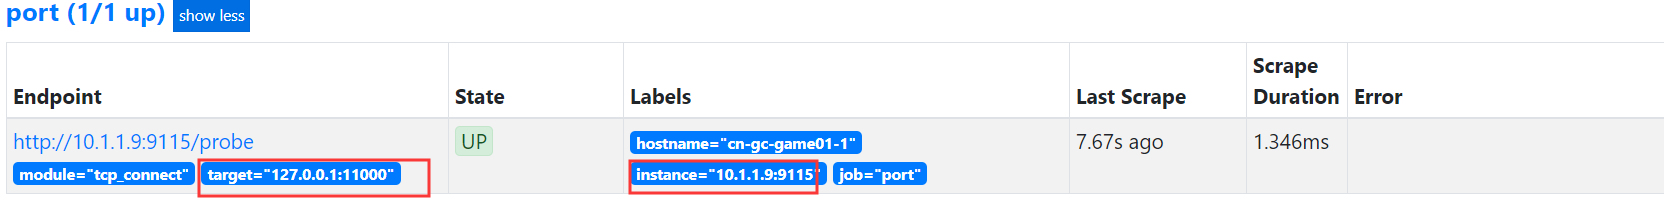
- job_name: 'port'
  metrics_path: /probe
  params:
    #prometheus的参数模块,这里使用tcp_connect
    module: [tcp_connect]
  consul_sd_configs:
    - server: '127.0.0.1:8500'
      services: []
  relabel_configs:
    - source_labels: [__meta_consul_tags]
      #仅采集带有cn-gc-port标签的主机
      regex: .*cn-gc.*
      action: keep
    #获取__meta_consul_service_id标签的值,生成一个新标签 hostname
    - source_labels: [__meta_consul_service_id]
      target_label: "hostname"
    #在__address__中过滤出ip和端口,使用反向引用的方式
    - source_labels: [__address__]
      #regex: ((?:(?:\d|[1-9]\d|1\d\d|2[0-4]\d|25[0-5])\.){3}(?:\d|[1-9]\d|2[0-4]\d|25[0-5])):(\d{1,5})
      target_label: __param_target
    #然后把值赋予给__param_target参数,这里就是要监控的target目标端口,这里要监控的端口是在consul里面定义的
    #这里127.0.0.1是因为,如果被监控主机的端口是仅本地监听,如果不写127.0.0.1,写实际ip,那么可能监控失败.因为端口仅本地监听,使用实际ip访问不到,11000是要监控的端口,这里写成固定的
      replacement: 127.0.0.1:11000
    - source_labels: [__address__]
      regex: ((?:(?:\d|[1-9]\d|1\d\d|2[0-4]\d|25[0-5])\.){3}(?:\d|[1-9]\d|2[0-4]\d|25[0-5])):(\d{1,5})
      target_label: __address__
      #这里就是instance,根据配置文件中实际的地址替换掉__address___中的地址和端口
      #为什么需要这一步,因为consul的json文件中,只能设置一个端口,那个端口是target需要使用的,这里因为端口固定是9115,所以这里过滤出ip,9115自己写就好了
      replacement: ${1}:9115
Consul
[root@cn-gc-monitoring-proxy config]# cat cn-gc-game01.json
{
  "service":{
    "id": "cn-gc-game01",
    "name": "cn-gc-game01",
    "address": "10.1.1.9",
    "port": 9100,     #因为配置文件是使用的node-exporter的,所以这里端口要通过prometheus去改变,所以这里是什么都无所谓
    "tags": ["cn-gc"],
    "checks": [
        {
         #这里的配置不管配置什么,prometheus都获取不到,可能是因为配置问题,但是有了其它解决办法,这里不做纠结
         #简单来说这里配置不重要,不会生效
            "http": "http://10.1.1.9:9100",
            "interval": "5s"
        }
    ]
  }
}
可以看出来,在上述的代码中,其实就是把图中target和instance的标签值改成正确的值就好,因为port是9100,但是我们监控的target是11000,所以我们可以获取动态的ip地址,端口号我们就自己固定死.
4.查看prometheus sql
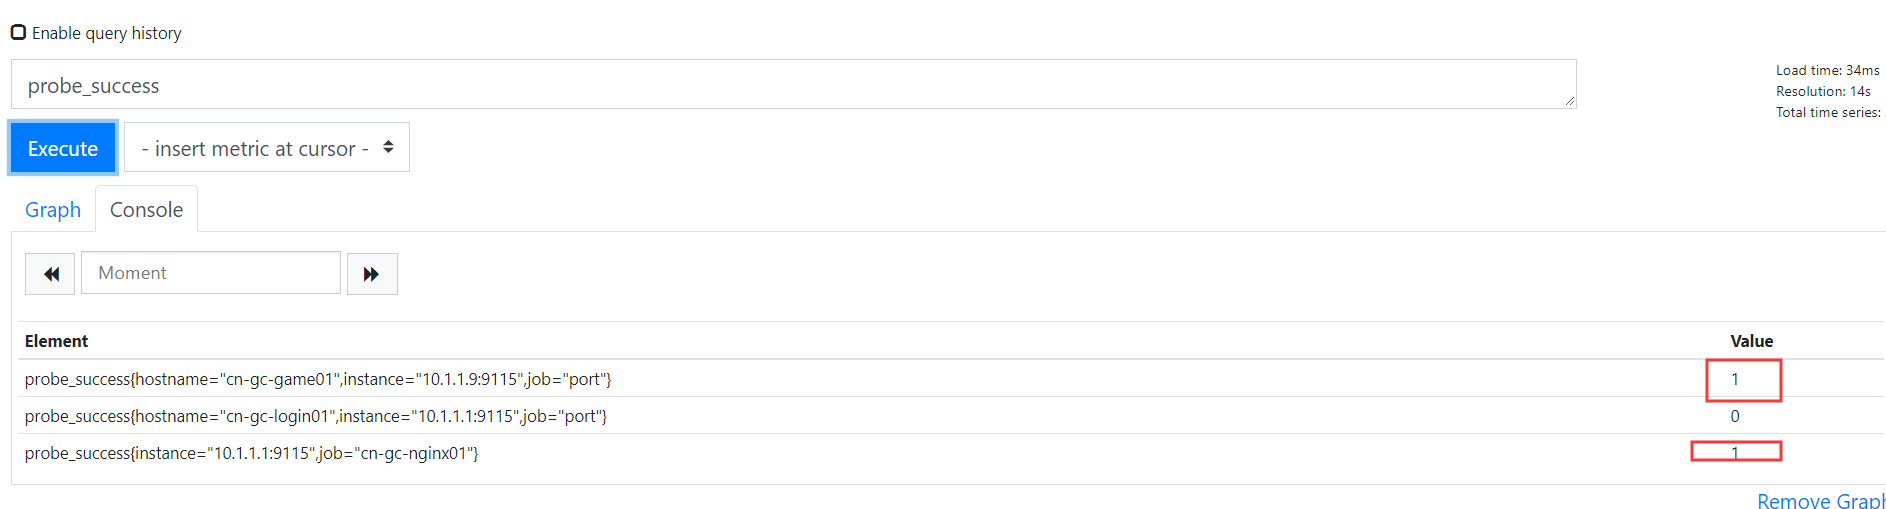
可以看出,正常的为1,不正常的为0.
5.Process exporter
1.使用supervisord管理process exporter
该插件就是监控进程是否存在,这里不做过多解释,下面是源码的地址;http://www.github.com/ncabatoff/process-exporter
这里安装也简单,使用supervisord管理,但是这里需要自定义配置文件.
Supervisord配置文件
[program:process_exporter]
command=/opt/process-exporter/process-exporter -config.path=/opt/process-exporter/process-exporter.yaml
autostart=true
autorestart=true
startsecs=5
priority=1
stopasgroup=true
killasgroup=true
redirect_stderr         = true
stdout_logfile_maxbytes = 50MB
stdout_logfile=/var/log/supervisor/process_exporter.log
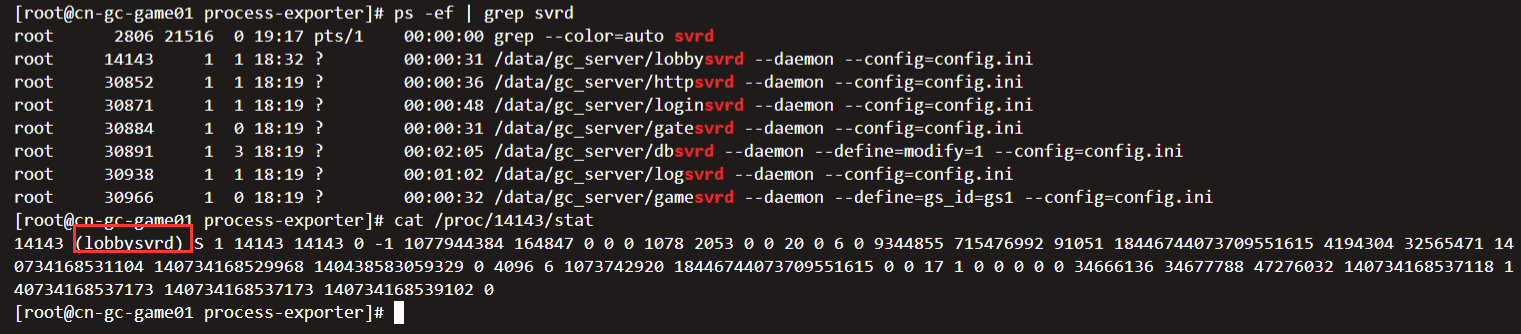
配置文件如下,配置文件都需要自定义的规则去写,就比如以下文件,监控的是所有带有svrd的进程.
[root@cn-gc-game01 opt]# cat /opt/process-exporter/process-exporter.yaml
process_names:
  - name: "{{.Comm}}"
    cmdline:
    - ".*svrd.*"
注意: 以下是一些模版变量,虽然不是很常用,但是有这么一种方式.
{{.Comm}} contains the basename of the original executable, i.e. 2nd field in /proc/<pid>/stat
{{.ExeBase}} contains the basename of the executable
{{.ExeFull}} contains the fully qualified path of the executable
{{.Username}} contains the username of the effective user
{{.Matches}} map contains all the matches resulting from applying cmdline regexps
官方解释比较混乱,这里找到网上的一篇文章来讲解;
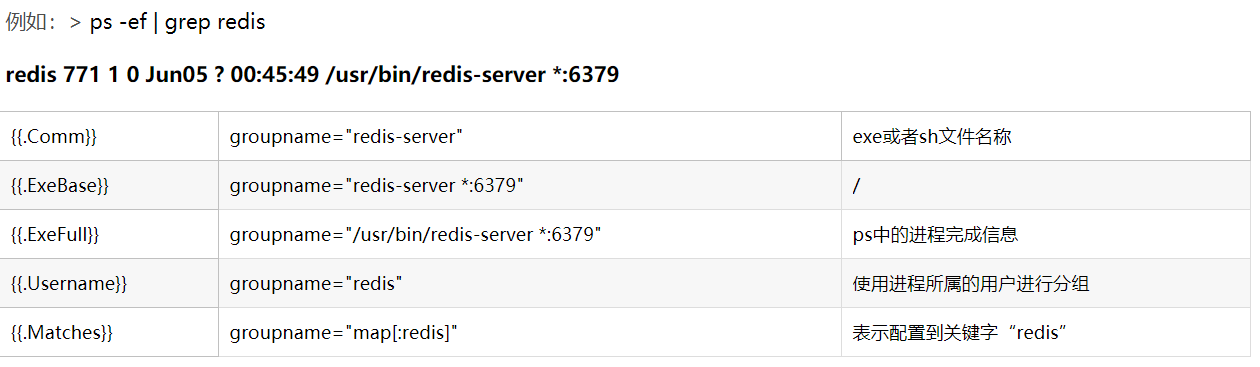
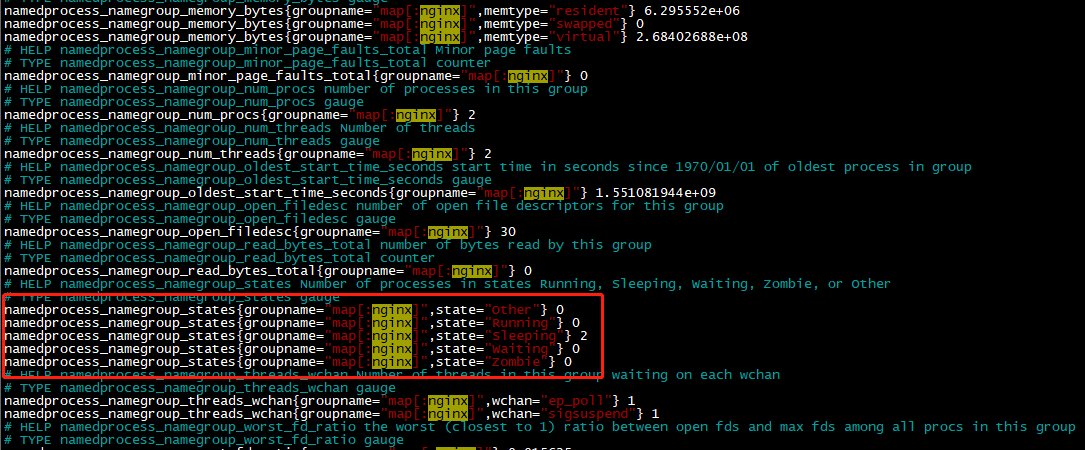
Common简单来说包含原始可执行文件的基本名称,即第二个字段/proc/<pid>/stat,例如一个随意的游戏进程,第二个字段就是进程字段;
比如,如果单纯的想监控进程,并且输出名比较短,那么就用Comm来,使用Matched也可以,但是比如一个进程使用了grep,tail等,那么都会展示出来,但是如果是一些特定服务,比如nginx,可以考虑使用Matches,因为使用Matched,nginx有一个state的字段,这样对nginx监控会更简洁,否则推荐Comm.
2.Prometheus配置
- job_name: 'cn-gc-consul-process'
  consul_sd_configs:
    - server: '127.0.0.1:8500'
  relabel_configs:
    - source_labels: [__meta_consul_tags]
      regex: .*cn-gc.*
      action: keep
    - source_labels: [__meta_consul_service_id]
      target_label: "hostname"
    #这里和tcp及web健康都是一样,找到标签中的动态ip,端口号自己固定写死
    - source_labels: [__address__]
      regex: ((?:(?:\d|[1-9]\d|1\d\d|2[0-4]\d|25[0-5])\.){3}(?:\d|[1-9]\d|2[0-4]\d|25[0-5])):(\d{1,4})
      target_label: __address__
      replacement: ${1}:9256
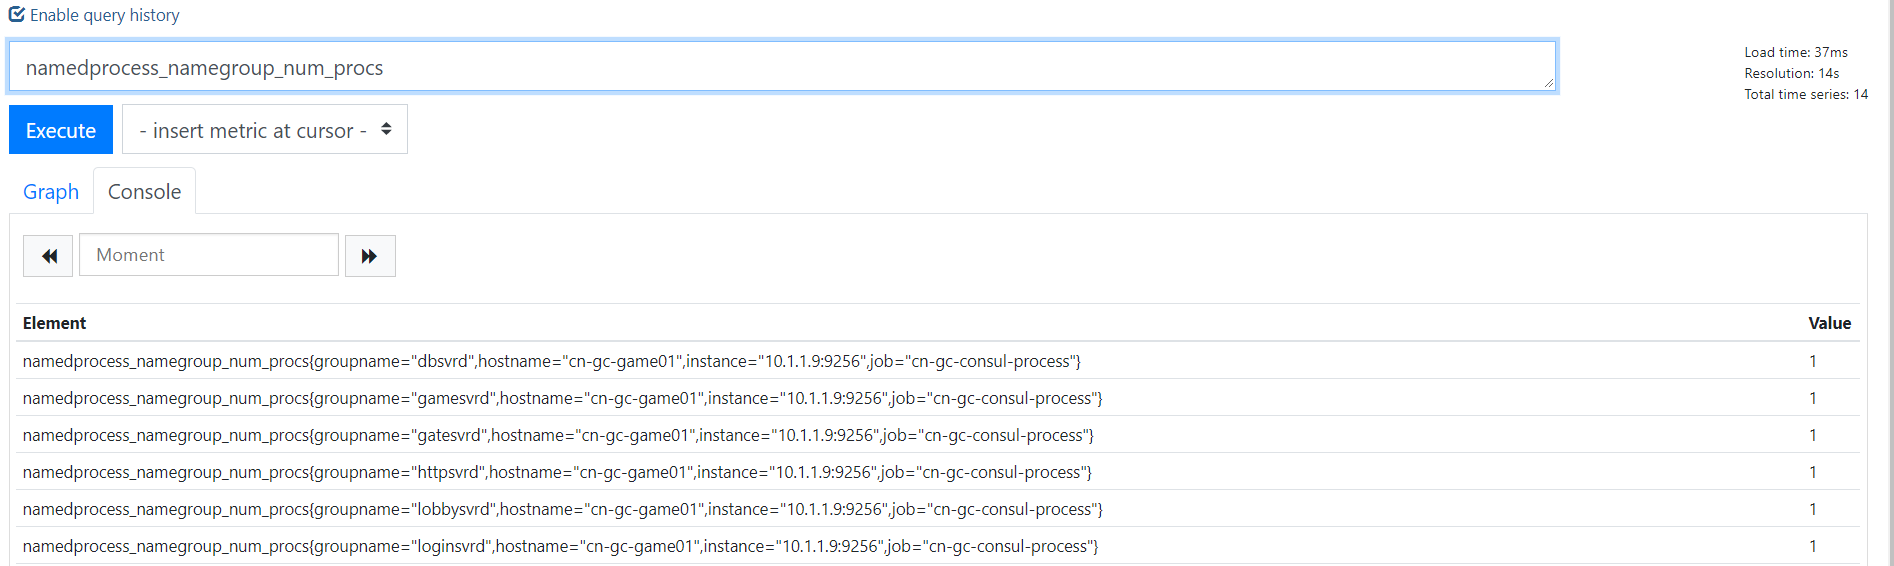
3.查看prometeus sql
6.mysql exporter
6.1 部署MySQLD Exporter
为了简化测试环境复杂度,这里使用Docker Compose定义并启动MySQL以及MySQLD Exporter:
version: '3'
services:
  mysql:
    image: mysql:5.7
    ports:
      - "3306:3306"
    environment:
      - MYSQL_ROOT_PASSWORD=password
      - MYSQL_DATABASE=database
  mysqlexporter:
    image: prom/mysqld-exporter
    ports:
      - "9104:9104"
    environment:
      - DATA_SOURCE_NAME=root:password@(mysql:3306)/database
这里通过环境变量DATA_SOURCE_NAME方式定义监控目标。使用Docker Compose启动测试用的MySQL实例以及MySQLD Exporter:
$ docker-compose up -d
启动完成后,可以通过以下命令登录到MySQL容器当中,并执行MySQL相关的指令:
$ docker exec -it <mysql_container_id> mysql -uroot -ppassword
mysql>
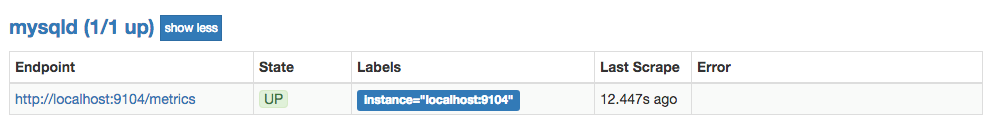
可以通过http://localhost:9104访问MySQLD Exporter暴露的服务:
可以通过/metrics查看mysql_up指标判断当前MySQLD Exporter是否正常连接到了MySQL实例,当指标值为1时表示能够正常获取监控数据:
# HELP mysql_up Whether the MySQL server is up.
# TYPE mysql_up gauge
mysql_up 1
修改Prometheus配置文件/etc/prometheus/prometheus.yml,增加对MySQLD Exporter实例的采集任务配置:
- job_name: mysqld
  static_configs:
  - targets:
    - localhost:9104
启动Prometheus:
prometheus --config.file=/etc/prometheus/prometheus.yml --storage.tsdb.path=/data/prometheus
通过Prometheus的状态页,可以查看当前Target的状态:
为了确保数据库的稳定运行,通常会关注一下四个与性能和资源利用率相关的指标:查询吞吐量、连接情况、缓冲池使用情况以及查询执行性能等。
6.2 监控数据库吞吐量
对于数据库而言,最重要的工作就是实现对数据的增、删、改、查。为了衡量数据库服务器当前的吞吐量变化情况。在MySQL内部通过一个名为Questions的计数器,当客户端发送一个查询语句后,其值就会+1。可以通过以下MySQL指令查询Questions等服务器状态变量的值:
mysql> SHOW GLOBAL STATUS LIKE "Questions";
+---------------+-------+
| Variable_name | Value |
+---------------+-------+
| Questions     | 1326  |
+---------------+-------+
1 row in set (0.00 sec)
MySQLD Exporter中返回的样本数据中通过mysql_global_status_questions反映当前Questions计数器的大小:
# HELP mysql_global_status_questions Generic metric from SHOW GLOBAL STATUS.
# TYPE mysql_global_status_questions untyped
mysql_global_status_questions 1016
通过以下PromQL可以查看当前MySQL实例查询速率的变化情况,查询数量的突变往往暗示着可能发生了某些严重的问题,因此用于用户应该关注并且设置响应的告警规则,以及时获取该指标的变化情况:
rate(mysql_global_status_questions[2m])
一般还可以从监控读操作和写操作的执行情况进行判断。通过MySQL全局状态中的Com_select可以查询到当前服务器执行查询语句的总次数:相应的,也可以通过Com_insert、Com_update以及Com_delete的总量衡量当前服务器写操作的总次数,例如,可以通过以下指令查询当前MySQL实例insert语句的执行次数总量:
mysql> SHOW GLOBAL STATUS LIKE "Com_insert";
+---------------+-------+
| Variable_name | Value |
+---------------+-------+
| Com_insert    | 0     |
+---------------+-------+
1 row in set (0.00 sec)
从MySQLD Exporter的/metrics返回的监控样本中,可以通过global_status_commands_total获取当前实例各类指令执行的次数:
# HELP mysql_global_status_commands_total Total number of executed MySQL commands.
# TYPE mysql_global_status_commands_total counter
mysql_global_status_commands_total{command="admin_commands"} 0
mysql_global_status_commands_total{command="alter_db"} 0
mysql_global_status_commands_total{command="alter_db_upgrade"} 0
mysql_global_status_commands_total{command="select"} 10
mysql_global_status_commands_total{command="insert"} 2
mysql_global_status_commands_total{command="update"} 2
mysql_global_status_commands_total{command="delete"} 1
用户可以通过以下PromQL查看当前MySQL实例写操作速率的变化情况:
sum(rate(mysql_global_status_commands_total{command=~"insert|update|delete"}[2m])) without (command)
6.3 连接情况
在MySQL中通过全局设置max_connections限制了当前服务器允许的最大客户端连接数量。一旦可用连接数被用尽,新的客户端连接都会被直接拒绝。 因此当监控MySQL运行状态时,需要时刻关注MySQL服务器的连接情况。用户可以通过以下指令查看当前MySQL服务的max_connections配置:
mysql> SHOW VARIABLES LIKE 'max_connections';
+-----------------+-------+
| Variable_name   | Value |
+-----------------+-------+
| max_connections | 151   |
+-----------------+-------+
1 row in set (0.01 sec)
MySQL默认的最大链接数为151。临时调整最大连接数,可以通过以下指令进行设置:
SET GLOBAL max_connections = 200;
如果想永久化设置,则需要通过修改MySQL配置文件my.cnf,添加以下内容:
max_connections = 200
通过Global Status中的Threads_connected、Aborted_connects、Connection_errors_max_connections以及Threads_running可以查看当前MySQL实例的连接情况。
例如,通过以下指令可以直接当前MySQL实例的连接数:
mysql> SHOW GLOBAL STATUS LIKE "Threads_connected";
+-------------------+-------+
| Variable_name     | Value |
+-------------------+-------+
| Threads_connected | 1     |
+-------------------+-------+
1 row in set (0.00 sec)
当所有可用连接都被占用时,如果一个客户端尝试连接至MySQL,会出现“Too many connections(连接数过多)”错误,同时Connection_errors_max_connections的值也会增加。为了防止出现此类情况,你应该监控可用连接的数量,并确保其值保持在max_connections限制以内。同时如果Aborted_connects的数量不断增加时,说明客户端尝试连接到MySQL都失败了。此时可以通过Connection_errors_max_connections以及Connection_errors_internal分析连接失败的问题原因。
下面列举了与MySQL连接相关的监控指标:
- mysql_global_variables_max_connections: 允许的最大连接数;
- mysql_global_status_threads_connected: 当前开放的连接;
- mysql_global_status_threads_running:当前开放的连接;
- mysql_global_status_aborted_connects:当前开放的连接;
- mysql_global_status_connection_errors_total{error="max_connections"}:由于超出最大连接数导致的错误;
- mysql_global_status_connection_errors_total{error="internal"}:由于系统内部导致的错误;
通过PromQL查询当前剩余的可用连接数:
mysql_global_variables_max_connections - mysql_global_status_threads_connected
使用PromQL查询当前MySQL实例连接拒绝数:
mysql_global_status_aborted_connects
6.4 监控缓冲池使用情况
MySQL默认的存储引擎InnoDB使用了一片称为缓冲池的内存区域,用于缓存数据表以及索引的数据。 当缓冲池的资源使用超出限制后,可能会导致数据库性能的下降,同时很多查询命令会直接在磁盘中执行,导致磁盘I/O不断攀升。 因此,应该关注MySQL缓冲池的资源使用情况,并且在合理的时间扩大缓冲池的大小可以优化数据库的性能。
Innodb_buffer_pool_pages_total反映了当前缓冲池中的内存页的总页数。可以通过以下指令查看:
mysql> SHOW GLOBAL STATUS LIKE "Innodb_buffer_pool_pages_total";
+--------------------------------+-------+
| Variable_name                  | Value |
+--------------------------------+-------+
| Innodb_buffer_pool_pages_total | 8191  |
+--------------------------------+-------+
1 row in set (0.02 sec)
MySQLD Exporter通过以下指标返回缓冲池中各类内存页的数量:
# HELP mysql_global_status_buffer_pool_pages Innodb buffer pool pages by state.
# TYPE mysql_global_status_buffer_pool_pages gauge
mysql_global_status_buffer_pool_pages{state="data"} 516
mysql_global_status_buffer_pool_pages{state="dirty"} 0
mysql_global_status_buffer_pool_pages{state="free"} 7675
mysql_global_status_buffer_pool_pages{state="misc"} 0
Innodb_buffer_pool_read_requests记录了正常从缓冲池读取数据的请求数量。可以通过以下指令查看:
mysql> SHOW GLOBAL STATUS LIKE "Innodb_buffer_pool_read_requests";
+----------------------------------+--------+
| Variable_name                    | Value  |
+----------------------------------+--------+
| Innodb_buffer_pool_read_requests | 797023 |
+----------------------------------+--------+
1 row in set (0.00 sec)
MySQLD Exporter通过以下指标返回缓冲池中Innodb_buffer_pool_read_requests的值:
# HELP mysql_global_status_innodb_buffer_pool_read_requests Generic metric from SHOW GLOBAL STATUS.
# TYPE mysql_global_status_innodb_buffer_pool_read_requests untyped
mysql_global_status_innodb_buffer_pool_read_requests 736711
当缓冲池无法满足时,MySQL只能从磁盘中读取数据。Innodb_buffer_pool_reads即记录了从磁盘读取数据的请求数量。通常来说从内存中读取数据的速度要比从磁盘中读取快很多,因此,如果Innodb_buffer_pool_reads的值开始增加,可能意味着数据库的性能有问题。 可以通过以下只能查看Innodb_buffer_pool_reads的数量
mysql> SHOW GLOBAL STATUS LIKE "Innodb_buffer_pool_reads";
+--------------------------+-------+
| Variable_name            | Value |
+--------------------------+-------+
| Innodb_buffer_pool_reads | 443   |
+--------------------------+-------+
1 row in set (0.00 sec)
在MySQLD Exporter中可以通过以下指标查看Innodb_buffer_pool_reads的数量。
# HELP mysql_global_status_innodb_buffer_pool_reads Generic metric from SHOW GLOBAL STATUS.
# TYPE mysql_global_status_innodb_buffer_pool_reads untyped
mysql_global_status_innodb_buffer_pool_reads 443
通过以上监控指标,以及实际监控的场景,我们可以利用PromQL快速建立多个监控项。
通过以下PromQL可以得到各个MySQL实例的缓冲池利用率。一般来说还需要结合Innodb_buffer_pool_reads的增长率情况来结合判断缓冲池大小是否合理:
(sum(mysql_global_status_buffer_pool_pages) by (instance) - sum(mysql_global_status_buffer_pool_pages{state="free"}) by (instance)) / sum(mysql_global_status_buffer_pool_pages) by (instance)
也可以通过以下PromQL计算2分钟内磁盘读取请求次数的增长率的变化情况:
rate(mysql_global_status_innodb_buffer_pool_reads[2m])
6.5 查询性能
MySQL还提供了一个Slow_queries的计数器,当查询的执行时间超过long_query_time的值后,计数器就会+1,其默认值为10秒,可以通过以下指令在MySQL中查询当前long_query_time的设置:
mysql> SHOW VARIABLES LIKE 'long_query_time';
+-----------------+-----------+
| Variable_name   | Value     |
+-----------------+-----------+
| long_query_time | 10.000000 |
+-----------------+-----------+
1 row in set (0.00 sec)
通过以下指令可以查看当前MySQL实例中Slow_queries的数量:
mysql> SHOW GLOBAL STATUS LIKE "Slow_queries";
+---------------+-------+
| Variable_name | Value |
+---------------+-------+
| Slow_queries  | 0     |
+---------------+-------+
1 row in set (0.00 sec)
MySQLD Exporter返回的样本数据中,通过以下指标展示当前的Slow_queries的值:
# HELP mysql_global_status_slow_queries Generic metric from SHOW GLOBAL STATUS.
# TYPE mysql_global_status_slow_queries untyped
mysql_global_status_slow_queries 0
通过监控Slow_queries的增长率,可以反映出当前MySQL服务器的性能状态,可以通过以下PromQL查询Slow_queries的增长情况:
rate(mysql_global_status_slow_queries[2m])
在MySQL中还可以通过安装response time插件,从而支持记录查询时间区间的统计信息。启动该功能后MySQLD Exporter也会自动获取到相关数据,从而可以细化MySQL查询响应时间的分布情况。 感兴趣的读者可以自行尝试。
7.其它 exporter
除了 node_exporter 我们还会根据自己的业务选择安装其他exporter 或者自己编写,比较常用的 exporter 有,
- Memcached exporter 负责收集 Memcached 信息
- MySQL server exporter 负责收集 Mysql Sever 信息
- MongoDB exporter 负责收集 MongoDB 信息
- InfluxDB exporter 负责收集 InfluxDB 信息
- JMX exporter 负责收集 Java 虚拟机信息
更多exporter 请参考链接。
8.使用java 自定义Exporter
8.1 使用Client Java构建Exporter程序
client_java是Prometheus针对JVM类开发语言的client library库,我们可以直接基于client_java用户可以快速实现独立运行的Exporter程序,也可以在我们的项目源码中集成client_java以支持Prometheus。
8.1.1 自定义Collector
在client_java的simpleclient模块中提供了自定义监控指标的核心接口。
如果使用Gradle作为项目构建工具,可以通过向build.gradle添加simpleclient依赖:
compile 'io.prometheus:simpleclient:0.3.0'
当无法直接修改监控目标时,可以通过自定义Collector的方式,实现对监控样本收集,该收集器需要实现collect()方法并返回一组监控样本,如下所示:
public class YourCustomCollector extends Collector {
    public List<MetricFamilySamples> collect() {
        List<MetricFamilySamples> mfs = new ArrayList<MetricFamilySamples>();

        String metricName = "my_guage_1";

        // Your code to get metrics

        MetricFamilySamples.Sample sample = new MetricFamilySamples.Sample(metricName, Arrays.asList("l1"), Arrays.asList("v1"), 4);
        MetricFamilySamples.Sample sample2 = new MetricFamilySamples.Sample(metricName, Arrays.asList("l1", "l2"), Arrays.asList("v1", "v2"), 3);

        MetricFamilySamples samples = new MetricFamilySamples(metricName, Type.GAUGE, "help", Arrays.asList(sample, sample2));

        mfs.add(samples);
        return mfs;
    }
}
这里定义了一个名为my_guage的监控指标,该监控指标的所有样本数据均转换为一个MetricFamilySamples.Sample实例,该实例中包含了该样本的指标名称、标签名数组、标签值数组以及样本数据的值。
监控指标my_guage的所有样本值,需要持久化到一个MetricFamilySamples实例中,MetricFamilySamples指定了当前监控指标的名称、类型、注释信息等。需要注意的是MetricFamilySamples中所有样本的名称必须保持一致,否则生成的数据将无法符合Prometheus的规范。
直接使用MetricFamilySamples.Sample和MetricFamilySamples的方式适用于当某监控指标的样本之间的标签可能不一致的情况,例如,当监控容器时,不同容器实例可能包含一些自定义的标签,如果需要将这些标签反应到样本上,那么每个样本的标签则不可能保持一致。而如果所有样本的是一致的情况下,我们还可以使用client_java针对不同指标类型的实现GaugeMetricFamily,CounterMetricFamily,SummaryMetricFamily等,例如:
class YourCustomCollector2 extends Collector {
  List<MetricFamilySamples> collect() {
    List<MetricFamilySamples> mfs = new ArrayList<MetricFamilySamples>();

    // With no labels.
    mfs.add(new GaugeMetricFamily("my_gauge_2", "help", 42));

    // With labels
    GaugeMetricFamily labeledGauge = new GaugeMetricFamily("my_other_gauge", "help", Arrays.asList("labelname"));
    labeledGauge.addMetric(Arrays.asList("foo"), 4);
    labeledGauge.addMetric(Arrays.asList("bar"), 5);
    mfs.add(labeledGauge);

    return mfs;
  }
}
8.1.2 使用HTTP Server暴露样本数据
client_java下的simpleclient_httpserver模块实现了一个简单的HTTP服务器,当向该服务器发送获取样本数据的请求后,它会自动调用所有Collector的collect()方法,并将所有样本数据转换为Prometheus要求的数据输出格式规范。如果用户使用了Gradle构建项目,可以添加以下依赖:
compile 'io.prometheus:simpleclient_httpserver:0.3.0'
添加依赖之后,就可以在Exporter程序的main方法中启动一个HTTPServer实例:
public class CustomExporter {
    public static void main(String[] args) throws IOException {
        HTTPServer server = new HTTPServer(1234);
    }
}
而在启动之前,别忘记调用Collector的register()方法。否则HTTPServer是找不到任何的Collector实例的:
new YourCustomCollector().register();
new YourCustomCollector2().register();
运行CustomExporter并访问http://127.0.0.1:1234/metrics,即可获取到以下数据:
$ curl http://127.0.0.1:1234/metrics
# HELP my_gauge help
# TYPE my_gauge gauge
my_gauge 42.0
# HELP my_other_gauge help
# TYPE my_other_gauge gauge
my_other_gauge{labelname="foo",} 4.0
my_other_gauge{labelname="bar",} 5.0
# HELP my_guage help
# TYPE my_guage gauge
my_guage{l1="v1",} 4.0
my_guage{l1="v1",l2="v2",} 3.0
当然HTTPServer中并不存在什么黑魔法,其内部实现如下所示:
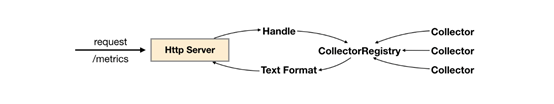
HTTPServer处理流程
当调用Collector实例register()方法时,会将该实例保存到CollectorRegistry当中,CollectorRegistry负责维护当前系统中所有的Collector实例。 HTTPServer在接收到HTTP请求之后,会从CollectorRegistry中拿到所有的Collector实例,并调用其collect()方法获取所有样本,最后格式化为Prometheus的标准输出。
除了直接使用HTTPServer以外暴露样本数据以外,client_java中还提供了对Spring Boot、Spring Web以及Servlet的支持。
8.1.3 使用内置的Collector
通过client_java中定义的标准接口,用户可以快速实现自己的监控数据收集器,并通过HTTPServer将样本数据输出给Prometheus。除了提供接口规范以外,client_java还提供了多个内置的Collector模块,以simpleclient_hotspot为例,该模块中内置了对JVM虚拟机运行状态(GC,内存池,JMX,类加载,线程池等)数据的Collector实现,用户可以通过在Gradle中添加以下依赖,导入simpleclient_hotspot:
compile 'io.prometheus:simpleclient_hotspot:0.3.0'
通过调用io.prometheus.client.hotspot.DefaultExport的initialize方法注册该模块中所有的Collector实例:
DefaultExports.initialize();
重新运行CustomExporter,并获取样本数据:
$ curl http://127.0.0.1:1234/metrics
# HELP jvm_buffer_pool_used_bytes Used bytes of a given JVM buffer pool.
# TYPE jvm_buffer_pool_used_bytes gauge
jvm_buffer_pool_used_bytes{pool="direct",} 8192.0
jvm_buffer_pool_used_bytes{pool="mapped",} 0.0
除了之前自定义的监控指标以外,在响应内容中还会得到当前JVM的运行状态数据。在client_java项目中除了使用内置了对JVM监控的Collector以外,还实现了对Hibernate,Guava Cache,Jetty,Log4j、Logback等监控数据收集的支持。用户只需要添加相应的依赖,就可以直接进行使用。
8.1.4 在业务代码中进行监控埋点
在client_java中除了使用Collector直接采集样本数据以外,还直接提供了对Prometheus中4种监控类型的实现分别是:Counter、Gauge、Summary和Histogram。 基于这些实现,开发人员可以非常方便的在应用程序的业务流程中进行监控埋点。
8.1.5 简单类型Gauge和Counter
以Gauge为例,当我们需要监控某个业务当前正在处理的请求数量,可以使用以下方式实现:
public class YourClass {

    static final Gauge inprogressRequests = Gauge.build()
            .name("inprogress_requests").help("Inprogress requests.").register();

    void processRequest() {
        inprogressRequests.inc();
        // Your code here.
        inprogressRequests.dec();
    }

}
Gauge继承自Collector,registoer()方法会将该Gauge实例注册到CollectorRegistry中。这里创建了一个名为inprogress_requests的监控指标,其注释信息为"Inprogress requests"。
Gauge对象主要包含两个方法inc()和dec(),分别用于计数器+1和-1。
如果监控指标中还需要定义标签,则可以使用Gauge构造器的labelNames()方法,声明监控指标的标签,同时在样本计数时,通过指标的labels()方法指定标签的值,如下所示:
public class YourClass {

    static final Gauge inprogressRequests = Gauge.build()
            .name("inprogress_requests")
            .labelNames("method")
            .help("Inprogress requests.").register();

    void processRequest() {
        inprogressRequests.labels("get").inc();
        // Your code here.
        inprogressRequests.labels("get").dec();
    }

}
Counter与Gauge的使用方法一致,唯一的区别在于Counter实例只包含一个inc()方法,用于计数器+1。
8.1.6 复杂类型Summary和Histogram
Summary和Histogram用于统计和分析样本的分布情况。如下所示,通过Summary可以将HTTP请求的字节数以及请求处理时间作为统计样本,直接统计其样本的分布情况。
class YourClass {
  static final Summary receivedBytes = Summary.build()
     .name("requests_size_bytes").help("Request size in bytes.").register();
  static final Summary requestLatency = Summary.build()
     .name("requests_latency_seconds").help("Request latency in seconds.").register();

  void processRequest(Request req) {
    Summary.Timer requestTimer = requestLatency.startTimer();
    try {
      // Your code here.
    } finally {
      receivedBytes.observe(req.size());
      requestTimer.observeDuration();
    }
  }
}
除了使用Timer进行计时以外,Summary实例也提供了timer()方法,可以对线程或者Lamda表达式运行时间进行统计:
class YourClass {
  static final Summary requestLatency = Summary.build()
    .name("requests_latency_seconds").help("Request latency in seconds.").register();

  void processRequest(Request req) {
    requestLatency.timer(new Runnable() {
      public abstract void run() {
        // Your code here.
      }
    });

    // Or the Java 8 lambda equivalent
    requestLatency.timer(() -> {
      // Your code here.
    });
  }
}
Summary和Histogram的用法基本保持一致,区别在于Summary可以指定在客户端统计的分位数,如下所示:
static final Summary requestLatency = Summary.build()
    .quantile(0.5, 0.05)   // 其中0.05为误差
    .quantile(0.9, 0.01)   // 其中0.01为误差
    .name("requests_latency_seconds").help("Request latency in seconds.").register();
对于Histogram而言,默认的分布桶为[.005, .01, .025, .05, .075, .1, .25, .5, .75, 1, 2.5, 5, 7.5, 10],如果需要指定自定义的桶分布,可以使用buckets()方法指定,如下所示:
static final Histogram requestLatency = Histogram.build()
            .name("requests_latency_seconds").help("Request latency in seconds.")
            .buckets(0.1, 0.2, 0.4, 0.8)
            .register();
8.1.7 与PushGateway集成
对于一些短周期或者临时采集的样本数据,client_java还提供了对PushGateway的支持:
添加依赖:
compile 'io.prometheus:simpleclient_pushgateway:0.3.0'
如下所示,PushGateway的实现类可以从所有注册到defaultRegistry的Collector实例中获取样本数据并直接推送 到外部部署的PushGateway服务中。
public class PushGatewayIntegration {
    public void push() throws IOException {
        CollectorRegistry registry = CollectorRegistry.defaultRegistry;
        PushGateway pg = new PushGateway("127.0.0.1:9091");
        pg.pushAdd(registry, "my_batch_job");
    }
}
8.2 在应用内置prometheus支持
本小节将以Spring Boot为例,介绍如何在应用代码中集成client_java。
添加Prometheus Java Client相关的依赖:
dependencies {
    compile 'io.prometheus:simpleclient:0.0.24'
    compile "io.prometheus:simpleclient_spring_boot:0.0.24"
    compile "io.prometheus:simpleclient_hotspot:0.0.24"
}
通过注解@EnablePrometheusEndpoint启用Prometheus Endpoint,这里同时使用了simpleclient_hotspot中提供的DefaultExporter。该Exporter会在metrics endpoint中统计当前应用JVM的相关信息:
@SpringBootApplication
@EnablePrometheusEndpoint
public class SpringApplication implements CommandLineRunner {

    public static void main(String[] args) {
        SpringApplication.run(GatewayApplication.class, args);
    }

    @Override
    public void run(String... strings) throws Exception {
        DefaultExports.initialize();
    }
}
默认情况下Prometheus暴露的metrics endpoint为 /prometheus,可以通过endpoint配置进行修改:
endpoints:
  prometheus:
    id: metrics
  metrics:
    id: springmetrics
    sensitive: false
    enabled: true
启动应用程序访问http://localhost:8080/metrics可以看到以下输出内容:
# HELP jvm_gc_collection_seconds Time spent in a given JVM garbage collector in seconds.
# TYPE jvm_gc_collection_seconds summary
jvm_gc_collection_seconds_count{gc="PS Scavenge",} 11.0
jvm_gc_collection_seconds_sum{gc="PS Scavenge",} 0.18
jvm_gc_collection_seconds_count{gc="PS MarkSweep",} 2.0
jvm_gc_collection_seconds_sum{gc="PS MarkSweep",} 0.121
# HELP jvm_classes_loaded The number of classes that are currently loaded in the JVM
# TYPE jvm_classes_loaded gauge
jvm_classes_loaded 8376.0
# HELP jvm_classes_loaded_total The total number of classes that have been loaded since the JVM has started execution
# TYPE jvm_classes_loaded_total counter
...
8.2.1 添加拦截器,为监控埋点做准备
除了获取应用JVM相关的状态以外,我们还可能需要添加一些自定义的监控Metrics实现对系统性能,以及业务状态进行采集,以提供日后优化的相关支撑数据。首先我们使用拦截器处理对应用的所有请求。
继承WebMvcConfigurerAdapter类并复写addInterceptors方法,对所有请求/**添加拦截器
@SpringBootApplication
@EnablePrometheusEndpoint
public class SpringApplication extends WebMvcConfigurerAdapter implements CommandLineRunner {
    @Override
    public void addInterceptors(InterceptorRegistry registry) {
        registry.addInterceptor(new PrometheusMetricsInterceptor()).addPathPatterns("/**");
    }
}
PrometheusMetricsInterceptor继承自HandlerInterceptorAdapter,通过复写父方法preHandle和afterCompletion可以拦截一个HTTP请求生命周期的不同阶段:
public class PrometheusMetricsInterceptor extends HandlerInterceptorAdapter {
    @Override
    public boolean preHandle(HttpServletRequest request, HttpServletResponse response, Object handler) throws Exception {
        return super.preHandle(request, response, handler);
    }

    @Override
    public void afterCompletion(HttpServletRequest request, HttpServletResponse response, Object handler, Exception ex) throws Exception {
        super.afterCompletion(request, response, handler, ex);
    }
}
8.2.2 自定义监控指标
一旦PrometheusMetricsInterceptor能够成功拦截和处理请求之后,我们就可以使用client java自定义多种监控指标。
计数器可以用于记录只会增加不会减少的指标类型,比如记录应用请求的总量(http_requests_total),cpu使用时间(process_cpu_seconds_total)等。 一般而言,Counter类型的metrics指标在命名中我们使用_total结束。
使用Counter.build()创建Counter类型的监控指标,并且通过name()方法定义监控指标的名称,通过labelNames()定义该指标包含的标签。最后通过register()将该指标注册到Collector的defaultRegistry中。
public class PrometheusMetricsInterceptor extends HandlerInterceptorAdapter {

    static final Counter requestCounter = Counter.build()
            .name("io_namespace_http_requests_total").labelNames("path", "method", "code")
            .help("Total requests.").register();

    @Override
    public void afterCompletion(HttpServletRequest request, HttpServletResponse response, Object handler, Exception ex) throws Exception {
        String requestURI = request.getRequestURI();
        String method = request.getMethod();
        int status = response.getStatus();

        requestCounter.labels(requestURI, method, String.valueOf(status)).inc();
        super.afterCompletion(request, response, handler, ex);
    }
}
在afterCompletion方法中,可以获取到当前请求的请求路径、请求方法以及状态码。 这里通过labels指定了当前样本各个标签对应的值,最后通过.inc()计数器+1:
requestCounter.labels(requestURI, method, String.valueOf(status)).inc();
通过指标io_namespace_http_requests_total我们可以实现:
- 查询应用的请求总量
# PromQL
sum(io_namespace_http_requests_total)
- 查询每秒Http请求量
# PromQL
sum(rate(io_wise2c_gateway_requests_total[5m]))
- 查询当前应用请求量Top N的URI
# PromQL
topk(10, sum(io_namespace_http_requests_total) by (path))
使用Gauge可以反映应用的当前状态,例如在监控主机时,主机当前空闲的内容大小(node_memory_MemFree),可用内存大小(node_memory_MemAvailable)。或者容器当前的CPU使用率,内存使用率。这里我们使用Gauge记录当前应用正在处理的Http请求数量。
public class PrometheusMetricsInterceptor extends HandlerInterceptorAdapter {

    ...省略的代码
    static final Gauge inprogressRequests = Gauge.build()
            .name("io_namespace_http_inprogress_requests").labelNames("path", "method")
            .help("Inprogress requests.").register();

    @Override
    public boolean preHandle(HttpServletRequest request, HttpServletResponse response, Object handler) throws Exception {
        ...省略的代码
        // 计数器+1
        inprogressRequests.labels(requestURI, method).inc();
        return super.preHandle(request, response, handler);
    }

    @Override
    public void afterCompletion(HttpServletRequest request, HttpServletResponse response, Object handler, Exception ex) throws Exception {
        ...省略的代码
        // 计数器-1
        inprogressRequests.labels(requestURI, method).dec();

        super.afterCompletion(request, response, handler, ex);
    }
}
通过指标io_namespace_http_inprogress_requests我们可以直接查询应用当前正在处理中的Http请求数量:
# PromQL
io_namespace_http_inprogress_requests{}
Histogram主要用于在指定分布范围内(Buckets)记录大小(如http request bytes)或者事件发生的次数。以请求响应时间requests_latency_seconds为例。
public class PrometheusMetricsInterceptor extends HandlerInterceptorAdapter {

    static final Histogram requestLatencyHistogram = Histogram.build().labelNames("path", "method", "code")
            .name("io_namespace_http_requests_latency_seconds_histogram").help("Request latency in seconds.")
            .register();

    private Histogram.Timer histogramRequestTimer;

    @Override
    public boolean preHandle(HttpServletRequest request, HttpServletResponse response, Object handler) throws Exception {
        ...省略的代码
        histogramRequestTimer = requestLatencyHistogram.labels(requestURI, method, String.valueOf(status)).startTimer();
        ...省略的代码
    }

    @Override
    public void afterCompletion(HttpServletRequest request, HttpServletResponse response, Object handler, Exception ex) throws Exception {
        ...省略的代码
        histogramRequestTimer.observeDuration();
        ...省略的代码
    }
}
Histogram会自动创建3个指标,分别为:
- 事件发生总次数: basename_count
# 实际含义: 当前一共发生了2次http请求
io_namespace_http_requests_latency_seconds_histogram_count{path="/",method="GET",code="200",} 2.0
- 所有事件产生值的大小的总和: basename_sum
# 实际含义: 发生的2次http请求总的响应时间为13.107670803000001 秒
io_namespace_http_requests_latency_seconds_histogram_sum{path="/",method="GET",code="200",} 13.107670803000001
- 事件产生的值分布在bucket中的次数: basename_bucket{le="上包含"}
# 在总共2次请求当中。http请求响应时间 <=0.005 秒 的请求次数为0
io_namespace_http_requests_latency_seconds_histogram_bucket{path="/",method="GET",code="200",le="0.005",} 0.0
# 在总共2次请求当中。http请求响应时间 <=0.01 秒 的请求次数为0
io_namespace_http_requests_latency_seconds_histogram_bucket{path="/",method="GET",code="200",le="0.01",} 0.0
# 在总共2次请求当中。http请求响应时间 <=0.025 秒 的请求次数为0
io_namespace_http_requests_latency_seconds_histogram_bucket{path="/",method="GET",code="200",le="0.025",} 0.0
io_namespace_http_requests_latency_seconds_histogram_bucket{path="/",method="GET",code="200",le="0.05",} 0.0
io_namespace_http_requests_latency_seconds_histogram_bucket{path="/",method="GET",code="200",le="0.075",} 0.0
io_namespace_http_requests_latency_seconds_histogram_bucket{path="/",method="GET",code="200",le="0.1",} 0.0
io_namespace_http_requests_latency_seconds_histogram_bucket{path="/",method="GET",code="200",le="0.25",} 0.0
io_namespace_http_requests_latency_seconds_histogram_bucket{path="/",method="GET",code="200",le="0.5",} 0.0
io_namespace_http_requests_latency_seconds_histogram_bucket{path="/",method="GET",code="200",le="0.75",} 0.0
io_namespace_http_requests_latency_seconds_histogram_bucket{path="/",method="GET",code="200",le="1.0",} 0.0
io_namespace_http_requests_latency_seconds_histogram_bucket{path="/",method="GET",code="200",le="2.5",} 0.0
io_namespace_http_requests_latency_seconds_histogram_bucket{path="/",method="GET",code="200",le="5.0",} 0.0
io_namespace_http_requests_latency_seconds_histogram_bucket{path="/",method="GET",code="200",le="7.5",} 2.0
# 在总共2次请求当中。http请求响应时间 <=10 秒 的请求次数为0
io_namespace_http_requests_latency_seconds_histogram_bucket{path="/",method="GET",code="200",le="10.0",} 2.0
# 在总共2次请求当中。http请求响应时间 10 秒 的请求次数为0
io_namespace_http_requests_latency_seconds_histogram_bucket{path="/",method="GET",code="200",le="+Inf",} 2.0
Summary和Histogram非常类型相似,都可以统计事件发生的次数或者发小,以及其分布情况。Summary和Histogram都提供了对于事件的计数_count以及值的汇总_sum。 因此使用_count,和_sum时间序列可以计算出相同的内容,例如http每秒的平均响应时间:rate(basename_sum[5m]) / rate(basename_count[5m])。同时Summary和Histogram都可以计算和统计样本的分布情况,比如中位数,9分位数等等。其中 0.0<= 分位数Quantiles <= 1.0。
不同在于Histogram可以通过histogram_quantile函数在服务器端计算分位数,而Sumamry的分位数则是直接在客户端进行定义。因此对于分位数的计算。 Summary在通过PromQL进行查询时有更好的性能表现,而Histogram则会消耗更多的资源。相对的对于客户端而言Histogram消耗的资源更少。
public class PrometheusMetricsInterceptor extends HandlerInterceptorAdapter {

    static final Summary requestLatency = Summary.build()
            .name("io_namespace_http_requests_latency_seconds_summary")
            .quantile(0.5, 0.05)
            .quantile(0.9, 0.01)
            .labelNames("path", "method", "code")
            .help("Request latency in seconds.").register();


    @Override
    public boolean preHandle(HttpServletRequest request, HttpServletResponse response, Object handler) throws Exception {
        ...省略的代码
        requestTimer = requestLatency.labels(requestURI, method, String.valueOf(status)).startTimer();
        ...省略的代码
    }

    @Override
    public void afterCompletion(HttpServletRequest request, HttpServletResponse response, Object handler, Exception ex) throws Exception {
        ...省略的代码
        requestTimer.observeDuration();
        ...省略的代码
    }
}
使用Summary指标,会自动创建多个时间序列:
- 事件发生总的次数
# 含义:当前http请求发生总次数为12次
io_namespace_http_requests_latency_seconds_summary_count{path="/",method="GET",code="200",} 12.0
- 事件产生的值的总和
# 含义:这12次http请求的总响应时间为 51.029495508s
io_namespace_http_requests_latency_seconds_summary_sum{path="/",method="GET",code="200",} 51.029495508
- 事件产生的值的分布情况
# 含义:这12次http请求响应时间的中位数是3.052404983s
io_namespace_http_requests_latency_seconds_summary{path="/",method="GET",code="200",quantile="0.5",} 3.052404983

# 含义:这12次http请求响应时间的9分位数是8.003261666s
io_namespace_http_requests_latency_seconds_summary{path="/",method="GET",code="200",quantile="0.9",} 8.003261666
8.2.3 使用Collector暴露其它指标
除了在拦截器中使用Prometheus提供的Counter,Summary,Gauage等构造监控指标以外,我们还可以通过自定义的Collector实现对相关业务指标的暴露。例如,我们可以通过自定义Collector直接从应用程序的数据库中统计监控指标.
@SpringBootApplication
@EnablePrometheusEndpoint
public class SpringApplication extends WebMvcConfigurerAdapter implements CommandLineRunner {

    @Autowired
    private CustomExporter customExporter;

    ...省略的代码

    @Override
    public void run(String... args) throws Exception {
        ...省略的代码
        customExporter.register();
    }
}
CustomExporter集成自io.prometheus.client.Collector,在调用Collector的register()方法后,当访问/metrics时,则会自动从Collector的collection()方法中获取采集到的监控指标。
由于这里CustomExporter存在于Spring的IOC容器当中,这里可以直接访问业务代码,返回需要的业务相关的指标。
import io.prometheus.client.Collector;
import io.prometheus.client.GaugeMetricFamily;
import org.springframework.stereotype.Component;

import java.util.ArrayList;
import java.util.Collections;
import java.util.List;

@Component
public class CustomExporter extends Collector {
    @Override
    public List<MetricFamilySamples> collect() {
        List<MetricFamilySamples> mfs = new ArrayList<>();

        # 创建metrics指标
        GaugeMetricFamily labeledGauge =
                new GaugeMetricFamily("io_namespace_custom_metrics", "custom metrics", Collections.singletonList("labelname"));

        # 设置指标的label以及value
        labeledGauge.addMetric(Collections.singletonList("labelvalue"), 1);

        mfs.add(labeledGauge);
        return mfs;
    }
}
这里也可以使用CounterMetricFamily,SummaryMetricFamily声明其它的指标类型。

 浙公网安备 33010602011771号