
Prometheus安装
|
导航:这里主要是列出一个prometheus一些系统的学习过程,最后按照章节顺序查看,由于写作该文档经历了不同时期,所以在文中有时出现 的云环境不统一,但是学习具体使用方法即可,在最后的篇章,有一个完整的腾讯云的实战案例。 8.kube-state-metrics 和 metrics-server 13.Grafana简单用法 参考: https://prometheus.io/docs/prometheus/latest/configuration/configuration/#kubernetes_sd_config https://www.bookstack.cn/read/prometheus_practice/introduction-README.md |
本章将介绍 Prometheus 两种安装方式: 传统二进制包安装和 Docker 安装方式。
1.二进制安装
我们可以到 Prometheus 二进制安装包下载页面,根据自己的操作系统选择下载对应的安装包。下面我们将以 centos7 server 作为演示。
- CentOS Linux release 7.6.1810
- prometheus 2.13.1
1.1 下载 Prometheus Server
创建一个自己习惯的目录,我这里是/tools,然后使用wget下载prometheus安装包
mkdir /tools
cd /tools
wget https://github.com/prometheus/prometheus/releases/download/v2.13.1/prometheus-2.13.1.linux-amd64.tar.gz
创建 Prometheus 目录,用于存放所有 Prometheus 相关的运行服务,我这里使用/opt,然后解压prometheus-2.13.1.linux-amd64.tar.gz
cd /tools
tar zxvf prometheus-2.13.1.linux-amd64.tar.gz
mv  prometheus-2.13.1.linux-amd64  /opt/prometheus
解压缩成功后,可以运行 version 检查运行环境是否正常
./prometheus --version
prometheus, version 2.13.1 (branch: HEAD, revision: 6f92ce56053866194ae5937012c1bec40f1dd1d9)
  build user:       root@88e419aa1676
  build date:       20191017-13:15:01
  go version:       go1.13.1
1.2 启动 Prometheus Server
./prometheus
当然也可以增加自定义参数,包括指定程序目录等
/opt/prometheus/prometheus --config.file=/opt/prometheus/prometheus.yml --storage.tsdb.path=/data/prometheus/data/ --storage.tsdb.retention.time=3d --query.max-samples=5000000 --query.max-concurrency=10 --web.enable-lifecycle
如果 prometheus 正常启动,你将看到如下信息:
INFO[0000] Starting prometheus (version=1.23.1, branch=master, revision=b38e977fd8cc2a0d13f47e7f0e17b82d1a908a9a)  source=main.go:88
INFO[0000] Build context (go=go1.8.1, user=root@c99d9d650cf4, date=20170511-13:03:00)  source=main.go:89
INFO[0000] Loading configuration file prometheus.yml     source=main.go:251
INFO[0000] Loading series map and head chunks...         source=storage.go:421
INFO[0000] 0 series loaded.                              source=storage.go:432
INFO[0000] Starting target manager...                    source=targetmanager.go:61
INFO[0000] Listening on :9090                            source=web.go:259
通过启动日志,可以看到 Prometheus Server 默认端口是 9090。
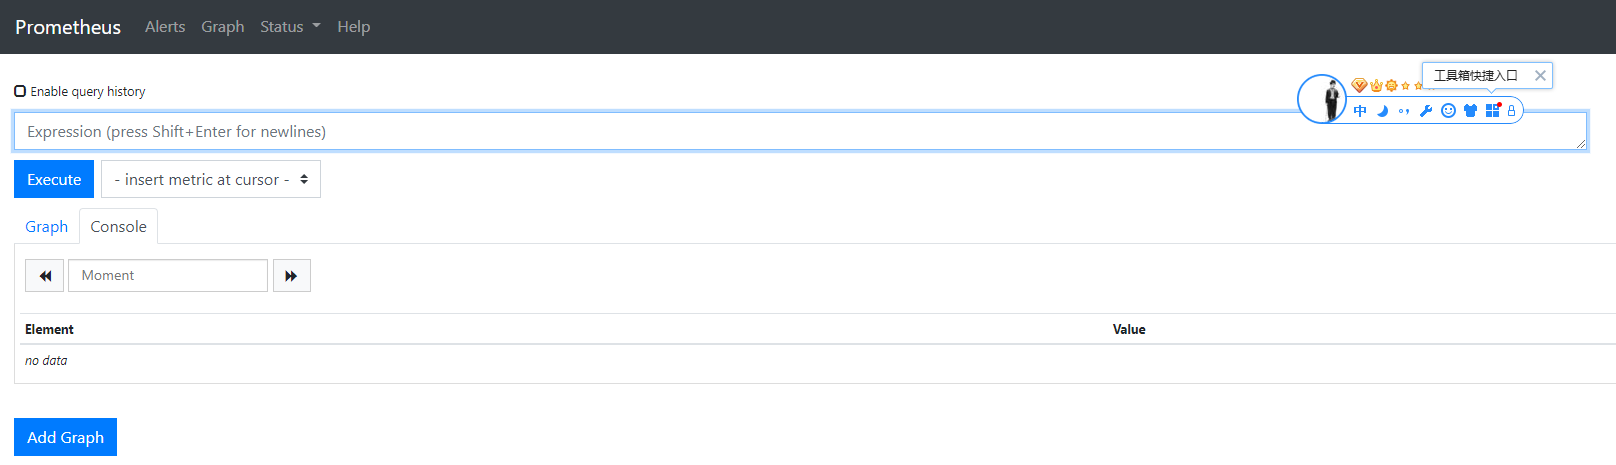
当 Prometheus 启动后,你可以通过浏览器来访问 http://IP:9090,将看到如下页面
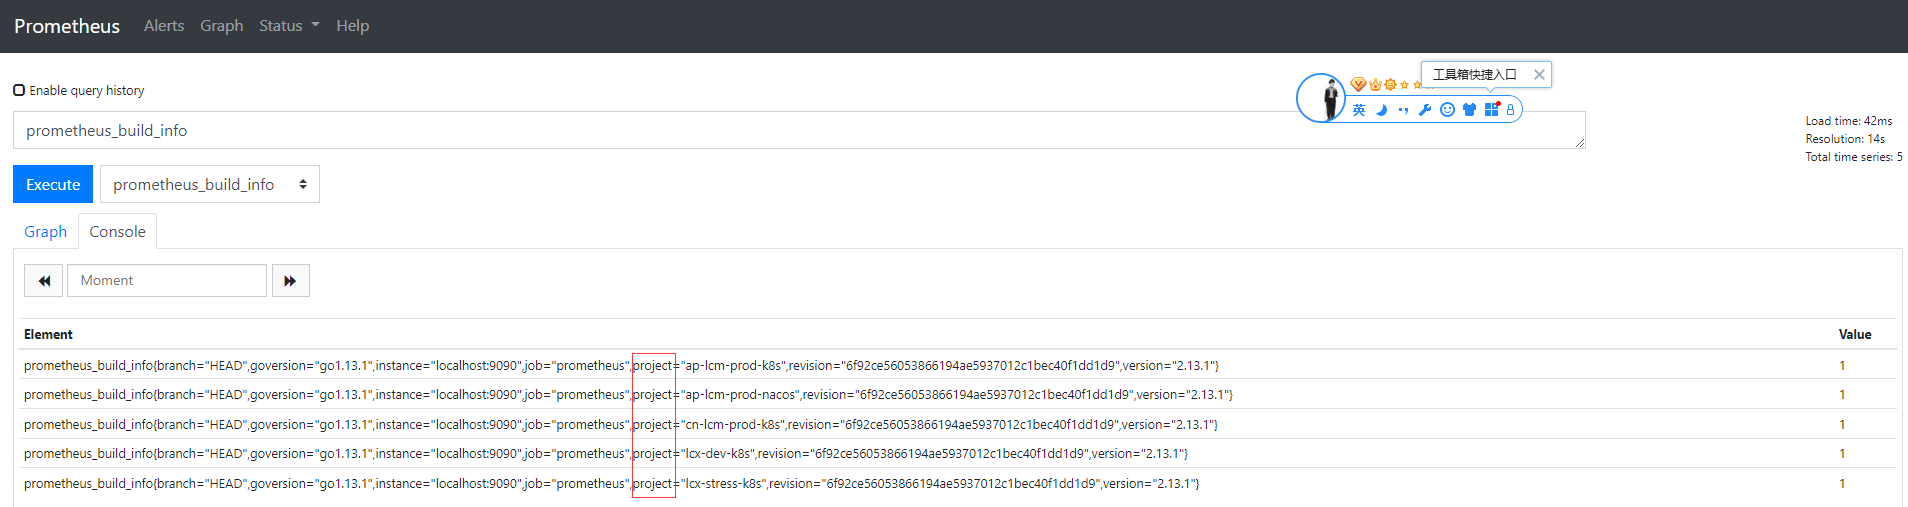
在默认配置中,我们已经添加了 Prometheus Server 的监控,所以我们现在可以使用 PromQL (Prometheus Query Language)来查看,比如:
(因为用线上项目做写作的文档,所以这里有很多项目,这个根据实际情况来看)
1.3 总结
1.可以看出 Prometheus 二进制安装非常方便,没有依赖,自带查询 web 界面。
2.在生产环境中,我们可以将 Prometheus 添加到 init 配置里,或者使用 supervisord 作为服务自启动。
3.有一点要注意:prometheus默认时区为UTC且无法改变时区,官方建议在用户的web ui中重新设置时区,因此我们的告警时间应该+8:00
2.Docker安装
首先确保你已安装了最新版本的 Docker
Docker 镜像地址 Quay.io
执行命令安装:
$ docker run --name prometheus -d -p 127.0.0.1:9090:9090 quay.io/prometheus/prometheus
如果安装成功你可以访问 127.0.0.1:9090 查看到该页面:


 浙公网安备 33010602011771号