

R语言中绘制多组箱线图
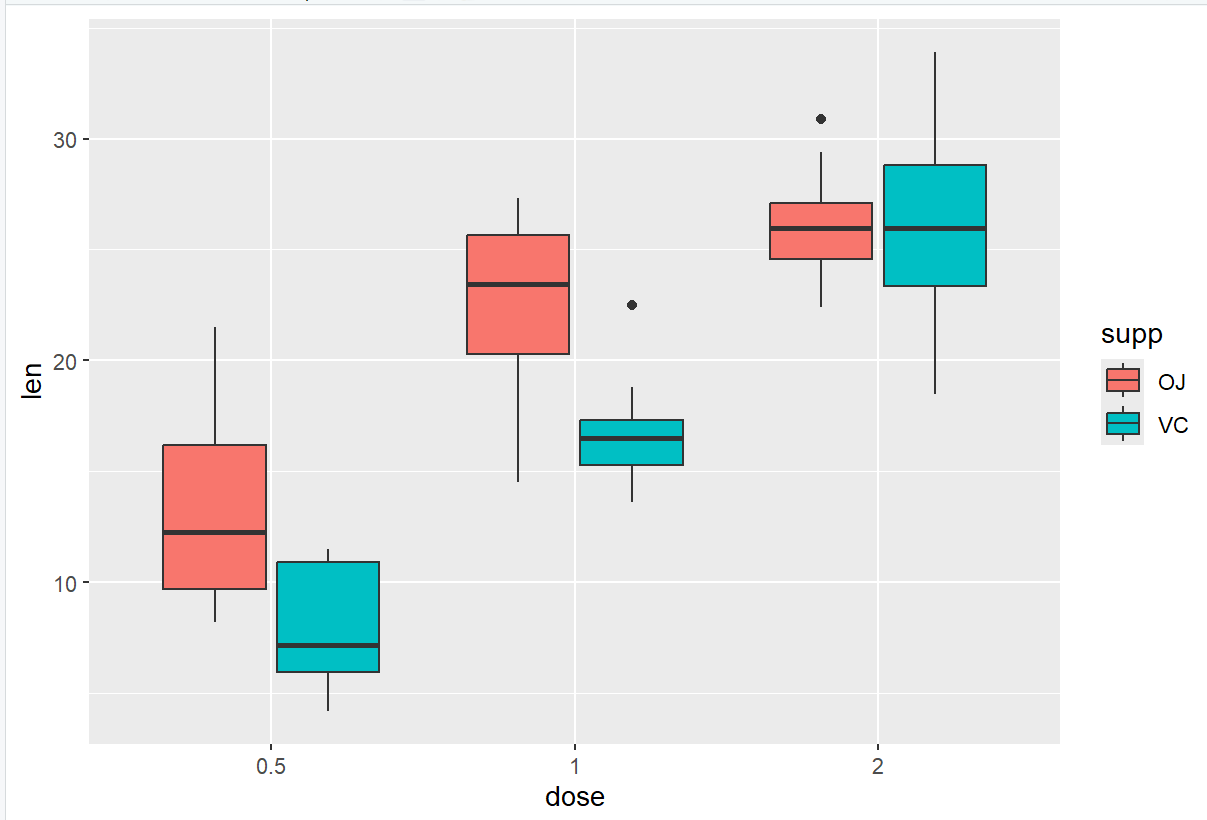
001、
library(ggplot2)
dim(ToothGrowth)
head(ToothGrowth)
ToothGrowth$dose = as.factor(ToothGrowth$dose)        ## 转换为因子
ggplot(ToothGrowth, aes(x=dose, y=len, fill=supp)) +
  geom_boxplot()
。
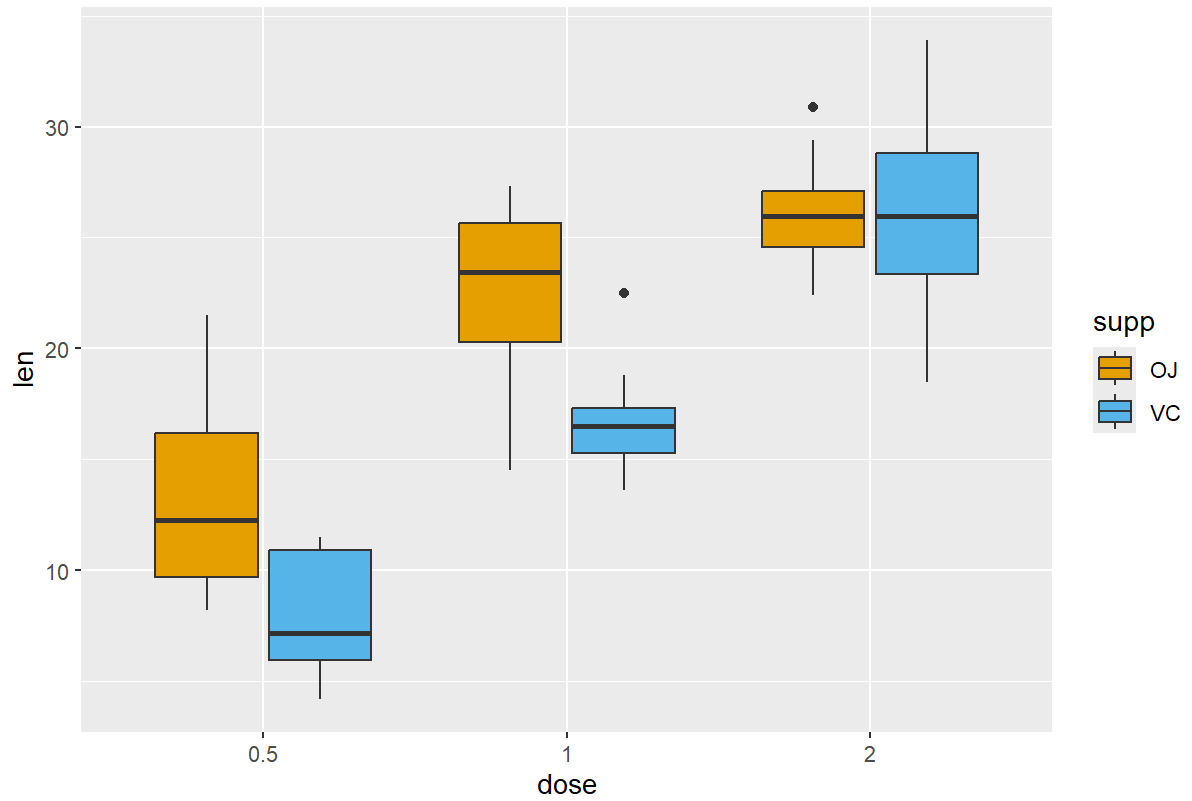
002、修改颜色
ggplot(ToothGrowth, aes(x=dose, y=len, fill=supp)) +
  geom_boxplot() + scale_fill_manual(values = c('#E69F00', '#56B4E9'))
。
ref:
01、https://zhuanlan.zhihu.com/p/397799549

 浙公网安备 33010602011771号