

R语言中points 函数
001、R语言中points 函数
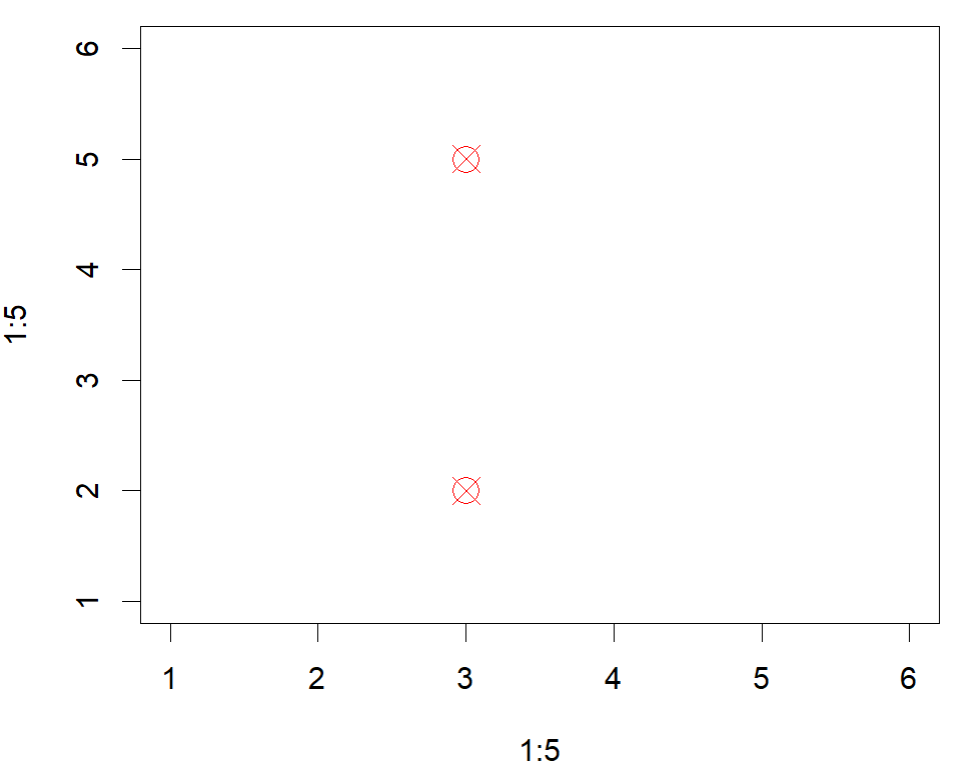
plot(1:5, 1:5, xlim = c(1,6), ylim = c(1,6), type = "n")
points(c(3,3), c(2,5), cex = 2, col = "red", pch = 13)
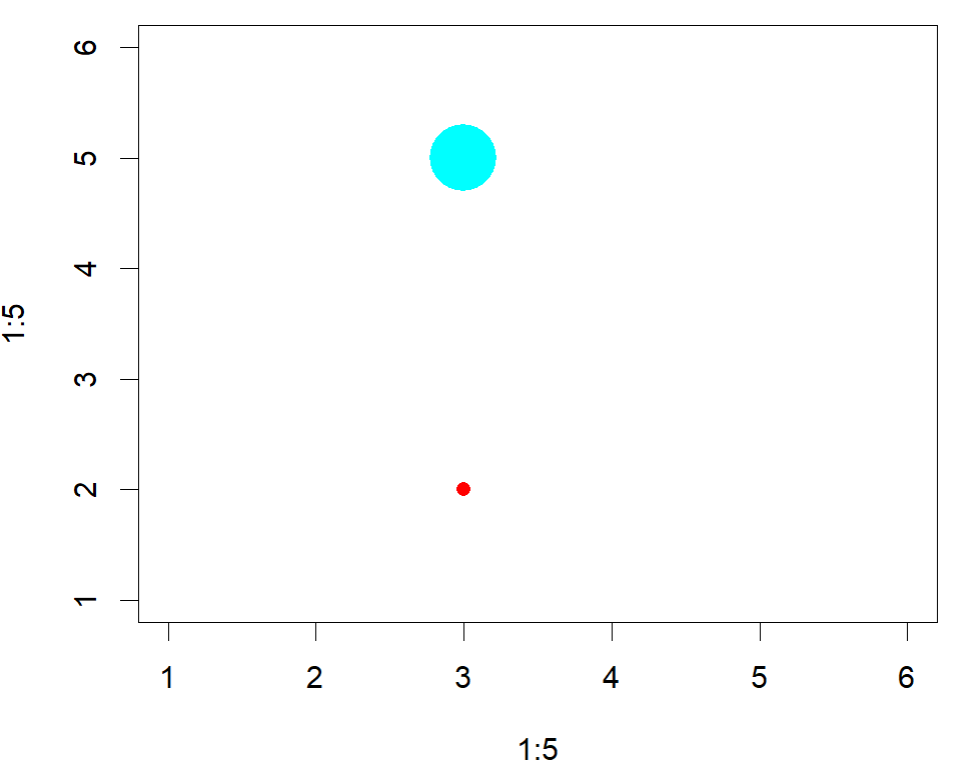
002、 调整大小、颜色
plot(1:5, 1:5, xlim = c(1,6), ylim = c(1,6), type = "n")
points(c(3,3), c(2,5), cex = c(1,5), col = c("red", "cyan"), pch = 16)
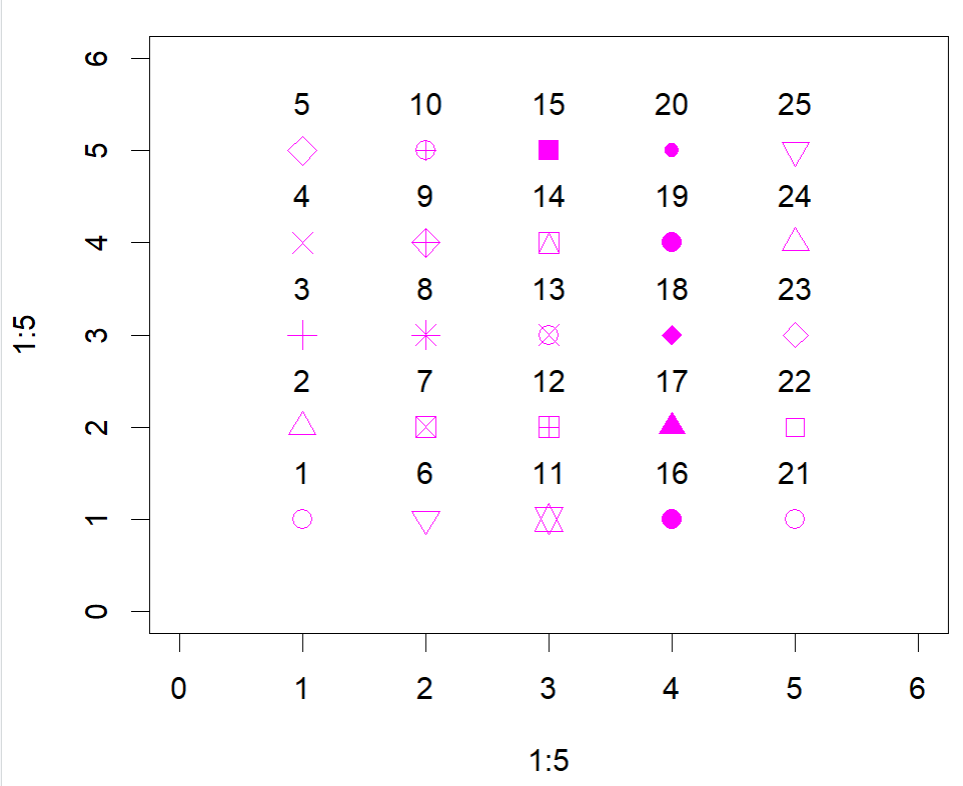
003、矩阵生成
plot(1:5, 1:5, xlim = c(0,6), ylim = c(0, 6), type = "n")
idx = 0
for (i in 1:5) {
  for (j in 1:5) {
  idx = idx + 1
  points(i, j, pch = idx, cex = 1.5, col = "magenta")
  text(i,j, labels = idx, pos = 3, offset = 1)
  }

}
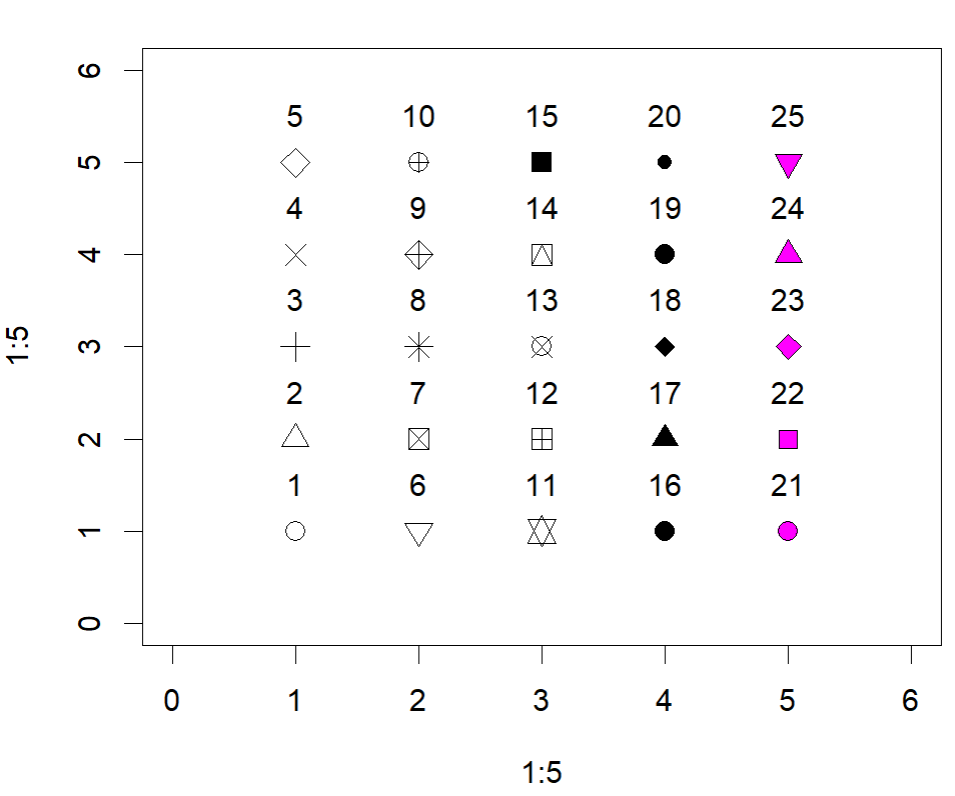
004、设置形状的填充色,只有pch的21-25才有填充色
plot(1:5, 1:5, xlim = c(0,6), ylim = c(0, 6), type = "n")
idx = 0
for (i in 1:5) {
  for (j in 1:5) {
  idx = idx + 1
  points(i, j, pch = idx, cex = 1.5, bg = "magenta")
  text(i,j, labels = idx, pos = 3, offset = 1)
  }

}
。

 浙公网安备 33010602011771号