R语言中barplot绘图设置不同分组之间的间距
001、
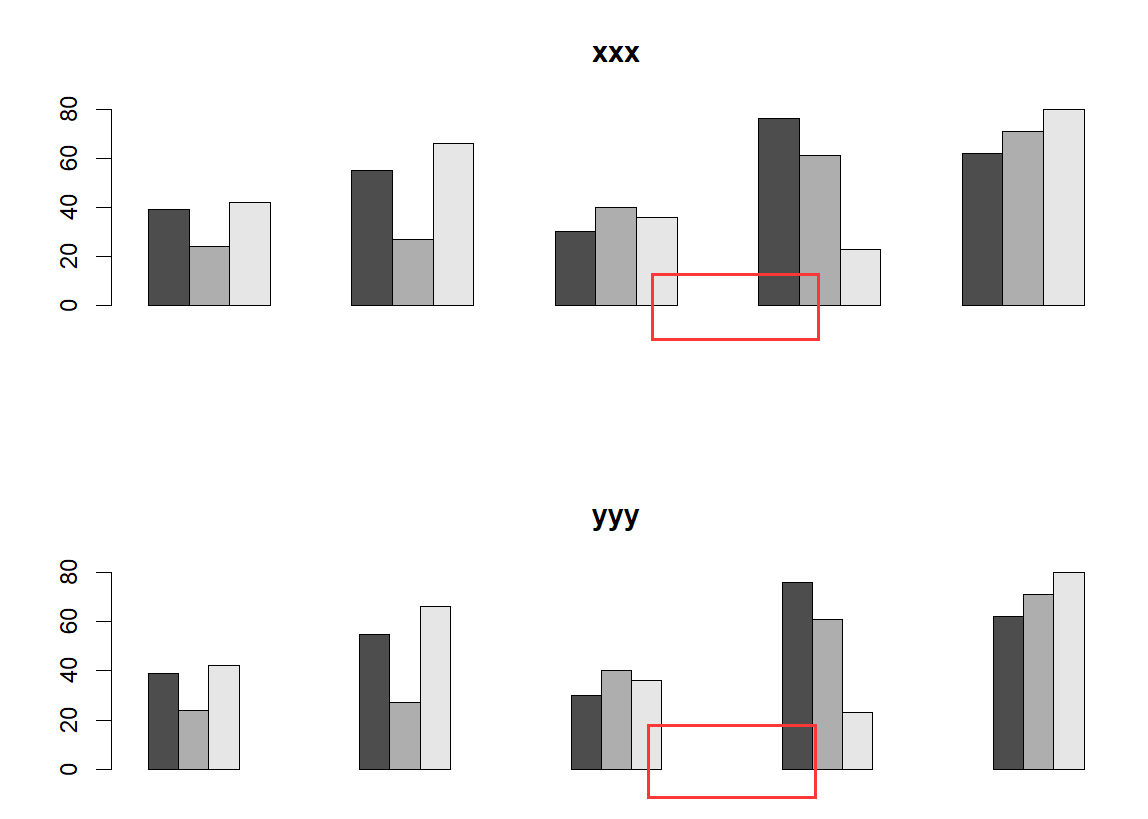
a <- sample(20:80,15)
a
b <- matrix(a,nrow=3)
b

par(mfrow = c(2, 1))
barplot(b,width=1,beside=T, space = c(0, 2), main = "xxx")
barplot(b,width=1,beside=T, space = c(0, 4), main = "yyy")
.


001、
a <- sample(20:80,15) a b <- matrix(a,nrow=3) b par(mfrow = c(2, 1)) barplot(b,width=1,beside=T, space = c(0, 2), main = "xxx") barplot(b,width=1,beside=T, space = c(0, 4), main = "yyy")
.

 浙公网安备 33010602011771号