

R语言中ggplot绘图绘制L型图形,并设置框线的粗细
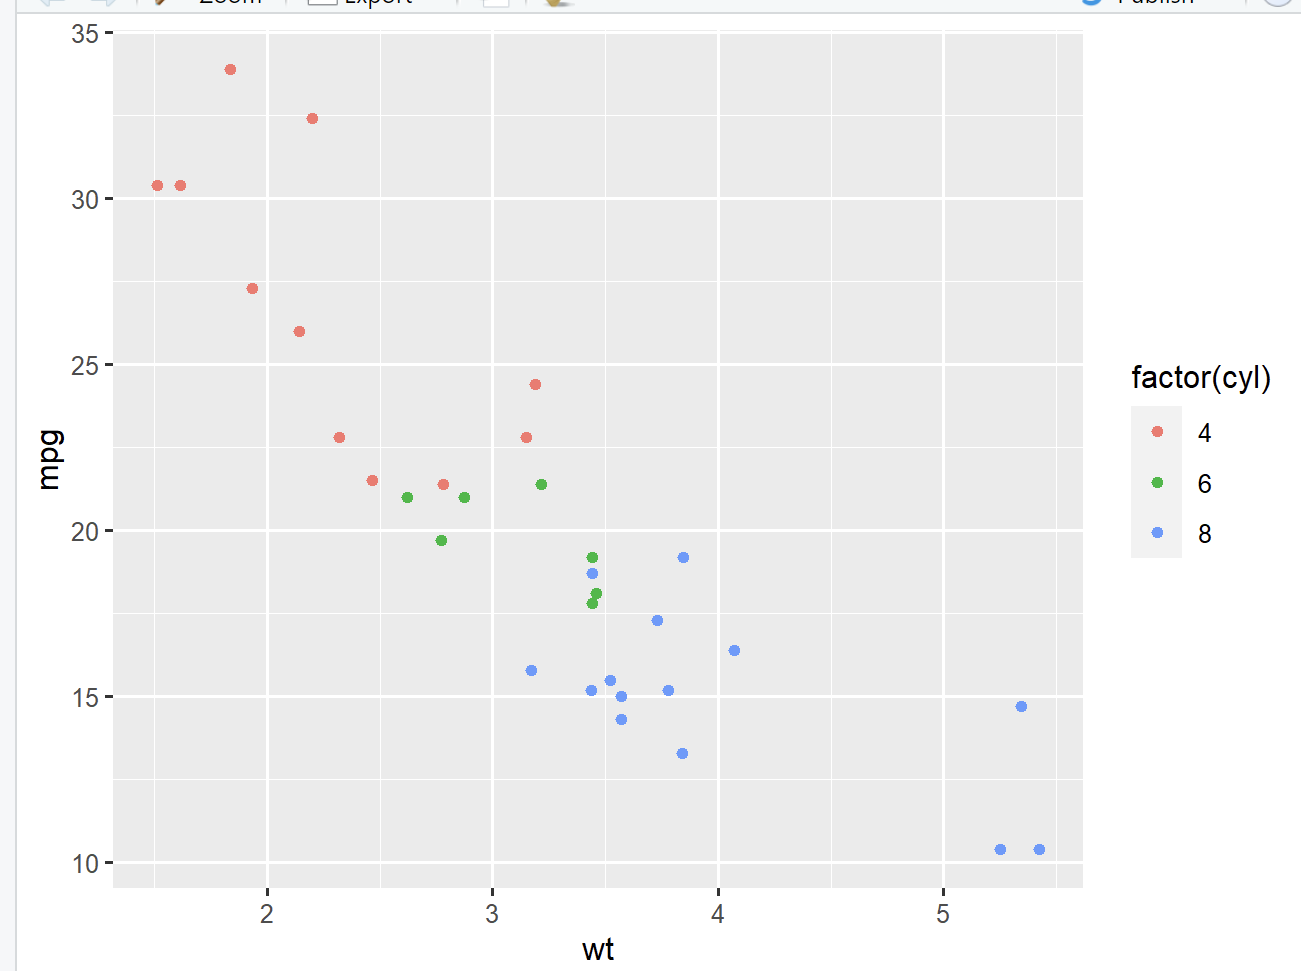
001、基础绘图
library(ggplot2)            ## 加载包

ggplot(data = mtcars,
       aes(x = wt, y = mpg,
           colour = factor(cyl))) +
  geom_point()              ## 绘制散点图
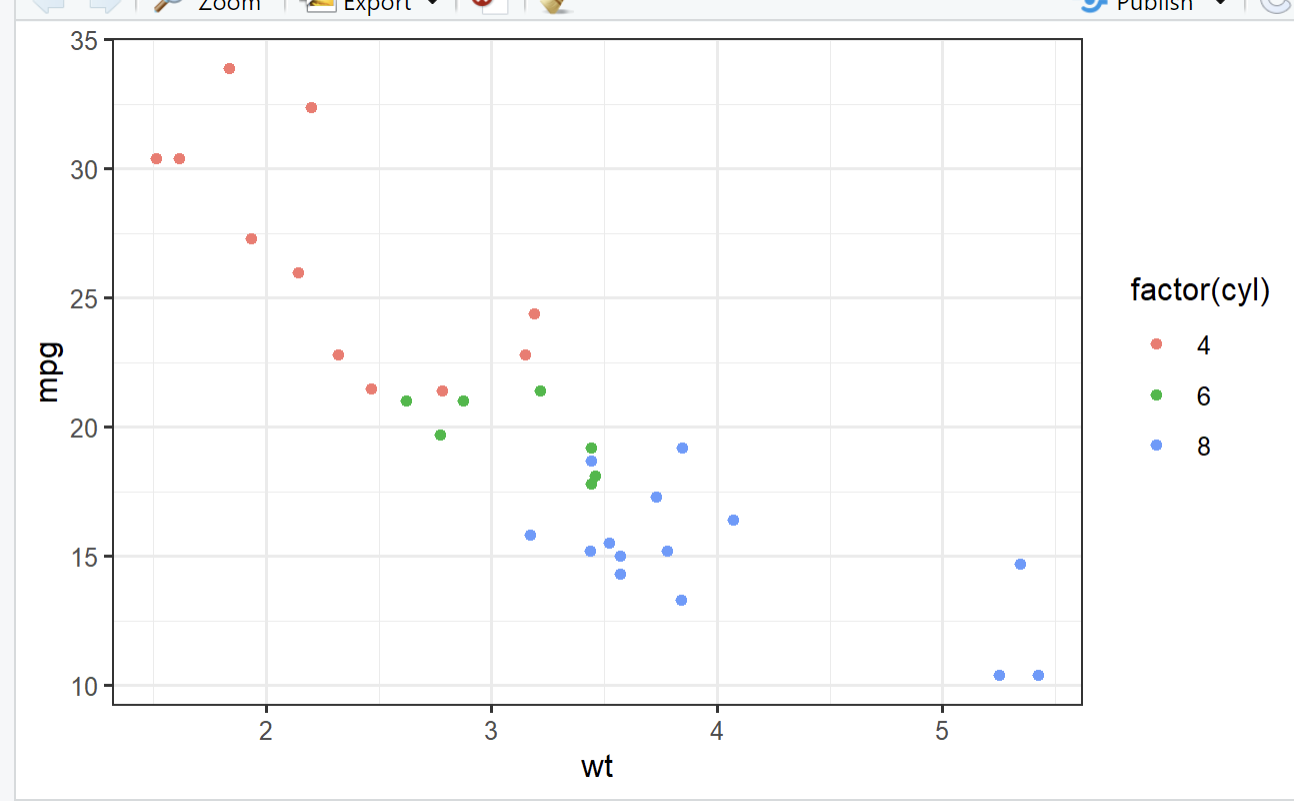
002、增加四边框线
library(ggplot2)#导入ggplot包

ggplot(data = mtcars,
       aes(x = wt, y = mpg,
           colour = factor(cyl))) +
  geom_point() +
  theme_bw()       ## 增加四边框线

#theme_classic()
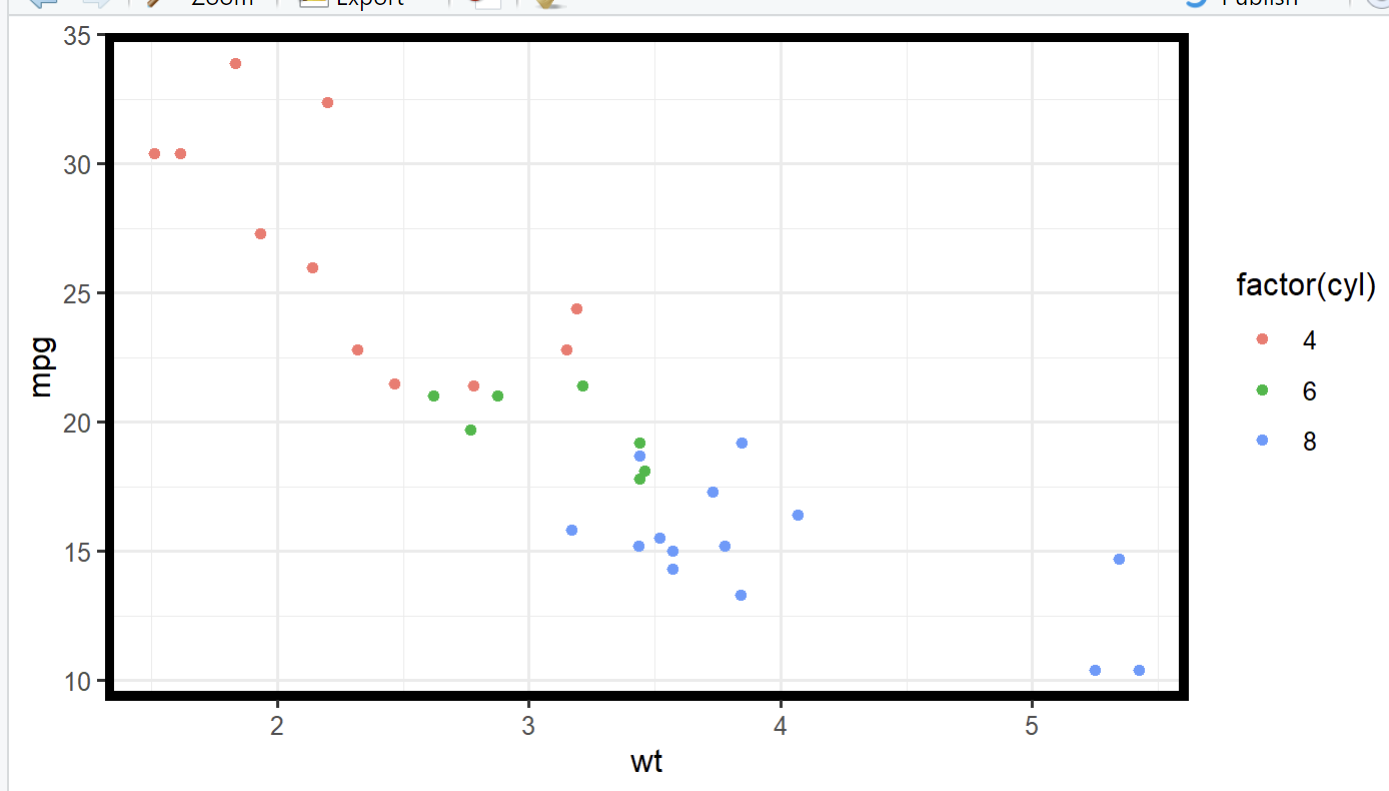
003、调整四边框线的粗细
library(ggplot2)#导入ggplot包

ggplot(data = mtcars,
       aes(x = wt, y = mpg,
           colour = factor(cyl))) +
  geom_point() +
  theme_bw()  +
  theme(panel.border = element_rect(color="black",
  size = 3.0, linetype="solid"))           ## 调整四边框线的粗细
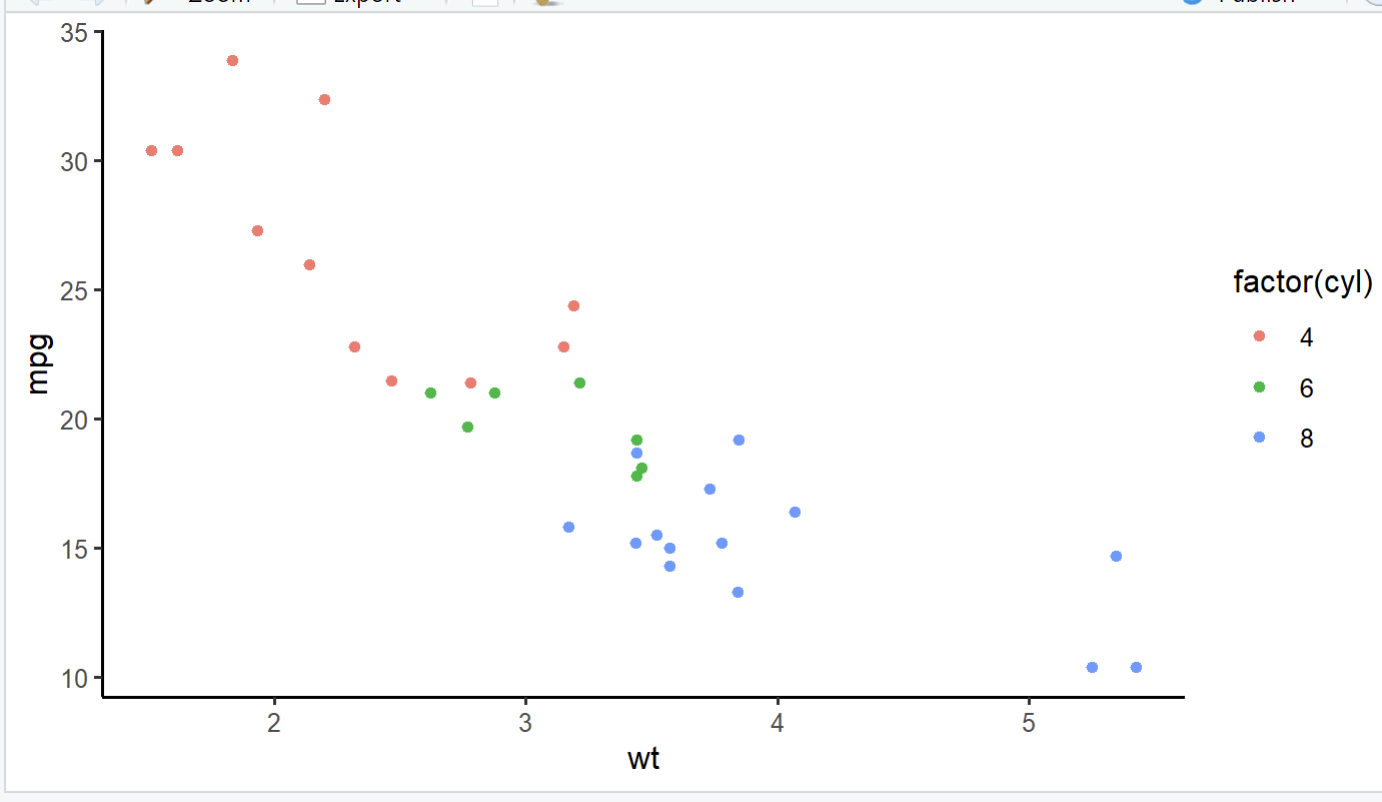
004、改为L型框线
library(ggplot2)#导入ggplot包

ggplot(data = mtcars,
       aes(x = wt, y = mpg,
           colour = factor(cyl))) +
  geom_point() +
theme_classic()            ## 改为L型框线
005、调整L型框线的粗细
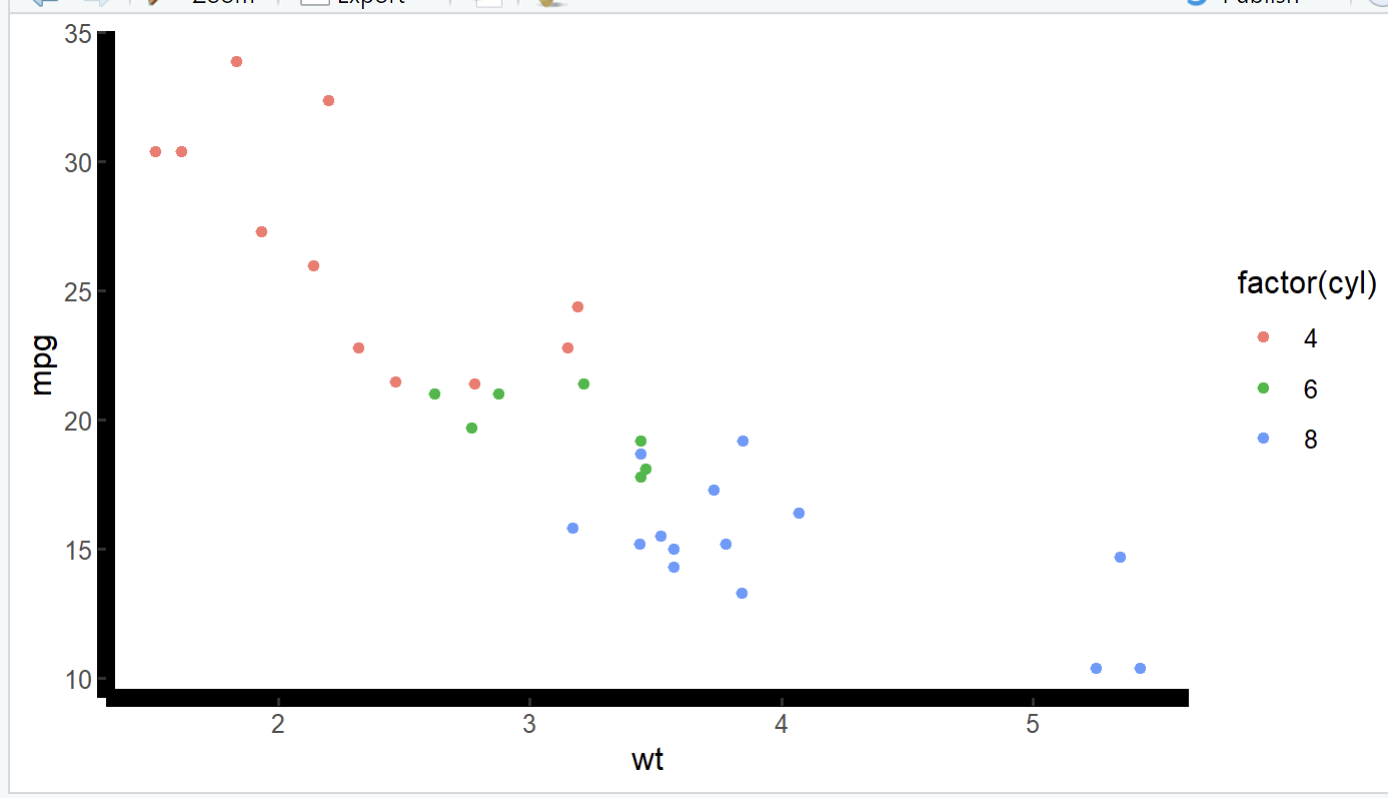
library(ggplot2)#导入ggplot包

ggplot(data = mtcars,
       aes(x = wt, y = mpg,
           colour = factor(cyl))) +
  geom_point() +
theme_classic() +
theme(axis.line=element_line(color="black",size = 3))     ## 调整L型框线的粗细
。

 浙公网安备 33010602011771号