

ggplot 中绘图设置 轴标签与绘图区域的间距
001、基础绘图
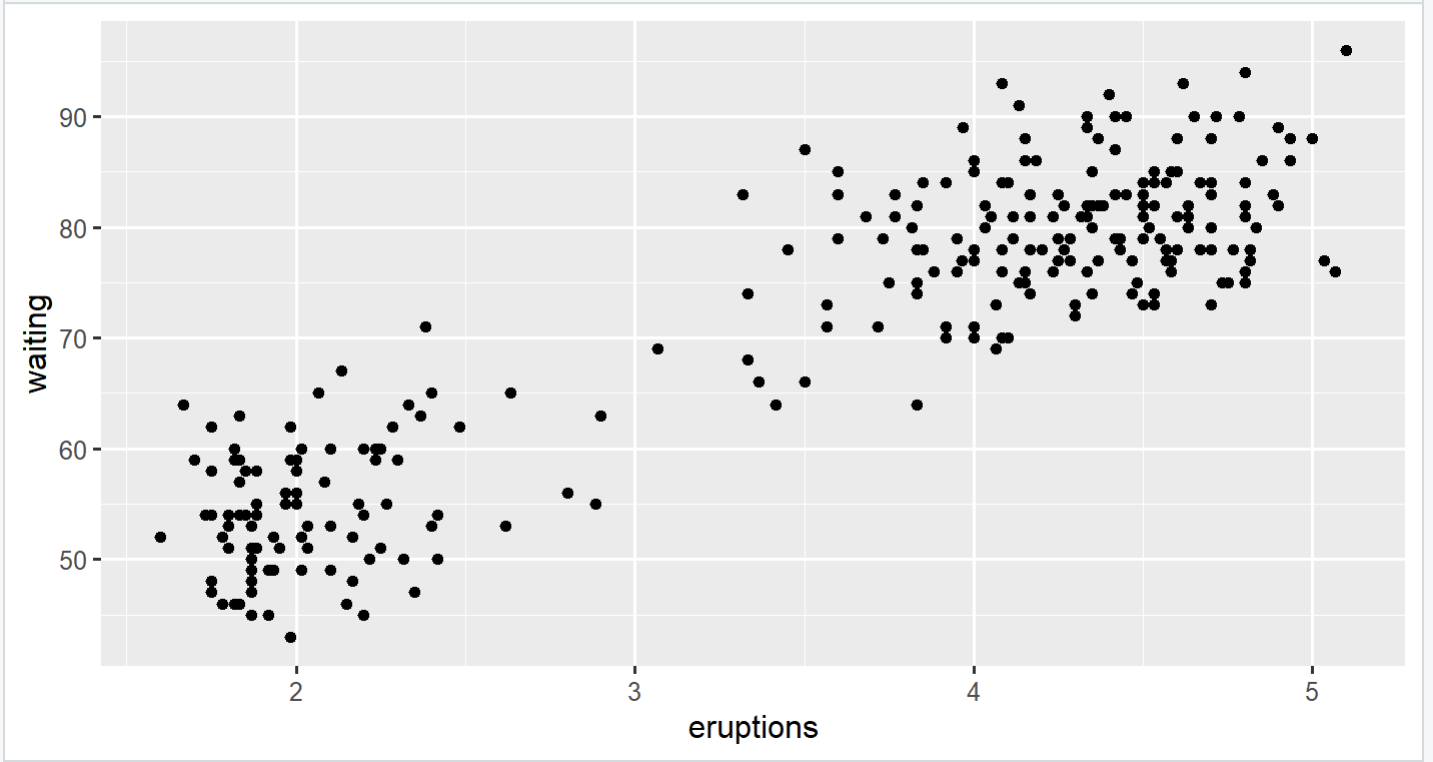
library(ggplot2)
p <- ggplot(faithful, aes(x = eruptions, y = waiting)) +
  geom_point()
p                                           ## 基础绘图
002、调整轴标签与绘图区域的间距
a、
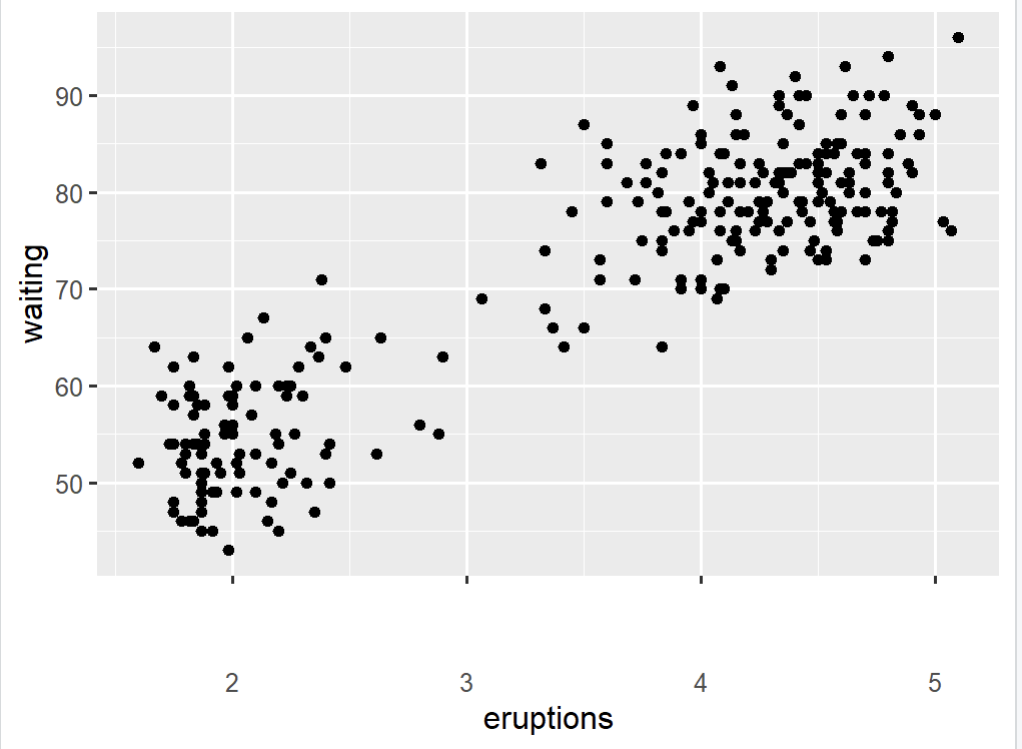
p + theme(axis.text.x=element_text(margin = margin(t = 30))) ## 调整x轴标签与绘图区域的间距
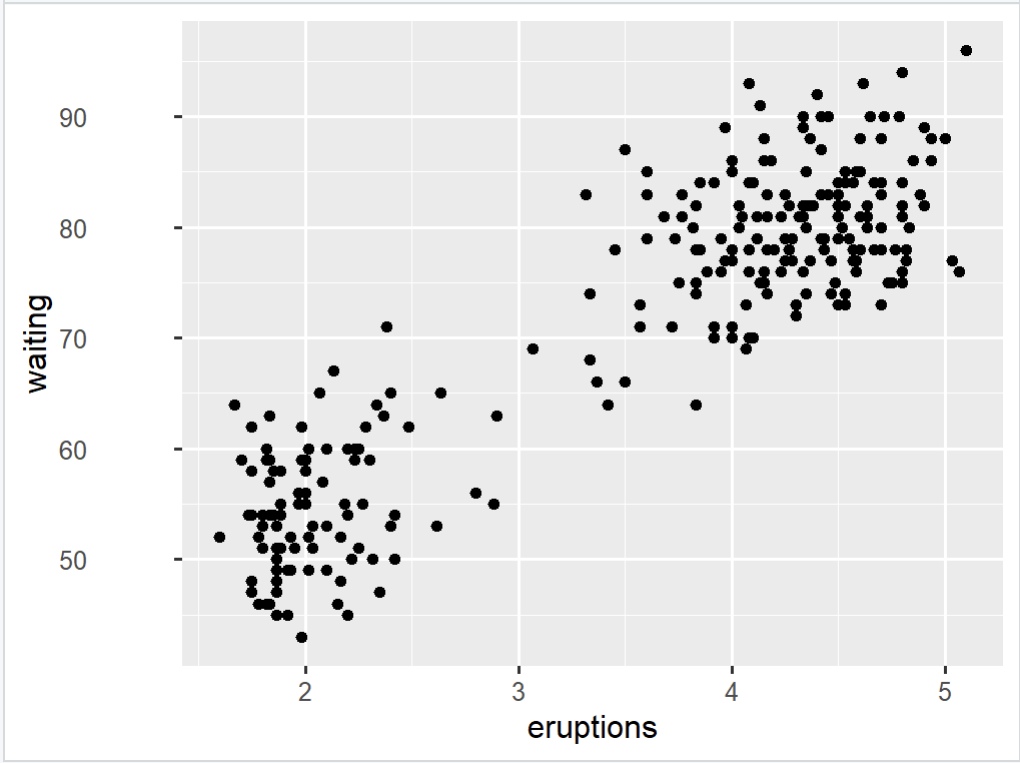
b、调整y轴标签与绘图区域的间距
p + theme(axis.text.y=element_text(margin = margin(r = 30))) ## 调整y轴标签与绘图区域的间距
参考:
01、https://qa.1r1g.com/sf/ask/3158163991/

 浙公网安备 33010602011771号