ggplot2绘图中移除图例
001、
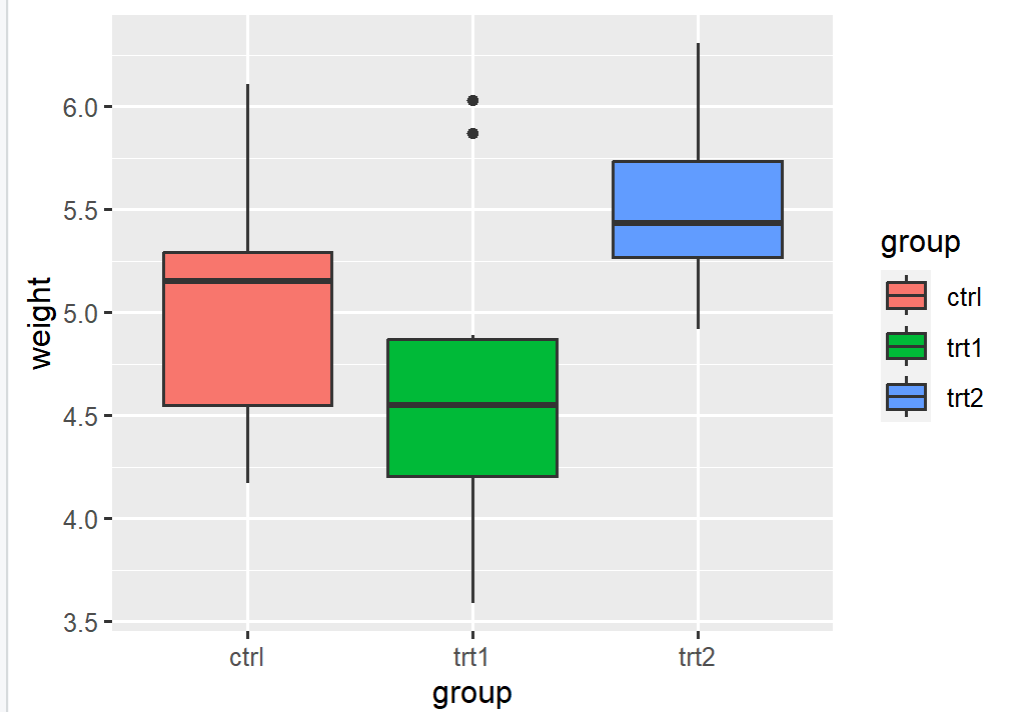
a、利用测试数据绘制箱线图
library(ggplot2)
bp <- ggplot(data=PlantGrowth, aes(x=group, y=weight, fill=group)) + geom_boxplot() ## 绘图
bp      ## 显示绘图结果
绘图结果如下:

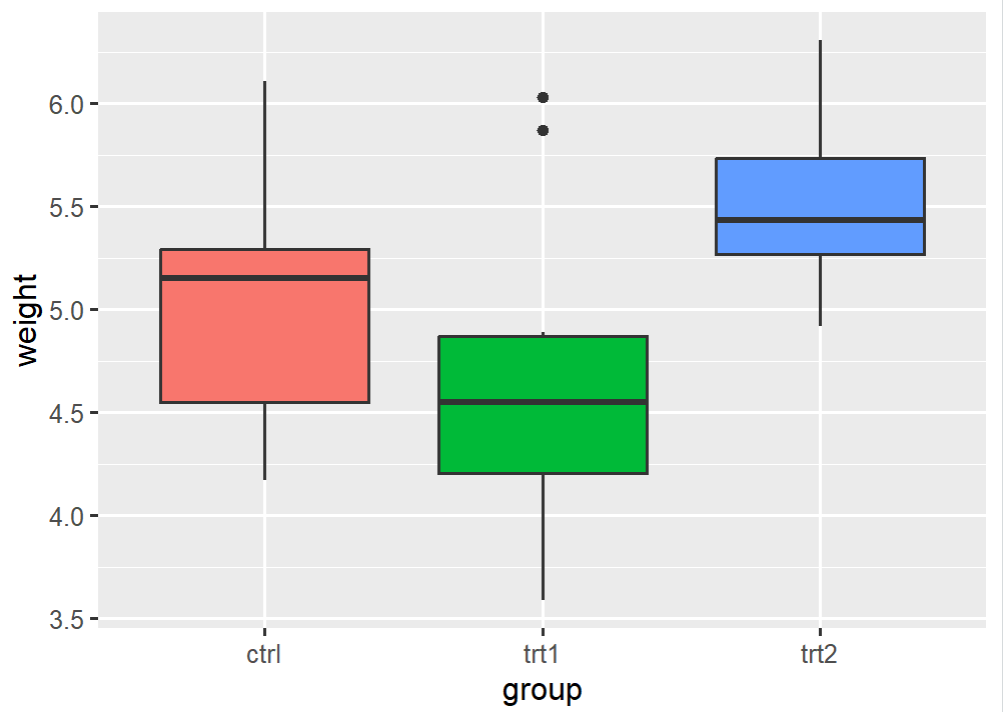
b、移除图例
bp + guides(fill=FALSE)
移除结果:

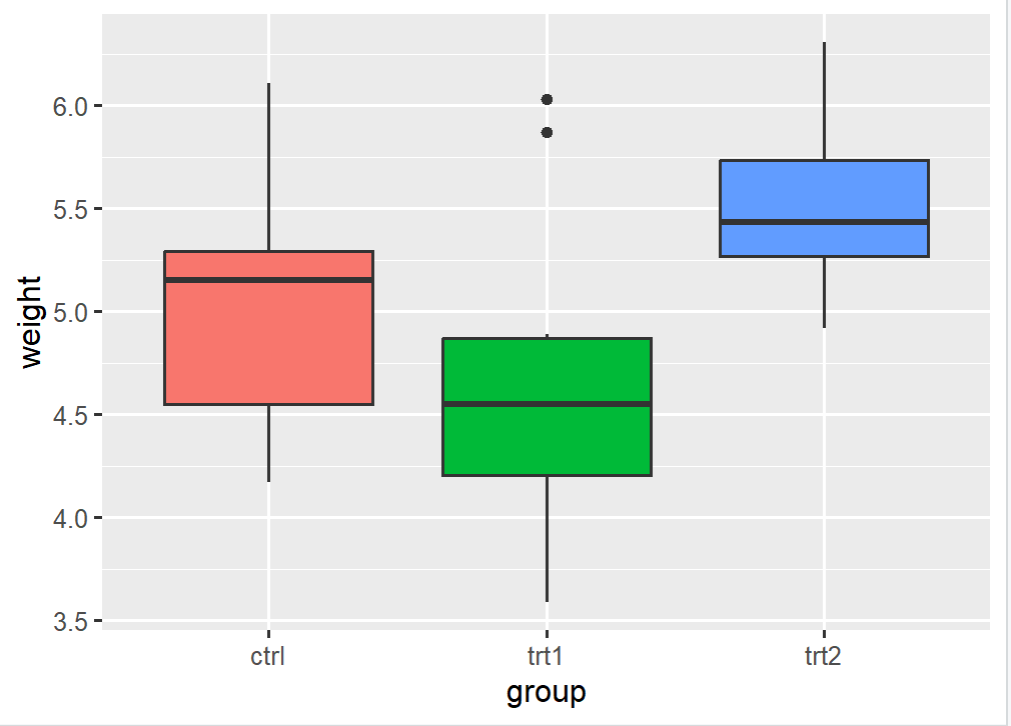
c、移除图例:
bp + scale_fill_discrete(guide=FALSE) ## 移除图例

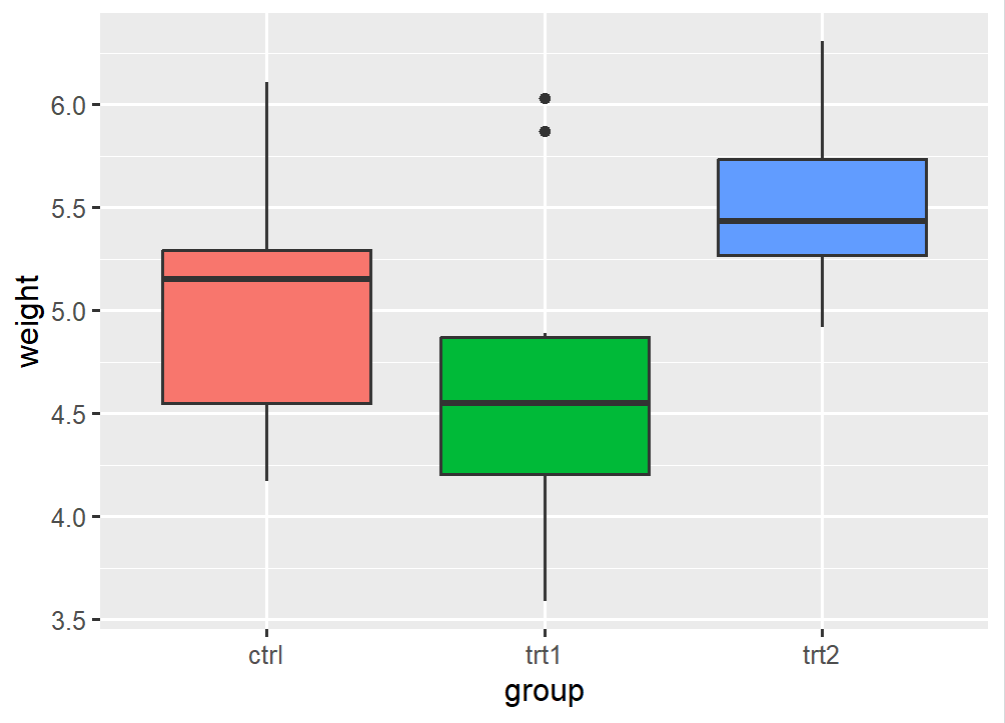
d、移除图例:
bp + theme(legend.position="none") ## 移除图例

参考:https://www.jb51.net/article/256254.htm


 浙公网安备 33010602011771号