R语言、02 案例2-1 Pelican商店、《商务与经济统计》案例题
 R语言之旅。原书P38页案例2-1教科书级解答,求百分数频数分布、条形图、饼形图、交叉分组表、散点图。
-
编程教材 《R语言实战·第2版》Robert I. Kabacoff
-
课程教材《商务与经济统计·原书第13版》 (安德森)
P48、案例2-1 Pelican 商店
PS C:\Users\小能喵喵喵\Desktop\R\homework\1_Pelican> tree /f
C:.
│   pelican.r
│
├───.vscode
│       launch.json
│
└───data
        PelicanStores.csv
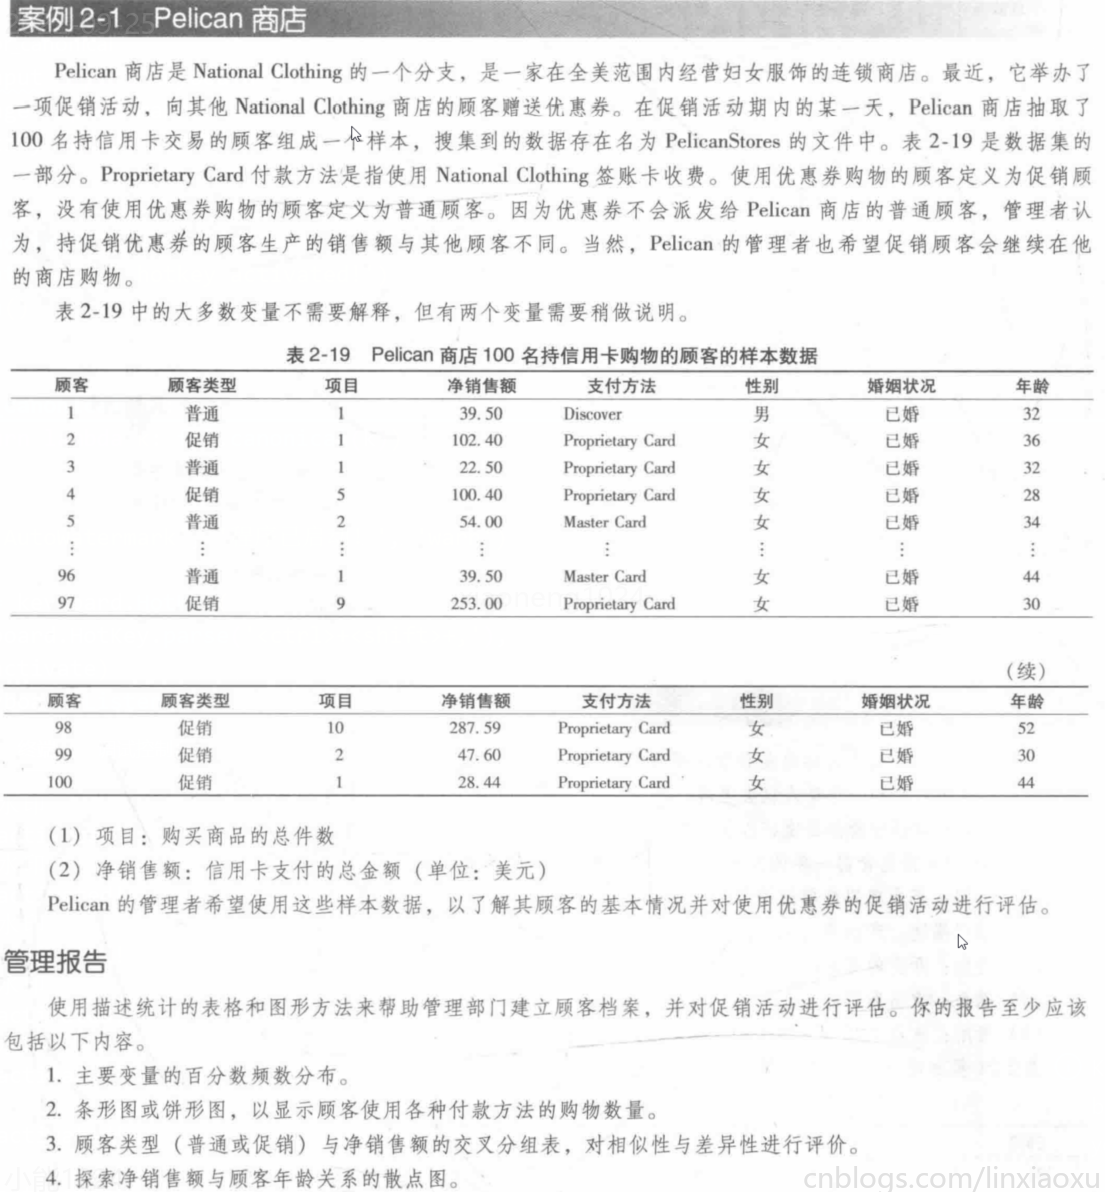
加载数据
编程教材p32 2.3.2
已知数据集为csv文件,所以要按间隔符形式导入。并删除带缺省值的列。
stores <- read.table("./data/PelicanStores.csv",
  header = TRUE, row.names = "Customer", sep = ","
)

res1 <- data.frame(stores)
library(dplyr)
res <- res1 %>% select_if(~ !any(is.na(.)))

print(summary(res))

View(res)
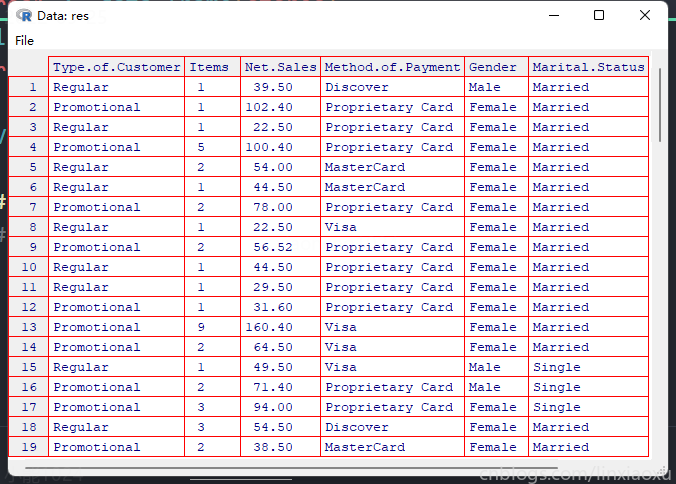
主要变量的百分数频数分布
编程教材 p21~30 、p137~143
顾客类型、支付类型
# ^ 百分数频数分布
# @ 客户类型
typeTable1 <- table(res$Type.of.Customer)
typeTable1 <- prop.table(typeTable1) * 100
print(typeTable1)
# @ 支付方法
typeTable2 <- table(res$Method.of.Payment)
typeTable2 <- prop.table(typeTable2) * 100
print(typeTable2)
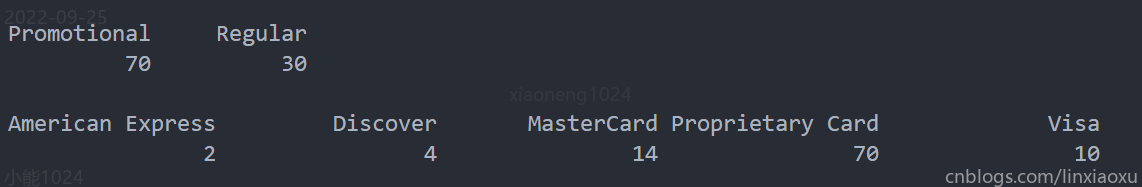
竖着显示方法、改成数据框
# @ 竖着显示方法
print(as.data.frame(typeTable2))
使用DescTools包Freq方法
install.packages("DescTools")
# ! 使用 DescTools
t1 <- Freq(res$Type.of.Customer)
View(t1)
# ! 使用 DescTools
t2 <- Freq(res$Method.of.Payment)
View(t2)

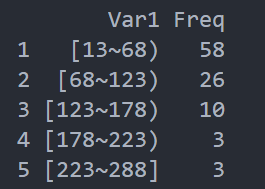
销售额类型
课程教材 p25 2.2.1
首先我们要确定组宽,公式为 \(近似组宽=\frac{数据最大值-数据最小值}{组数}\)
Max.=287.59 、Min.=13.23。数据项较少的情况下给定5组互不重叠的组数。组宽约等于 55
# @ 销售额频率分组
typeTable3 <- within(res, {
  group1 <- NA
  group1[Net.Sales >= 13 & Net.Sales < 68] <- "[13~68)"
  group1[Net.Sales >= 68 & Net.Sales < 123] <- "[68~123)"
  group1[Net.Sales >= 123 & Net.Sales < 178] <- "[123~178)"
  group1[Net.Sales >= 178 & Net.Sales < 233] <- "[178~223)"
  group1[Net.Sales >= 233 & Net.Sales <= 288] <- "[223~288]"
})
# print(head(sales))
typeTable4 <- table(typeTable3$group1)
typeTable4 <- prop.table(typeTable4) * 100
# @ 默认按字符串排序,重新排列表格列
typeTable4 <- typeTable4[c(2, 5, 1, 3, 4)]
print(as.data.frame(typeTable4))
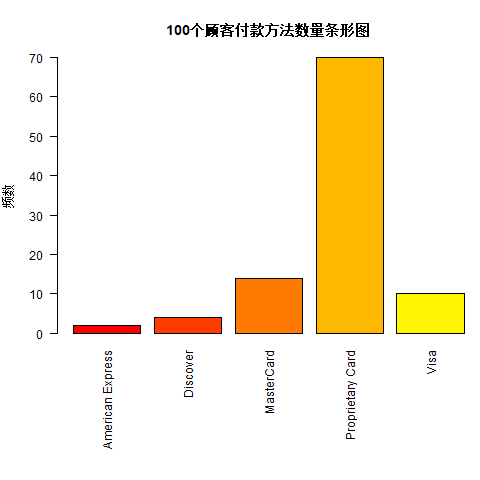
条形图或圆饼图显示顾客付款方法数量
编程教材 p110~117
条形图
# ^ 支付方式条形图
png(file = "typeTable2_barplot.png")
par(mar = c(10, 4, 4, 0))
barplot(typeTable2,
  main = "100个顾客付款方法数量条形图",
  xlab = "", ylab = "频数", las = 2, col = rainbow(25)
)
dev.off()
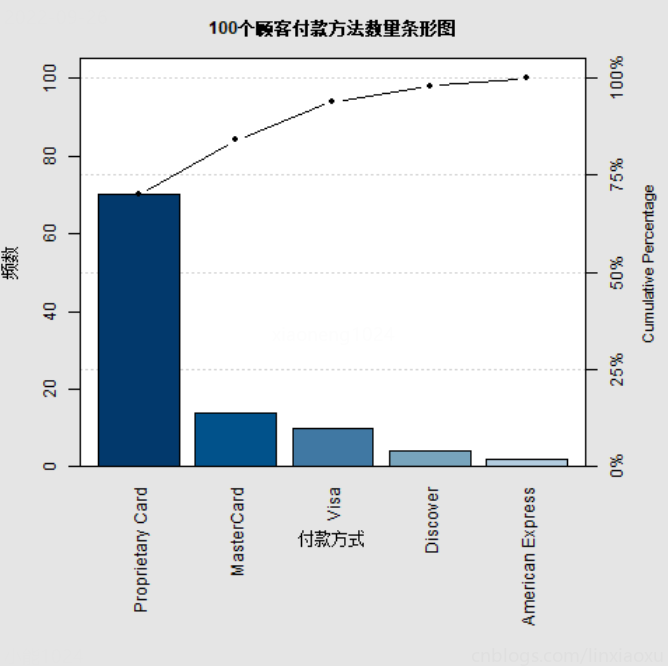
使用qcc包pareto.chart方法
# ! qcc包画条形图
library(qcc)
par(mar = c(6, 0, 0, 0))
pareto.chart(typeTable2,
  main = "100个顾客付款方法数量条形图",
  xlab = "付款方式", ylab = "频数"
)
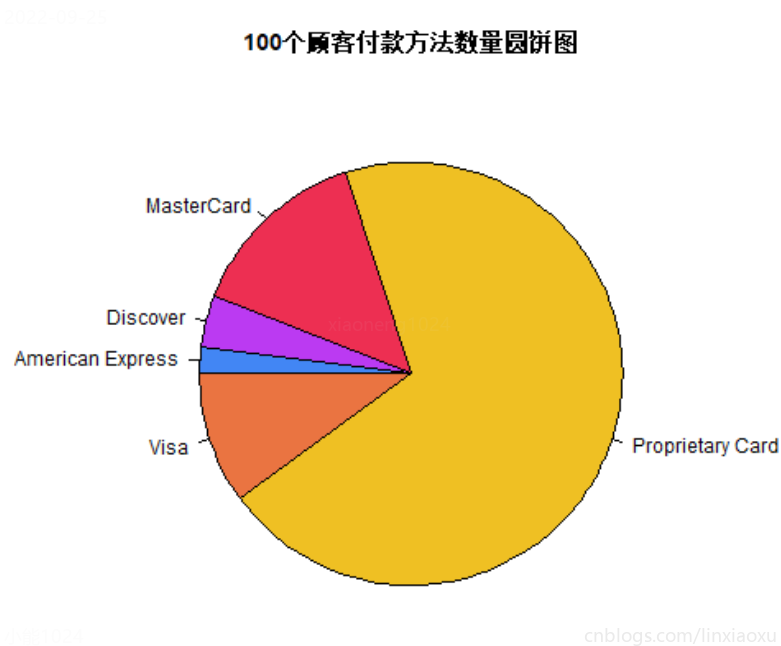
圆饼图
# ^ 支付方式圆饼图
png(file = "typeTable2_pie.png")
colors <- c("#4286f4", "#bb3af2", "#ed2f52", "#efc023", "#ea7441")
pie(typeTable2,
  main = "Daily Diet Plan",
  col = colors, init.angle = 180, clockwise = TRUE
)
dev.off()
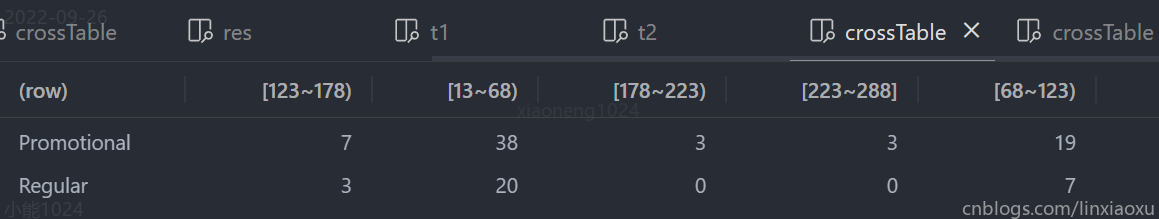
顾客类型与净销售额的交叉分组表
编程教材 p137~143 课程教材 p34
# ^ 顾客类型与净销售额的交叉分组表
crossTable <- with(typeTable3, table(Type.of.Customer, group1))
View(crossTable)
把交叉分组表中的项目转换成行百分比数或者列百分比数。顾客各类型数量差别太大会影响判断
# ^ 顾客类型与净销售额的交叉分组表
crossTable <- with(typeTable3, table(Type.of.Customer, group1))
View(crossTable)
# @ 转化成顾客类型的行百分比
# crossTable <- round(prop.table(crossTable, 1) * 100, 2)
# crossTable <- cbind(crossTable, sum = rowSums(crossTable[, 1:5]))
# @ 另一种方式
crossTable <- addmargins(round(prop.table(crossTable, 1) * 100, 1), 2)
View(crossTable)
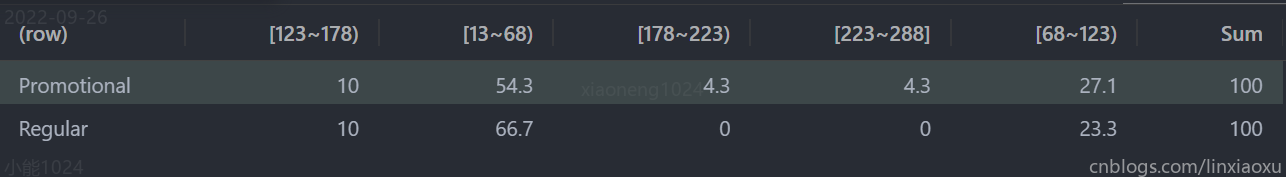
通过表格可知道普通顾客和促销顾客的净销售额较多聚集在13~68区间的净销售额,但促销顾客出现部分178~288区间的净销售额,是因为促销活动发的优惠卷促进了消费者的消费欲望,利用消费者的投机心理来促进多买行为。
净销售额与顾客年龄关系的散点图
# ^净销售额与顾客年龄关系的散点图

png(file = "res_scatterplot.png")

plot(
  x = res$Net.Sales, y = res$Age,
  xlab = "净销售额",
  ylab = "年龄",
  xlim = c(10, 300),
  ylim = c(20, 80),
  main = "净销售额与顾客年龄关系的散点图"
)

dev.off()
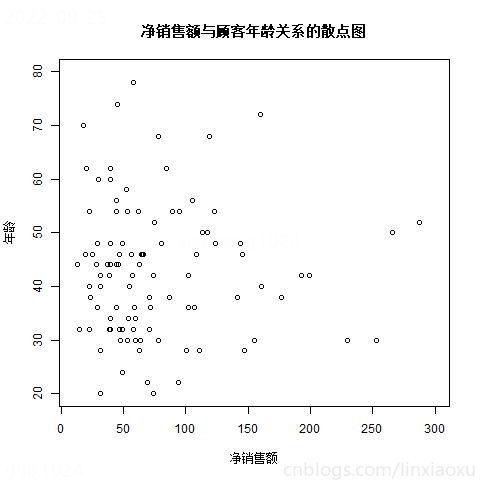
两个变量之间没有明显相关。但可以发现无论顾客年龄多少,净销售额大多都集中在0~150区间。
资料
每一行数据求和
cbind(crossTable, sum = rowSums(crossTable[, 1:5]))
使用函数添加的另外一种方式
addmargins(prop.table(mytable, 1), 2) # 加在列
addmargins(prop.table(mytable, 2), 1) # 加在行
RStudio table描述性统计,频数,频率,总和,百分比 - 知乎 (zhihu.com)
cbind函数给列命名
Set Column Names when Using cbind Function in R | Rename Variables (statisticsglobe.com)
scatterplots
R - Scatterplots (tutorialspoint.com)
piechart
R Tutorials (tutorialkart.com)
How to draw Pie Chart in R programming language (tutorialkart.com)
barplot 显示问题
graph - How to display all x labels in R barplot? - Stack Overflow
关于warning问题
带中文字符 R 语言经常会发出警告
options(warn=-1) #忽视任何警告
options(warn=1) #不放过任何警告
options(digits = 2) #将有效输出变为2
prop.table()
How to Use prop.table() Function in R (With Examples) - Statology
prop table in R: How Does the prop.table()

 浙公网安备 33010602011771号