


Turbine——Hystrix集群监控
上一篇文章讲述了如何利用Hystrix Dashboard去监控断路器的Hystrix command。当我们有很多个服务的时候,这就需要聚合所有服务的Hystrix Dashboard的数据了。这就需要用到Spring Cloud的另一个组件了,即Hystrix Turbine。
一、Hystrix Turbine简介
看单个的Hystrix Dashboard的数据并没有什么多大的价值,要想看多个系统或集群系统的Hystrix Dashboard数据就需要用到Hystrix Turbine。Hystrix Turbine将每个服务Hystrix Dashboard数据进行了整合。Hystrix Turbine的使用非常简单,只需要引入相应的依赖和加上注解和配置就可以了。
二、准备工作
因为我们需要监控多个服务的Dashboard,所以需要搭建一个Turbine服务来聚合监控 Hystrix 断路器,取名为spring-cloud-hystrix-turbine。
三、创建spring-cloud-hystrix-turbine
1、引入pom依赖
<project xmlns="http://maven.apache.org/POM/4.0.0" xmlns:xsi="http://www.w3.org/2001/XMLSchema-instance"
    xsi:schemaLocation="http://maven.apache.org/POM/4.0.0 http://maven.apache.org/xsd/maven-4.0.0.xsd">
    <modelVersion>4.0.0</modelVersion>
    <parent>
        <groupId>org.springframework.boot</groupId>
        <artifactId>spring-boot-starter-parent</artifactId>
        <version>1.5.9.RELEASE</version>
    </parent>
    <artifactId>spring-cloud-hystrix-turbine</artifactId>
    <dependencies>
        <dependency>
            <groupId>org.springframework.boot</groupId>
            <artifactId>spring-boot-starter-web</artifactId>
        </dependency>
        <dependency>
            <groupId>org.springframework.cloud</groupId>
            <artifactId>spring-cloud-starter-consul-discovery</artifactId>
        </dependency>
        <dependency>
            <groupId>org.springframework.cloud</groupId>
            <artifactId>spring-cloud-starter-consul-config</artifactId>
        </dependency>
        <dependency>
            <groupId>org.springframework.cloud</groupId>
            <artifactId>spring-cloud-starter-hystrix</artifactId>
        </dependency>
        <dependency>
            <groupId>org.springframework.cloud</groupId>
            <artifactId>spring-cloud-starter-hystrix-dashboard</artifactId>
        </dependency>
        <dependency>
            <groupId>org.springframework.boot</groupId>
            <artifactId>spring-boot-starter-actuator</artifactId>
        </dependency>
        <dependency>
            <groupId>org.springframework.cloud</groupId>
            <artifactId>spring-cloud-starter-netflix-turbine</artifactId>
            <exclusions>
                <exclusion>
                    <groupId>org.springframework.cloud</groupId>
                    <artifactId>
                        spring-cloud-starter-netflix-eureka-client
                    </artifactId>
                </exclusion>
            </exclusions>
        </dependency>
    </dependencies>
</project>
2、配置文件application.yml
spring:
  application:
    name: spring-cloud-hystrix-turbine
  cloud:
    consul:
      discovery:
        prefer-ip-address: true
        instanceId: ${spring.application.name}:${server.port}
      host: localhost
      port: 8500
server:
  port: 8810
turbine:
  aggregator:
    #监控所有微服务集群
    #hytrix仪表盘:http://localhost:8810/hystrix/
    #监控地址:http://localhost:8810/turbine.stream
    #在hystrix仪表盘中监控上面的地址即可
    clusterConfig: default
  #要监控的微服务serviceId
  appConfig: mcc-feign-hystrix,mcc-ribbon-hystrix,mcc-ribbon-hystrix-propagating
  clusterNameExpression: "'default'"
3、TurbineApplication——Turbine入口程序
package com.lynch.consumer.turbine;

import org.springframework.boot.SpringApplication;
import org.springframework.boot.autoconfigure.SpringBootApplication;
import org.springframework.cloud.netflix.hystrix.dashboard.EnableHystrixDashboard;
import org.springframework.cloud.netflix.turbine.EnableTurbine;

@SpringBootApplication
//开启Turbine支持,用来进行集群监控
@EnableTurbine
//开启Hystrix仪表盘
@EnableHystrixDashboard
public class TurbineApplication {
    public static void main(String[] args) {
        SpringApplication.run(TurbineApplication.class, args);
    }
}
四、Turbine演示
依次开启mcc-feign-hystrix、mcc-ribbon-hystrix、mcc-ribbon-hystrix-propagating、spring-cloud-hystrix-turbine工程。
打开浏览器输入:http://localhost:8810/turbine.stream,界面如下: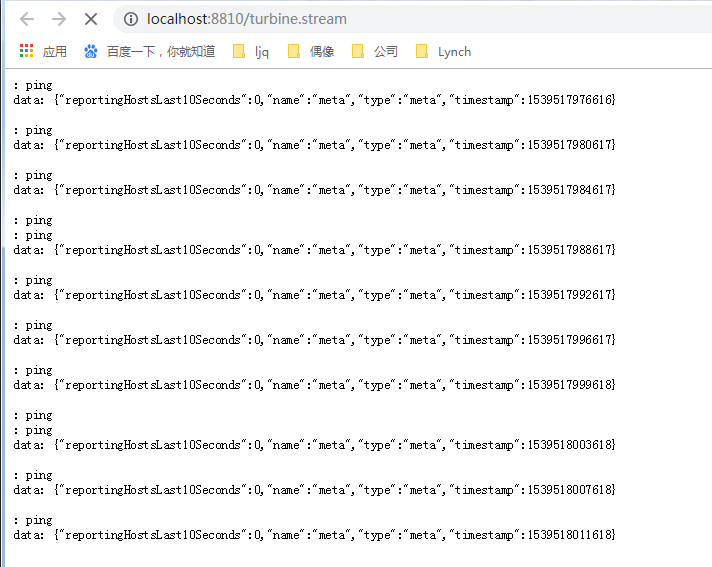
依次多次请求:
http://localhost:8807/ribbon/get/aa
http://localhost:8808/feign1/get/aa
hystrix断路器生效。
打开:http://localhost:8810/hystrix/,输入监控流http://localhost:8810/turbine.stream
点击monitor stream 进入页面: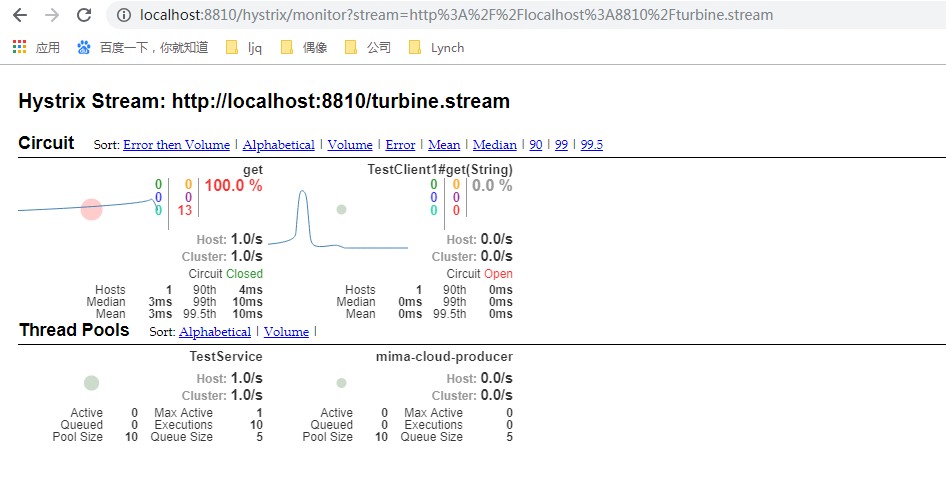
可以看到这个页面聚合了2个service的hystrix dashbord数据。
参数详解
OK,仪表盘已经显示出来了,那么仪表盘上的各项数据都是什么意思呢?我们来看下面一张图: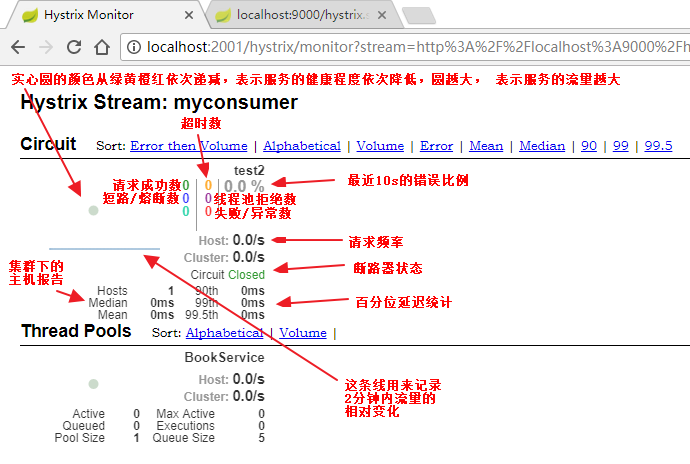

 浙公网安备 33010602011771号