
blktrace 编译与使用
在对ssd性能调优过程中,有使用到blktrace,本文对blktrace做一个记录
文章目录
- blktrace介绍
- blktrace aarch64移植
- 使用
- 实例
- 数据分析
- blktrace分析ssd性能差的问题实例
1. blktrace介绍
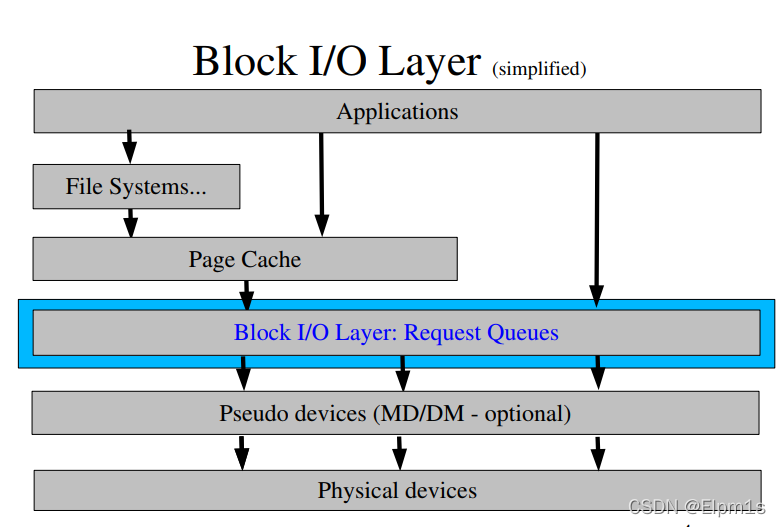
我们首先需要知道提交到 block I/O层的每个I/O执行的具体操作,如下图所示
blktrace功能如下:
- 提供关于单个I/O的详细的block layer信息
- 低开销内核跟踪机制(在I/O压力相对较大的情况下,对应用程序性能的影响不到2%)
- 可配置:
- 可以指定一个或多个物理设备或逻辑设备
- 用户可选择事件-可以在事件获取和/或格式化输出时指定过滤器
- 同时支持“实时”和“回放”跟踪
blktrace总体架构如下:

2. blktrace aarch64移植
首先对blktrace,blkparse ,btt做个简单的介绍,blktrace负责采集,blkparse负责对采集的数据进行解析,而btt能够协助分析统计
blktrace选项如下,常用的使用有
- -d dev #添加一个设备追踪
- -o file #指定输出文件的名字
root@a1000:~# blktrace --help
blktrace: unrecognized option '--help'
Usage: blktrace

-d <dev>             | --dev=<dev>
[ -r <debugfs path>  | --relay=<debugfs path> ]
[ -o <file>          | --output=<file>]
[ -D <dir>           | --output-dir=<dir>
[ -w <time>          | --stopwatch=<time>]
[ -a <action field>  | --act-mask=<action field>]
[ -A <action mask>   | --set-mask=<action mask>]
[ -b <size>          | --buffer-size]
[ -n <number>        | --num-sub-buffers=<number>]
[ -l                 | --listen]
[ -h <hostname>      | --host=<hostname>]
[ -p <port number>   | --port=<port number>]
[ -s                 | --no-sendfile]
[ -I <devs file>     | --input-devs=<devs file>]
[ -v <version>       | --version]
[ -V <version>       | --version]
        -d Use specified device. May also be given last after options
        -r Path to mounted debugfs, defaults to /sys/kernel/debug
        -o File(s) to send output to
        -D Directory to prepend to output file names
        -w Stop after defined time, in seconds
        -a Only trace specified actions. See documentation
        -A Give trace mask as a single value. See documentation
        -b Sub buffer size in KiB (default 512)
        -n Number of sub buffers (default 4)
        -l Run in network listen mode (blktrace server)
        -h Run in network client mode, connecting to the given host
        -p Network port to use (default 8462)
        -s Make the network client NOT use sendfile() to transfer data
        -I Add devices found in <devs file>
        -v Print program version info
        -V Print program version info
blkparse选项如下,常用的使用有
- -i input #输入包含跟踪数据的文件
- -o output #输出文件。如果未给出,则输出为标准输出
root@a1000:~# blkparse -h
Usage: blkparse

-i <file>           | --input=<file>
[ -a <action field> | --act-mask=<action field> ]
[ -A <action mask>  | --set-mask=<action mask> ]
[ -b <traces>       | --batch=<traces> ]
[ -d <file>         | --dump-binary=<file> ]
[ -D <dir>          | --input-directory=<dir> ]
[ -f <format>       | --format=<format> ]
[ -F <spec>         | --format-spec=<spec> ]
[ -h                | --hash-by-name ]
[ -o <file>         | --output=<file> ]
[ -O                | --no-text-output ]
[ -q                | --quiet ]
[ -s                | --per-program-stats ]
[ -t                | --track-ios ]
[ -w <time>         | --stopwatch=<time> ]
[ -M                | --no-msgs
[ -v                | --verbose ]
[ -V                | --version ]

        -a Only trace specified actions. See documentation
        -A Give trace mask as a single value. See documentation
        -b stdin read batching
        -d Output file. If specified, binary data is written to file
        -D Directory to prepend to input file names
        -f Output format. Customize the output format. The format field
           identifies can be found in the documentation
        -F Format specification. Can be found in the documentation
        -h Hash processes by name, not pid
        -i Input file containing trace data, or '-' for stdin
        -o Output file. If not given, output is stdout
        -O Do NOT output text data
        -q Quiet. Don't display any stats at the end of the trace
        -s Show per-program io statistics
        -t Track individual ios. Will tell you the time a request took
           to get queued, to get dispatched, and to get completed
        -w Only parse data between the given time interval in seconds.
           If 'start' isn't given, blkparse defaults the start time to 0
        -M Do not output messages to binary file
        -v More verbose for marginal errors
        -V Print program version info
btt选项如下,常用的使用有
- -i input #输入文件
root@a1000:~# btt -h
Usage: btt
[ -a               | --seek-absolute ]
[ -A               | --all-data ]
[ -B <output name> | --dump-blocknos=<output name> ]
[ -d <seconds>     | --range-delta=<seconds> ]
[ -D <dev;...>     | --devices=<dev;...> ]
[ -e <exe,...>     | --exes=<exe,...>  ]
[ -h               | --help ]
[ -i <input name>  | --input-file=<input name> ]
[ -I <output name> | --iostat=<output name> ]
[ -l <output name> | --d2c-latencies=<output name> ]
[ -L <freq>        | --periodic-latencies=<freq> ]
[ -m <output name> | --seeks-per-second=<output name> ]
[ -M <dev map>     | --dev-maps=<dev map>
[ -o <output name> | --output-file=<output name> ]
[ -p <output name> | --per-io-dump=<output name> ]
[ -P <output name> | --per-io-trees=<output name> ]
[ -q <output name> | --q2c-latencies=<output name> ]
[ -Q <output name> | --active-queue-depth=<output name> ]
[ -r               | --no-remaps ]
[ -s <output name> | --seeks=<output name> ]
[ -S <interval>    | --iostat-interval=<interval> ]
[ -t <sec>         | --time-start=<sec> ]
[ -T <sec>         | --time-end=<sec> ]
[ -u <output name> | --unplug-hist=<output name> ]
[ -V               | --version ]
[ -v               | --verbose ]
[ -X               | --easy-parse-avgs ]
[ -z <output name> | --q2d-latencies=<output name> ]
[ -Z               | --do-active
4. 实例
- 对/dev/nvme0n1p1进行采集,随后执行dd命令。
root@a1000:~# blktrace -d /dev/nvme0n1p1&
[1] 418
root@a1000:~# dd of=/dev/null if=/dev/nvme0n1p1 bs=1M count=512
512+0 records in
512+0 records out
536870912 bytes (537 MB, 512 MiB) copied, 0.74305 s, 723 MB/s
root@a1000:~# kill -9 418
[1]+  Killed                  blktrace -d /dev/nvme0n1p1
- 利用blkparse对blktrace采集的文件进行解析,其中-d 是输出二进制文件,方便btt分析,-o 是将blkparse解析的数据放入nvme_data中,可自行分析。
root@a1000:~# ls -lh nvme0n1p1.blktrace.0
-rw-r--r-- 1 root root 8.0M Jan 18 17:10 nvme0n1p1.blktrace.0
root@a1000:~# blkparse -i nvme0n1p1 -d nvme.blktrace.bin -o nvme_data
Input file nvme0n1p1.blktrace.0 added
Bad magic 0
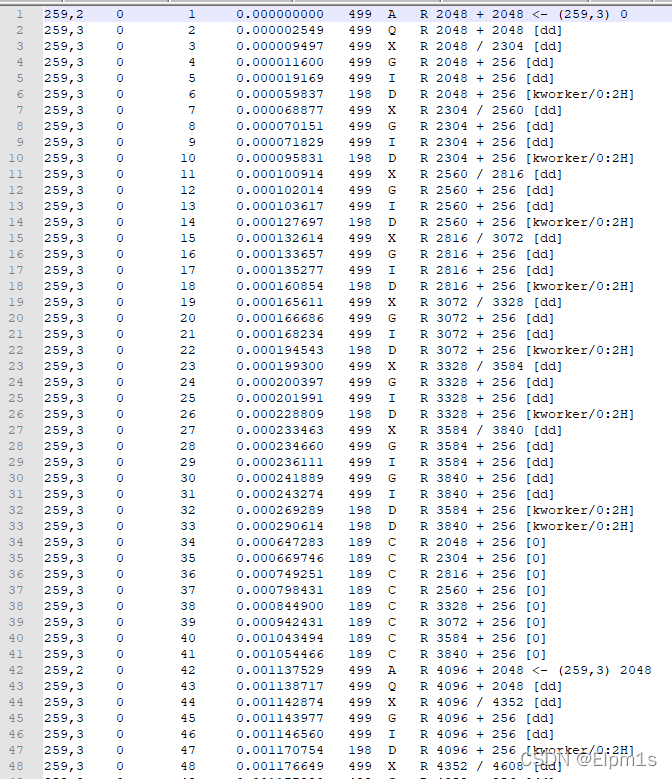
nvme_data原始数据内容如下:
- btt解析nvme.blktrace.bin
root@a1000:~# btt -i nvme.blktrace.bin
==================== All Devices ====================

            ALL           MIN           AVG           MAX           N
--------------- ------------- ------------- ------------- -----------

Q2Q               0.000151718   0.000393516   0.009215535        2912
Q2G               0.000002172   0.000002721   0.000030020        2912
D2C               0.000366797   0.000482912   0.000821314        2911
Q2C               0.000381274   0.000497561   0.000835603        2911

==================== Device Overhead ====================

       DEV |       Q2G       G2I       Q2M       I2D       D2C
---------- | --------- --------- --------- --------- ---------
 (259,  3) |   0.5470%   0.0000%   0.0000%   0.0000%  97.0557%
---------- | --------- --------- --------- --------- ---------
   Overall |   0.5470%   0.0000%   0.0000%   0.0000%  97.0557%

==================== Device Merge Information ====================

       DEV |       #Q       #D   Ratio |   BLKmin   BLKavg   BLKmax    Total
---------- | -------- -------- ------- | -------- -------- -------- --------
 (259,  3) |     2913     2912     1.0 |      256      255      256   745216

==================== Device Q2Q Seek Information ====================

       DEV |          NSEEKS            MEAN          MEDIAN | MODE
---------- | --------------- --------------- --------------- | ---------------
 (259,  3) |            2913             0.7               0 | 0(2912)
---------- | --------------- --------------- --------------- | ---------------
   Overall |          NSEEKS            MEAN          MEDIAN | MODE
   Average |            2913             0.7               0 | 0(2912)

==================== Device D2D Seek Information ====================

       DEV |          NSEEKS            MEAN          MEDIAN | MODE
---------- | --------------- --------------- --------------- | ---------------
 (259,  3) |            2912             0.7               0 | 0(2911)
---------- | --------------- --------------- --------------- | ---------------
   Overall |          NSEEKS            MEAN          MEDIAN | MODE
   Average |            2912             0.7               0 | 0(2911)

==================== Plug Information ====================

       DEV |    # Plugs # Timer Us  | % Time Q Plugged
---------- | ---------- ----------  | ----------------
 (259,  3) |       2912(         0) |   0.252751036%

       DEV |    IOs/Unp   IOs/Unp(to)
---------- | ----------   ----------
 (259,  2) |        0.0          0.0
 (259,  3) |        1.0          0.0
---------- | ----------   ----------
   Overall |    IOs/Unp   IOs/Unp(to)
   Average |        1.0          0.0

==================== Active Requests At Q Information ====================

       DEV |  Avg Reqs @ Q
---------- | -------------
 (259,  3) |           0.0

==================== I/O Active Period Information ====================

       DEV |     # Live      Avg. Act     Avg. !Act % Live
---------- | ---------- ------------- ------------- ------
 (259,  2) |          0   0.000000000   0.000000000   0.00
 (259,  3) |       1331   0.000716134   0.000144799  83.19
---------- | ---------- ------------- ------------- ------
 Total Sys |       1331   0.000716134   0.000144799  83.19

# Total System
#     Total System : q activity
  0.000006160   0.0
  0.000006160   0.4
  1.145925500   0.4
  1.145925500   0.0

#     Total System : c activity
  0.000537965   0.5
  0.000537965   0.9
  1.145756949   0.9
  1.145756949   0.5

# Per device
#            259,3 : q activity
  0.000006160   1.0
  0.000006160   1.4
  1.145925500   1.4
  1.145925500   1.0

#            259,3 : c activity
  0.000537965   1.5
  0.000537965   1.9
  1.145756949   1.9
  1.145756949   1.5

# Per process
#               dd : q activity
  0.000006160   2.0
  0.000006160   2.4
  1.145925500   2.4
  1.145925500   2.0

#               dd : c activity

#              irq : q activity

#              irq : c activity
  0.000537965   3.5
  0.000537965   3.9
  1.145756949   3.9
  1.145756949   3.5
5. 数据分析
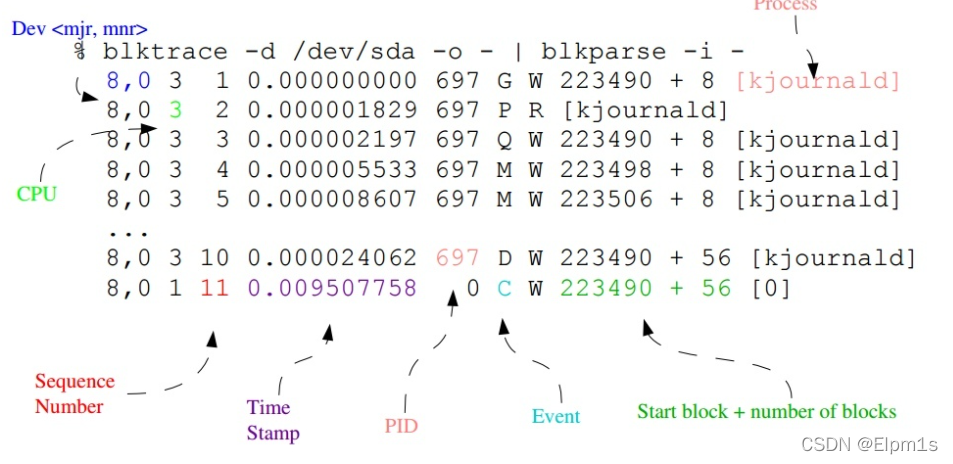
第7个字段在上图中没有标出来,它表示操作类型,具体含义是:
”R” for Read, “W” for Write, “D” for block, “B” for Barrier operation。
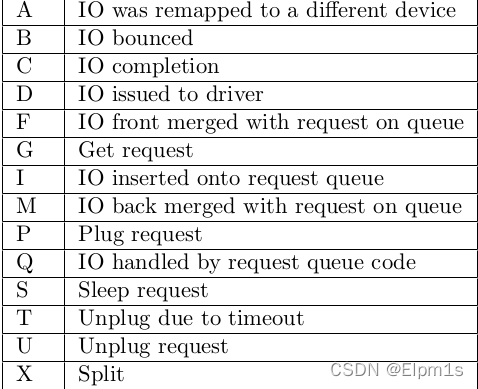
第6个字段Event解释如下:
 Q------->G------------>I--------->M------------------->D----------------------------->C
 |-Q time-|-Insert time-|
 |--------- merge time ------------|-merge with other IO|
 |----------------scheduler time time-------------------|---driver,adapter,storagetime--|

 |----------------------- await time in iostat output ----------------------------------|
其中:
Q2Q — time between requests sent to the block layer
Q2G — time from a block I/O is queued to the time it gets a request allocated for it
G2I — time from a request is allocated to the time it is Inserted into the device’s queue
Q2M — time from a block I/O is queued to the time it gets merged with an existing request
I2D — time from a request is inserted into the device’s queue to the time it is actually issued to the device
M2D — time from a block I/O is merged with an exiting request until the request is issued to the device
D2C — service time of the request by the device
Q2C — total time spent in the block layer for a request
blkparse解析出来的数据依旧是很难直接进行分析的,btt是对这些数据做一个总结。

 浙公网安备 33010602011771号